Climate for Station: Diredawa, Dire Dawa, Ethiopia
Loading live weather...
Climate Analysis & Overview
Diredawa, Ethiopia, is experiencing a complex climate narrative, with recent warming trends juxtaposed against long-term cooling patterns. The city's precipitation has become significantly more concentrated, posing challenges for local water management and agriculture.
Climate Classification and Geographic Influences
Diredawa falls under the Köppen climate classification of BSh, which denotes a semi-arid, hot steppe climate. Nestled in eastern Ethiopia, the city is shielded by the Chercher Mountains, influencing its microclimate by moderating extreme temperatures and affecting precipitation patterns. The geographical setting contributes to its unique climate dynamics, with the surrounding highlands potentially buffering some of the temperature variations observed in the data.
Temperature Trends: A Tale of Two Timelines
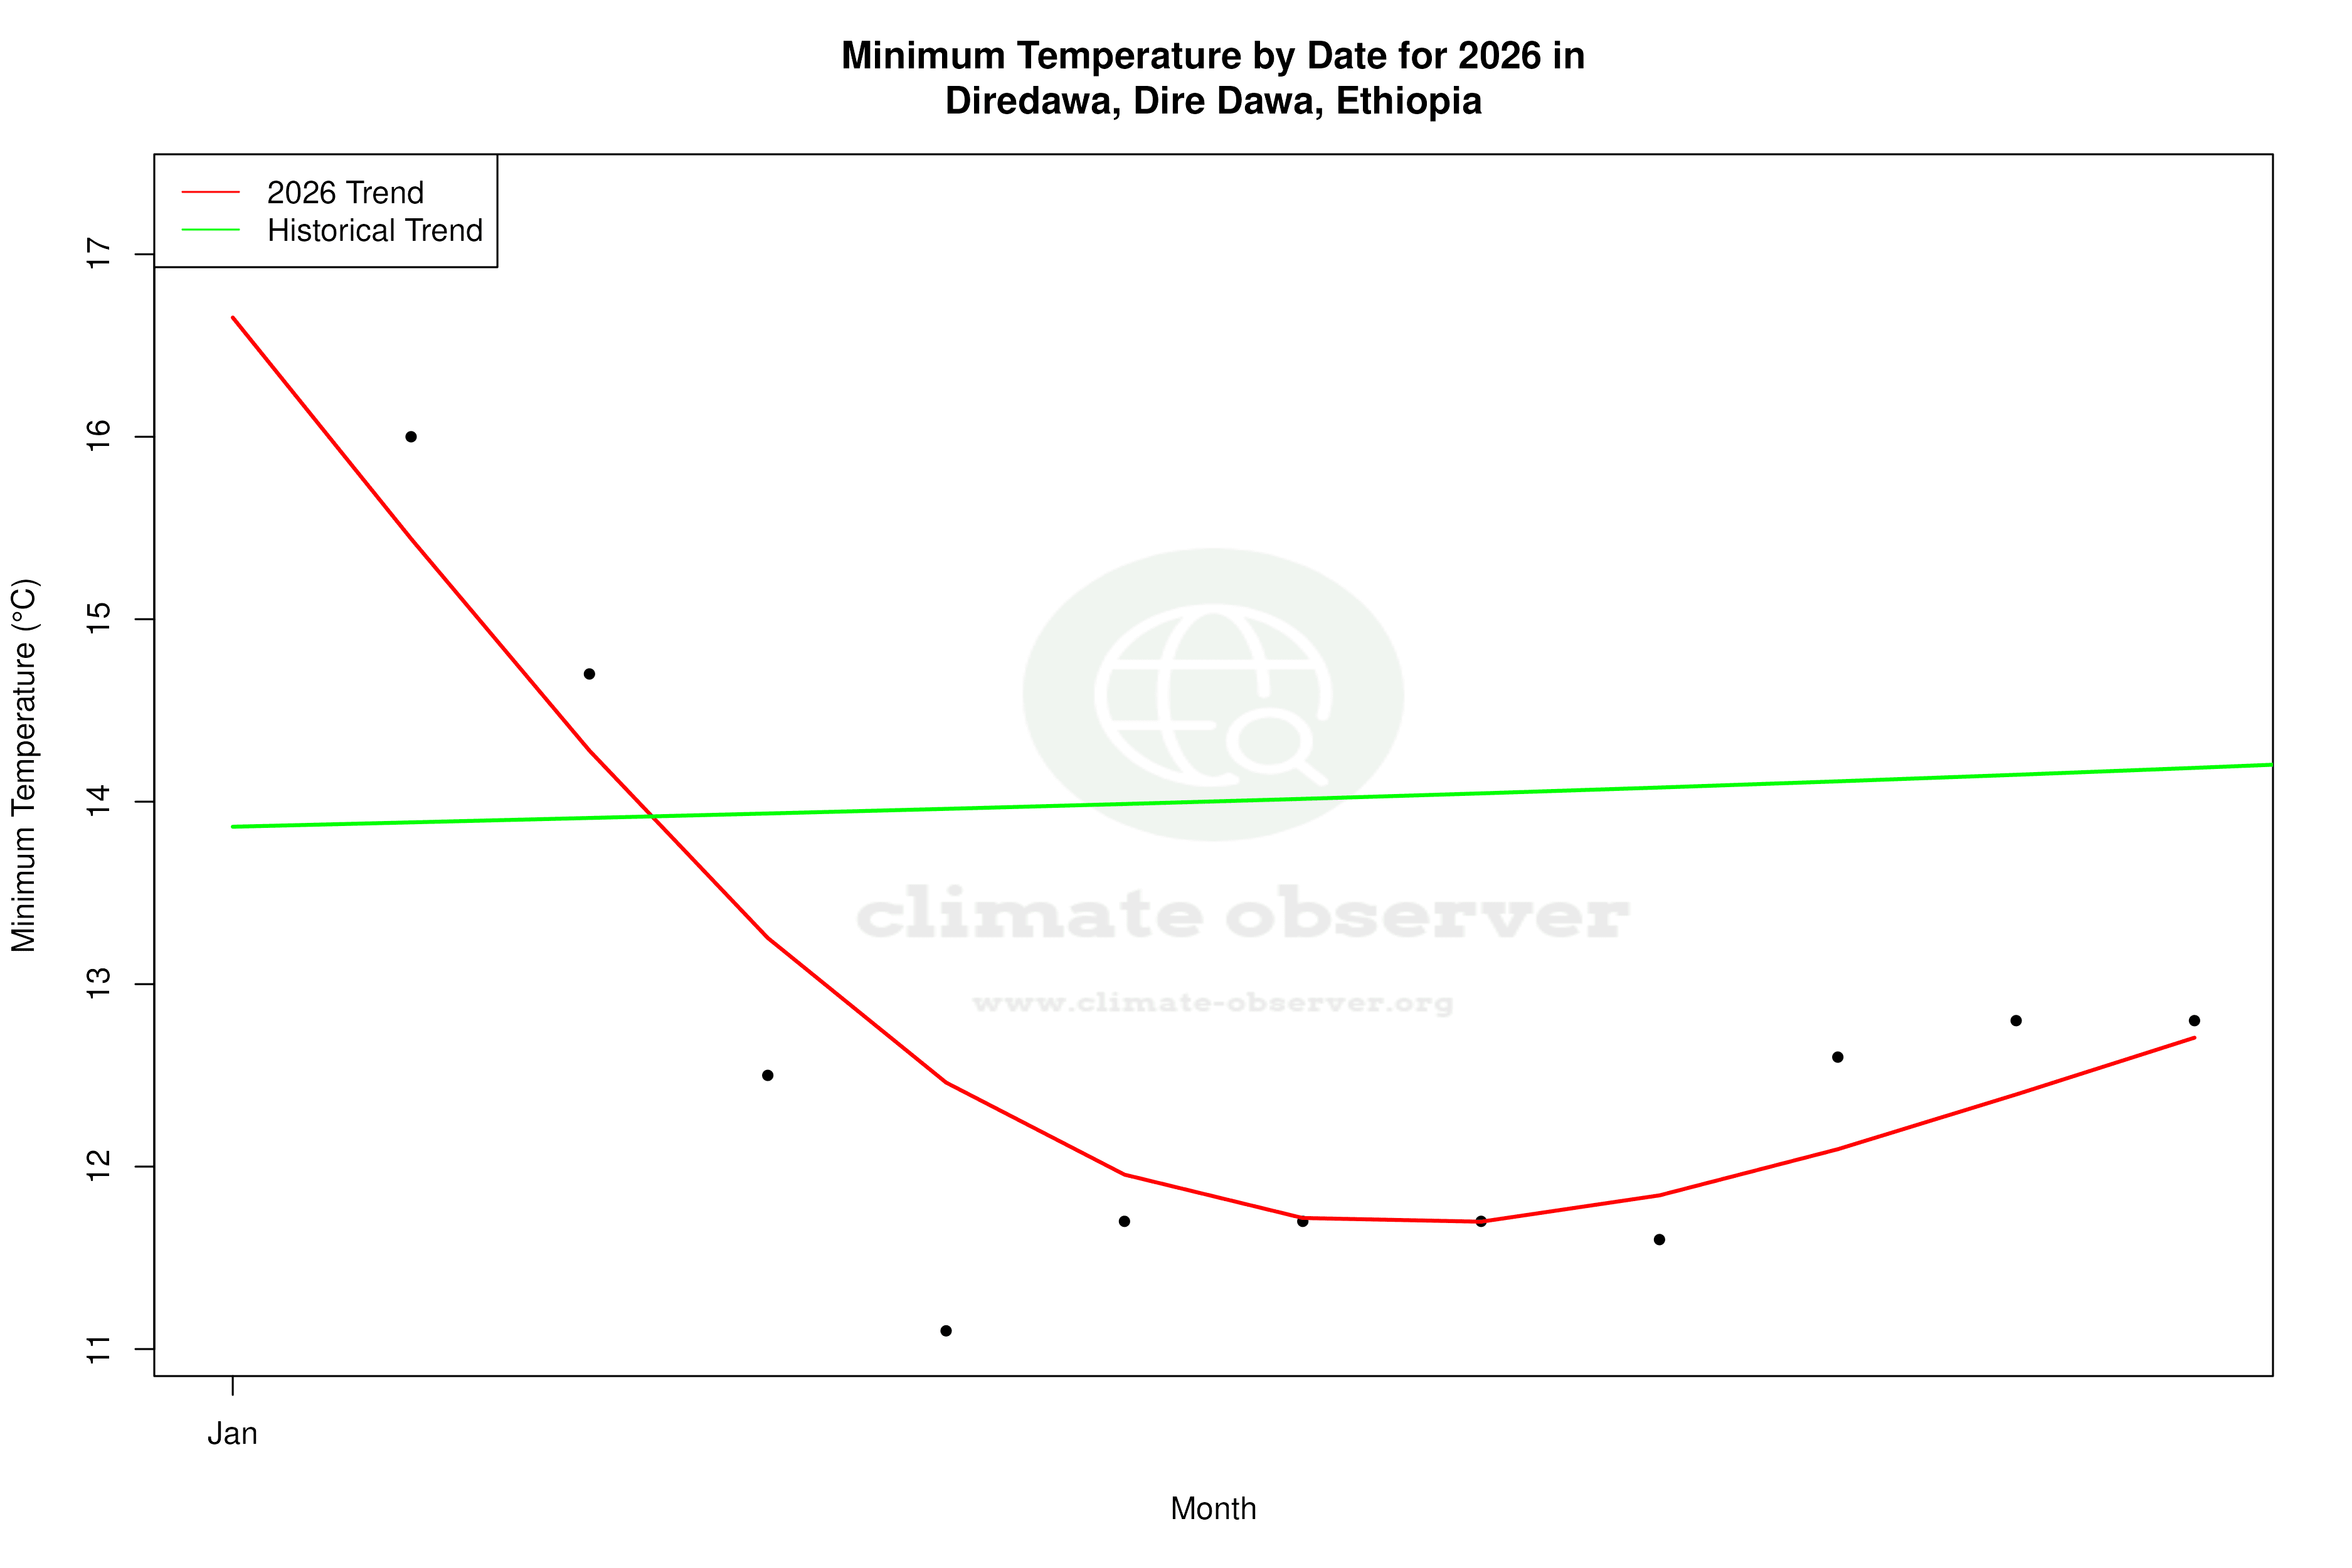
The temperature trends in Diredawa present a dichotomy. Over the past decade, the city has experienced a warming trend, with average high temperatures increasing by 2.67°C (4.81°F) and lows by 2.13°C (3.83°F). However, when examining the all-time temperature trends, a cooling pattern emerges, with a fall in average highs by 0.16°C (0.29°F) and lows by 0.08°C (0.14°F). This juxtaposition suggests that while recent years have seen a rise in temperatures, the longer historical context indicates a cooling trend, possibly influenced by broader climatic cycles or local environmental changes.
Precipitation Patterns: Increasing Concentration
The Precipitation Concentration Index (PCI) in Diredawa has shown a significant increase from a baseline of 16.5 to a current value of 25.0. This indicates that rainfall events have become more concentrated, with precipitation occurring in fewer, more intense events. Such a shift can lead to challenges in water management, as the region may experience periods of drought interspersed with heavy rainfall, impacting agricultural productivity and water resource planning.
Temperature Extremes: Record Highs and Lows
Diredawa's climate extremes are marked by a record high temperature of 42.0°C (107.6°F) and a record low of 5.1°C (41.2°F). These extremes highlight the variability inherent in the region's climate, which can pose challenges for both human and ecological systems. Such temperature fluctuations are critical for understanding the potential impacts of climate change on local biodiversity and human health.
Regional Climate Goals and Implications
Ethiopia has set ambitious regional climate goals, focusing on sustainable development and resilience building. The trends observed in Diredawa, particularly the recent warming and increased precipitation concentration, underscore the importance of these goals. Addressing the challenges posed by these climatic changes will require integrated approaches that consider both mitigation and adaptation strategies, aligning with Ethiopia's broader environmental objectives.
Station Statistics
10-Year Trend
High: +2.53 °C/decade
Low: +1.87 °C/decade
Rain: -0.96 mm/decade
25-Year Trend
High: +1.68 °C/decade
Low: +1.83 °C/decade
Rain: +0.25 mm/decade
50-Year Trend
High: +0.18 °C/decade
Low: -0.02 °C/decade
Rain: +0.08 mm/decade
All-Time Trend
High: -0.15 °C/decade
Low: -0.08 °C/decade
Rain: +0.04 mm/decade
Percentage Above-Average Days
Last 12 Months: 58.4%
This Year: 46.5%
Precipitation Concentration Index (PCI) ℹ️
Last 12 Months: 17.0
Historical Average: 16.8
Percentile Rank of Last 12 Months ℹ️
High: 95th percentile
Low: 90th percentile
Rain: 27th percentile
Change in Variance ℹ️
High: -7.2%
Low: -0.1%
Intraday: -11.7%
Data Coverage
90.1%
First Year of Data
1952
Station Location
Historical Weather Records
| Max High | Avg High | Min High | Max Avg | Avg Avg | Min Avg | Max Low | Avg Low | Min Low | Max Precipitation | Avg Precipitation | Max Snow | Avg Snow | |
|---|---|---|---|---|---|---|---|---|---|---|---|---|---|
| Record | 42.0 °C | — | 19.1 °C | 35.1 °C | — | 13.8 °C | 29.2 °C | — | 5.1 °C | 115.0 mm | — | — | — |
| January | 37.5 °C | 28.2 °C | 20.5 °C | 28.8 °C | 21.2 °C | 13.8 °C | 22.4 °C | 14.4 °C | 5.1 °C | 79.2 mm | 0.4 mm | — | — |
| February | 42.0 °C | 29.8 °C | 19.6 °C | 30.4 °C | 23.0 °C | 14.9 °C | 23.9 °C | 15.7 °C | 6.0 °C | 76.5 mm | 0.9 mm | — | — |
| March | 42.0 °C | 31.2 °C | 19.7 °C | 33.6 °C | 24.6 °C | 17.9 °C | 27.0 °C | 17.9 °C | 7.2 °C | 115.0 mm | 2.1 mm | — | — |
| April | 39.2 °C | 31.2 °C | 19.9 °C | 34.3 °C | 24.9 °C | 17.7 °C | 29.0 °C | 19.1 °C | 7.9 °C | 86.4 mm | 3.7 mm | — | — |
| May | 39.9 °C | 32.4 °C | 22.3 °C | 34.3 °C | 26.0 °C | 18.4 °C | 26.5 °C | 20.1 °C | 10.3 °C | 50.8 mm | 2.0 mm | — | — |
| June | 40.2 °C | 33.2 °C | 22.3 °C | 33.9 °C | 26.2 °C | 18.5 °C | 29.2 °C | 20.7 °C | 13.8 °C | 64.8 mm | 1.1 mm | — | — |
| July | 38.8 °C | 31.5 °C | 20.1 °C | 35.1 °C | 25.2 °C | 17.1 °C | 25.2 °C | 19.3 °C | 6.0 °C | 85.0 mm | 3.4 mm | — | — |
| August | 38.0 °C | 30.5 °C | 20.6 °C | 32.5 °C | 24.5 °C | 17.4 °C | 27.0 °C | 18.9 °C | 6.8 °C | 80.9 mm | 4.4 mm | — | — |
| September | 37.4 °C | 31.0 °C | 21.0 °C | 32.3 °C | 25.0 °C | 17.8 °C | 25.0 °C | 19.2 °C | 8.5 °C | 90.0 mm | 2.7 mm | — | — |
| October | 38.4 °C | 31.0 °C | 21.1 °C | 32.4 °C | 24.5 °C | 15.6 °C | 25.0 °C | 17.7 °C | 6.0 °C | 97.0 mm | 1.0 mm | — | — |
| November | 37.7 °C | 29.3 °C | 19.1 °C | 32.2 °C | 22.6 °C | 14.6 °C | 22.6 °C | 15.3 °C | 7.6 °C | 47.6 mm | 0.6 mm | — | — |
| December | 36.0 °C | 28.0 °C | 20.4 °C | 28.8 °C | 21.1 °C | 14.0 °C | 20.6 °C | 14.0 °C | 5.5 °C | 87.0 mm | 0.3 mm | — | — |
Data Visualisations
Remove WatermarksCurrent Year Climate Trends vs Historical


Max Temperature this Year | 1 of 6
Climate 12-Month Moving Averages


Max Temperature 12-Month MA | 1 of 6
Daily Data Points and Averages Throughout the Year


Average Max Temperature Throughout Year | 1 of 5
