Climate for Station: Liberec, Northeast, Czech Republic
Loading live weather...
Climate Analysis & Overview
Liberec's climate profile reveals a complex interplay of warming and cooling trends, with a notable rise in low temperatures over the past decade. The region's precipitation pattern is becoming more evenly distributed, offering a nuanced view of its evolving climate dynamics.
Climate Classification and Geographic Influence
Liberec, located at 50.767°N, 15.017°E, is classified under the Köppen climate classification as Dfb, indicating a humid continental climate with warm summers and no dry season. Nestled in the northern part of the Czech Republic, the city's climate is heavily influenced by its proximity to the Jizera Mountains. These mountains play a crucial role in moderating temperatures and influencing precipitation patterns, often resulting in cooler summers and snowy winters.
Temperature Trends: A Mixed Bag
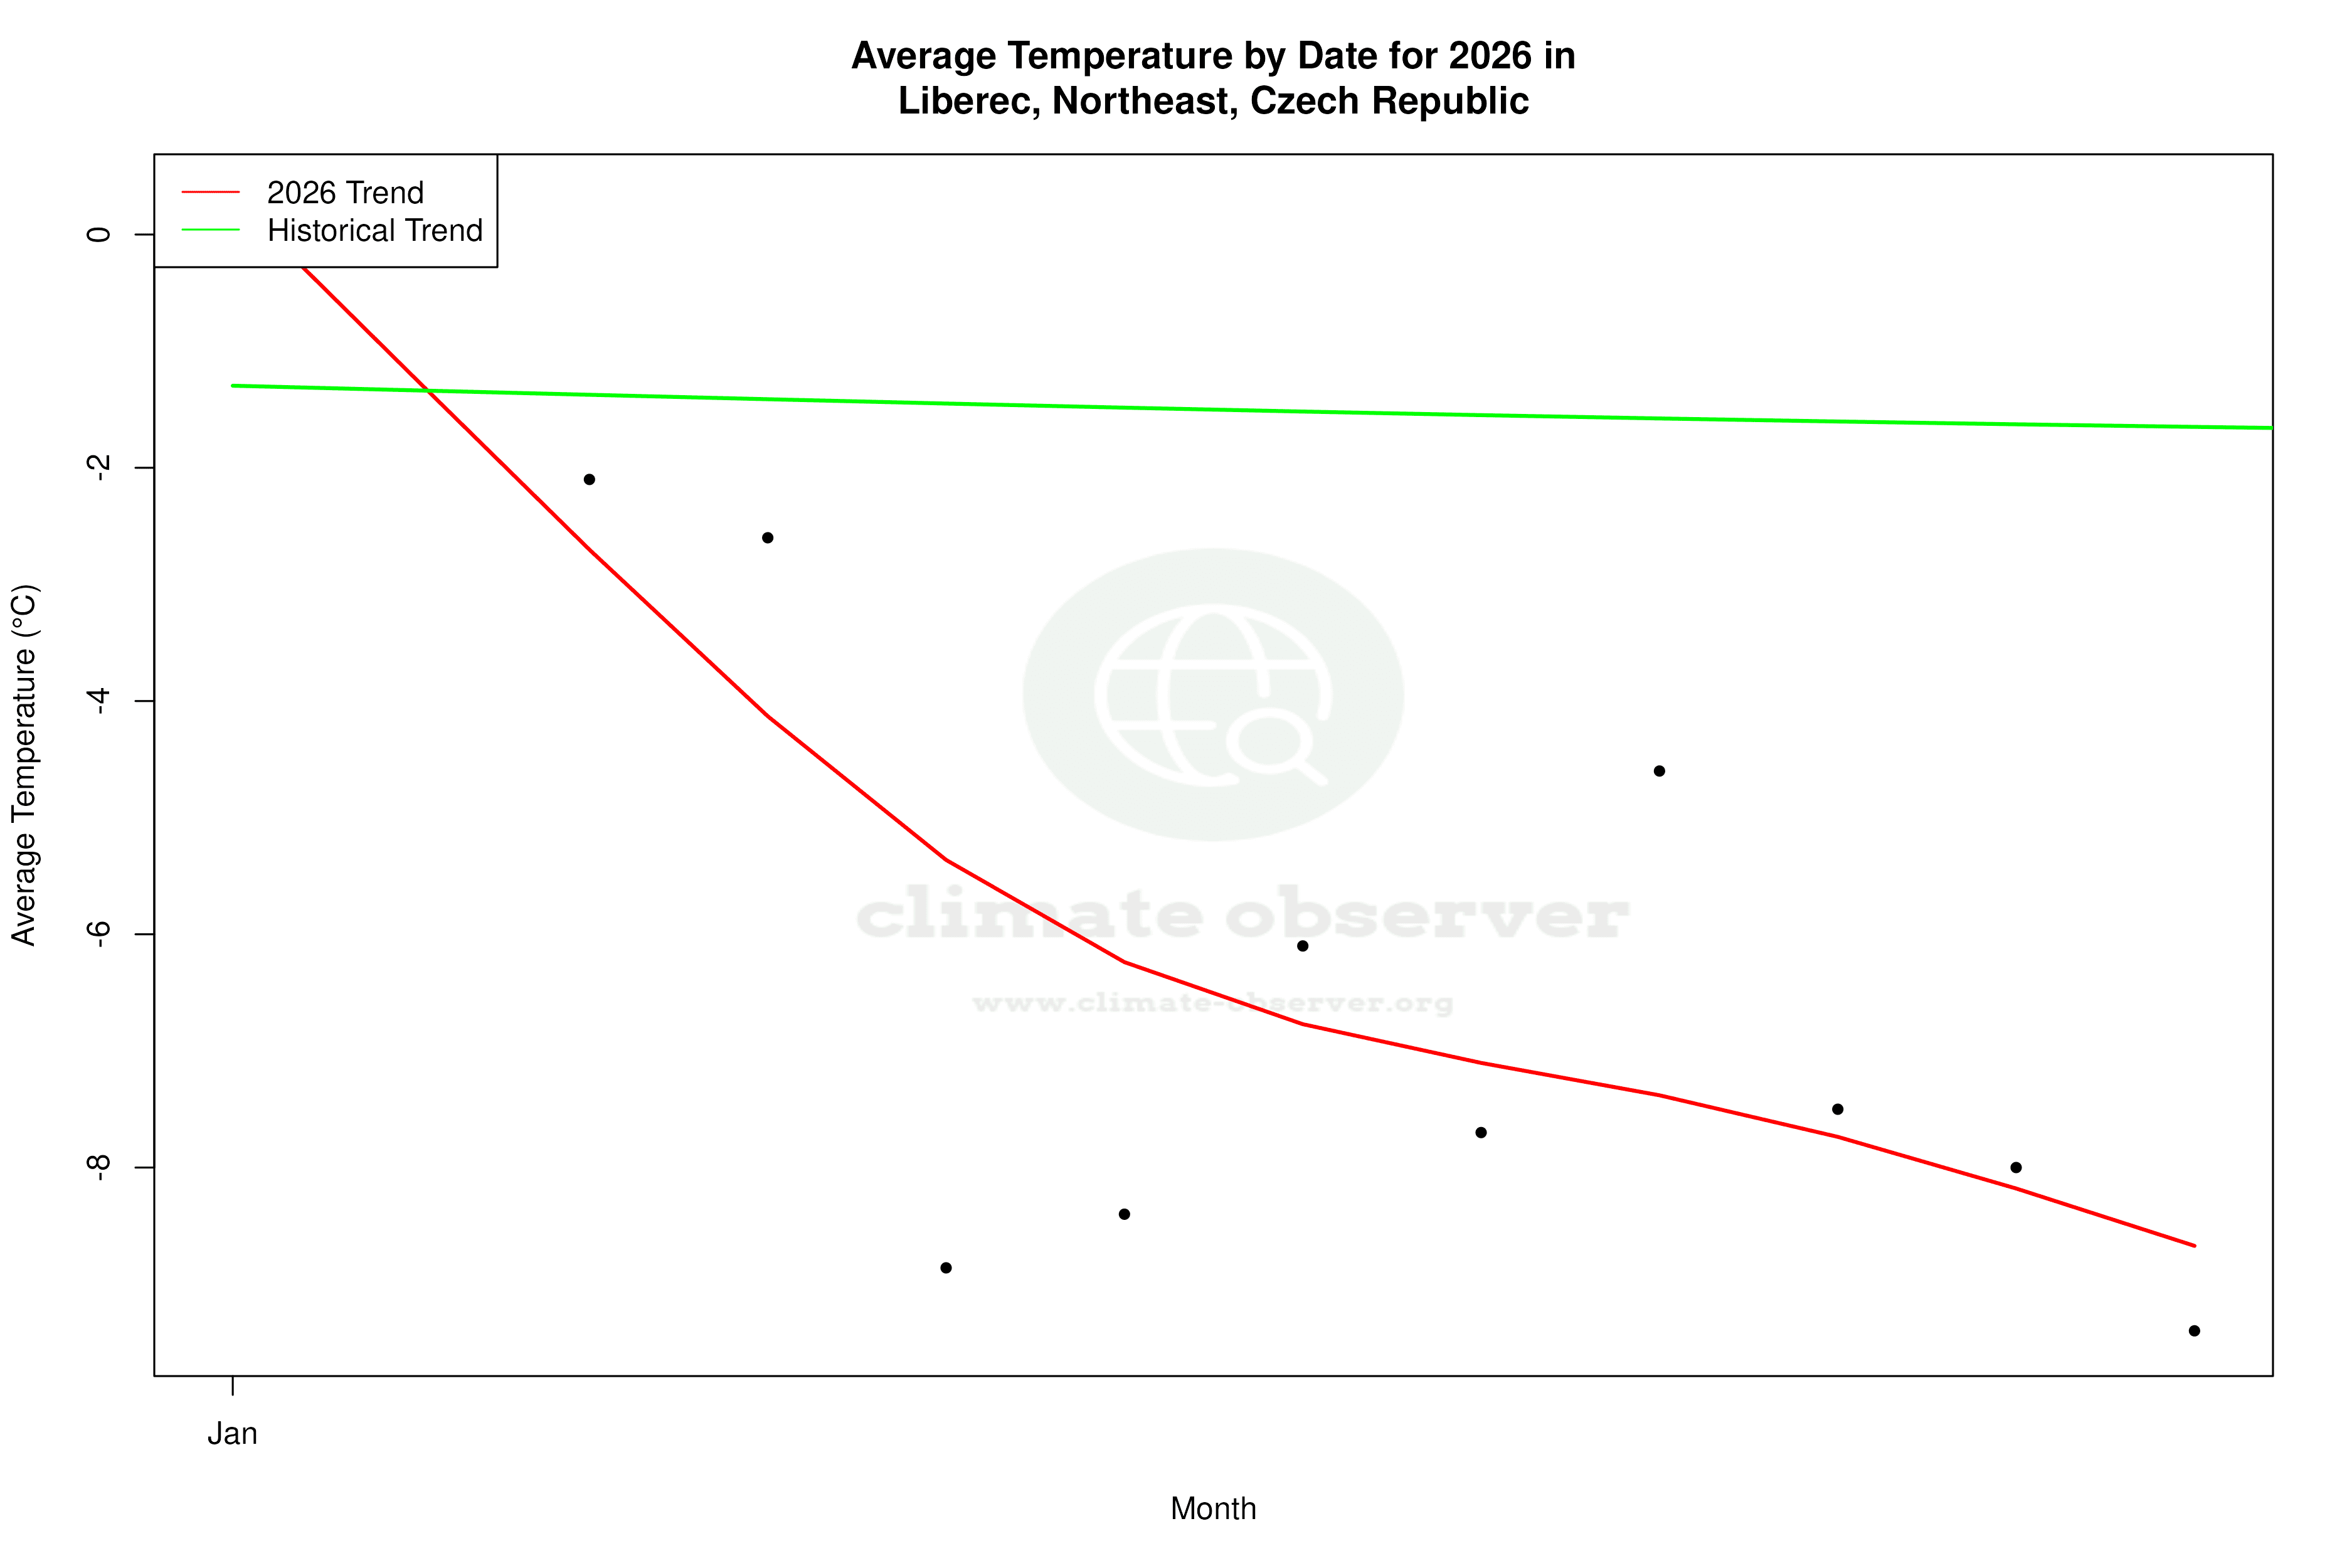
The all-time temperature trends in Liberec present a nuanced picture. High temperatures have experienced a slight warming, with an increase of 0.28°C (0.50°F), while low temperatures have risen by 0.15°C (0.27°F). This warming trend is consistent with broader regional goals in the Czech Republic to mitigate climate change impacts. However, the past decade tells a different story. Highs have decreased by 0.52°C (0.94°F), indicating a cooling trend, while lows have risen by 1.03°C (1.85°F), suggesting a significant warming of the nighttime temperatures. This divergence in trends highlights the complexity of local climate dynamics.
Precipitation Patterns: A Shift Towards Even Distribution
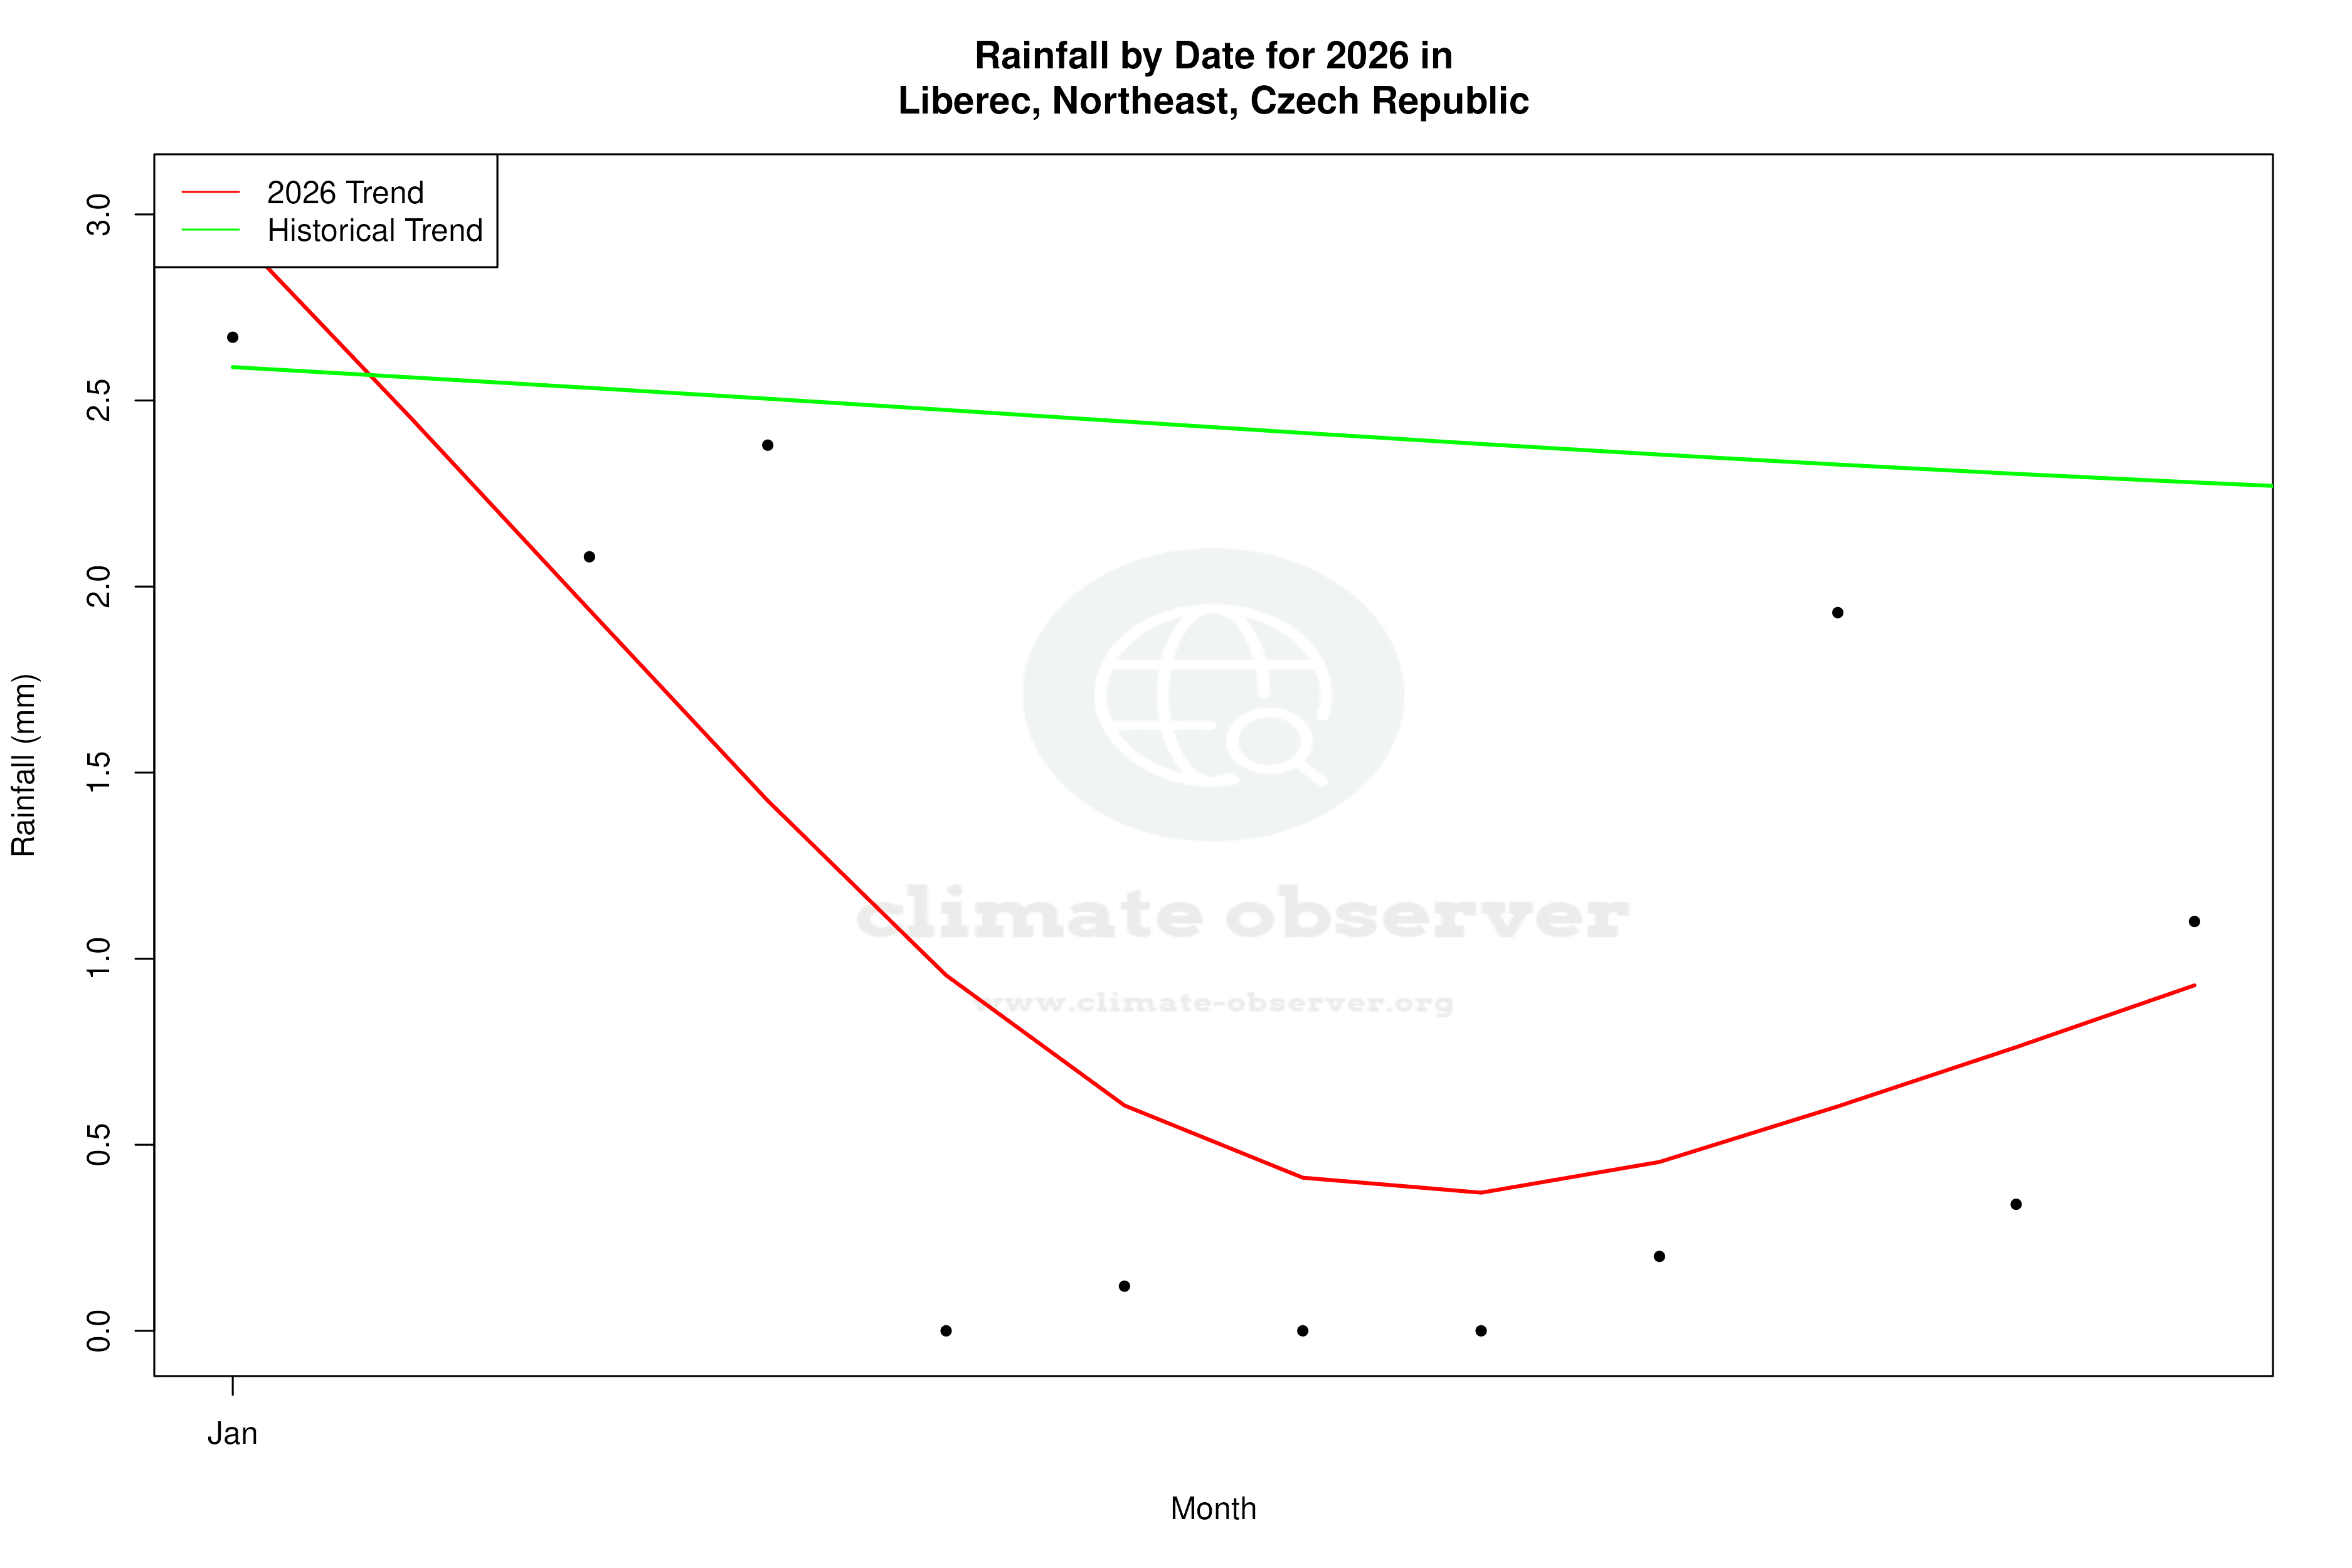
Liberec's Precipitation Concentration Index (PCI) has shown a decrease from a baseline of 11.31 to a current value of 9.94. The PCI measures how precipitation is distributed over time, with lower values indicating more evenly distributed rainfall. This shift suggests that rainfall events in Liberec are becoming more evenly spread throughout the year, reducing the likelihood of extreme precipitation events and potentially benefiting agriculture and water management strategies.
Extreme Temperature Records
Liberec has experienced some extreme temperature events, with a record high of 37.2°C (98.96°F) and a record low of -27.2°C (-17.0°F). These extremes underscore the variability inherent in the region's climate, which can pose challenges for infrastructure and public health.
Regional Climate Context
The Czech Republic has been actively pursuing climate adaptation and mitigation strategies, aligning with broader European Union goals. Recent weather events, such as unseasonal heatwaves and heavy snowfall, have underscored the importance of understanding local climate trends. Liberec's evolving climate profile, marked by both warming and cooling trends and a shift towards more evenly distributed precipitation, provides critical insights for policymakers and researchers alike.
Station Statistics
10-Year Trend
High: -0.63 °C/decade
Low: +0.91 °C/decade
Rain: -0.12 mm/decade
25-Year Trend
High: +0.47 °C/decade
Low: +0.63 °C/decade
Rain: -0.00 mm/decade
50-Year Trend
High: +0.59 °C/decade
Low: +0.31 °C/decade
Rain: +0.05 mm/decade
All-Time Trend
High: +0.28 °C/decade
Low: +0.15 °C/decade
Rain: +0.05 mm/decade
Percentage Above-Average Days
Last 12 Months: 46.6%
This Year: 52.9%
Precipitation Concentration Index (PCI) ℹ️
Last 12 Months: 10.3
Historical Average: 11.0
Percentile Rank of Last 12 Months ℹ️
High: 52nd percentile
Low: 66th percentile
Rain: 31st percentile
Change in Variance ℹ️
High: -6.0%
Low: -11.7%
Intraday: +2.6%
Data Coverage
68.0%
First Year of Data
1938
Station Location
Historical Weather Records
| Max High | Avg High | Min High | Max Avg | Avg Avg | Min Avg | Max Low | Avg Low | Min Low | Max Precipitation | Avg Precipitation | Max Snow | Avg Snow | |
|---|---|---|---|---|---|---|---|---|---|---|---|---|---|
| Record | 37.2 °C | — | -20.3 °C | 29.9 °C | — | -23.3 °C | 22.7 °C | — | -27.2 °C | 132.1 mm | — | — | — |
| January | 18.3 °C | 0.8 °C | -20.3 °C | 12.6 °C | -1.7 °C | -23.3 °C | 10.6 °C | -4.3 °C | -27.2 °C | 39.9 mm | 2.3 mm | — | — |
| February | 15.5 °C | 2.6 °C | -13.9 °C | 10.9 °C | -0.6 °C | -19.2 °C | 8.0 °C | -3.8 °C | -26.1 °C | 132.1 mm | 1.9 mm | — | — |
| March | 22.0 °C | 7.4 °C | -7.4 °C | 15.2 °C | 3.1 °C | -11.7 °C | 11.7 °C | -0.9 °C | -20.0 °C | 34.0 mm | 1.9 mm | — | — |
| April | 27.3 °C | 12.9 °C | -2.0 °C | 21.6 °C | 7.6 °C | -3.9 °C | 15.4 °C | 2.4 °C | -11.1 °C | 27.7 mm | 1.7 mm | — | — |
| May | 32.2 °C | 17.9 °C | 0.0 °C | 24.0 °C | 12.4 °C | -1.4 °C | 18.3 °C | 6.6 °C | -5.0 °C | 67.1 mm | 2.6 mm | — | — |
| June | 35.1 °C | 21.1 °C | 7.3 °C | 28.9 °C | 15.7 °C | 6.0 °C | 22.7 °C | 10.0 °C | -2.0 °C | 51.1 mm | 2.8 mm | — | — |
| July | 36.2 °C | 22.9 °C | 11.5 °C | 28.1 °C | 17.3 °C | 8.8 °C | 21.6 °C | 11.7 °C | 2.0 °C | 73.9 mm | 3.5 mm | — | — |
| August | 37.2 °C | 22.9 °C | 8.9 °C | 29.9 °C | 17.1 °C | 7.6 °C | 21.7 °C | 11.5 °C | 1.0 °C | 80.0 mm | 3.0 mm | — | — |
| September | 34.0 °C | 18.4 °C | 6.0 °C | 24.9 °C | 13.2 °C | 4.5 °C | 18.4 °C | 8.5 °C | -2.4 °C | 55.6 mm | 2.4 mm | — | — |
| October | 25.4 °C | 12.6 °C | -1.1 °C | 18.3 °C | 8.5 °C | -3.5 °C | 14.8 °C | 4.8 °C | -8.8 °C | 38.1 mm | 2.0 mm | — | — |
| November | 19.1 °C | 6.0 °C | -7.0 °C | 13.6 °C | 3.5 °C | -10.3 °C | 12.0 °C | 0.8 °C | -17.9 °C | 55.1 mm | 2.2 mm | — | — |
| December | 14.8 °C | 2.2 °C | -15.0 °C | 10.9 °C | -0.1 °C | -19.5 °C | 9.7 °C | -2.6 °C | -23.7 °C | 39.9 mm | 2.4 mm | — | — |
Data Visualisations
Remove WatermarksCurrent Year Climate Trends vs Historical


Max Temperature this Year | 1 of 6
Climate 12-Month Moving Averages
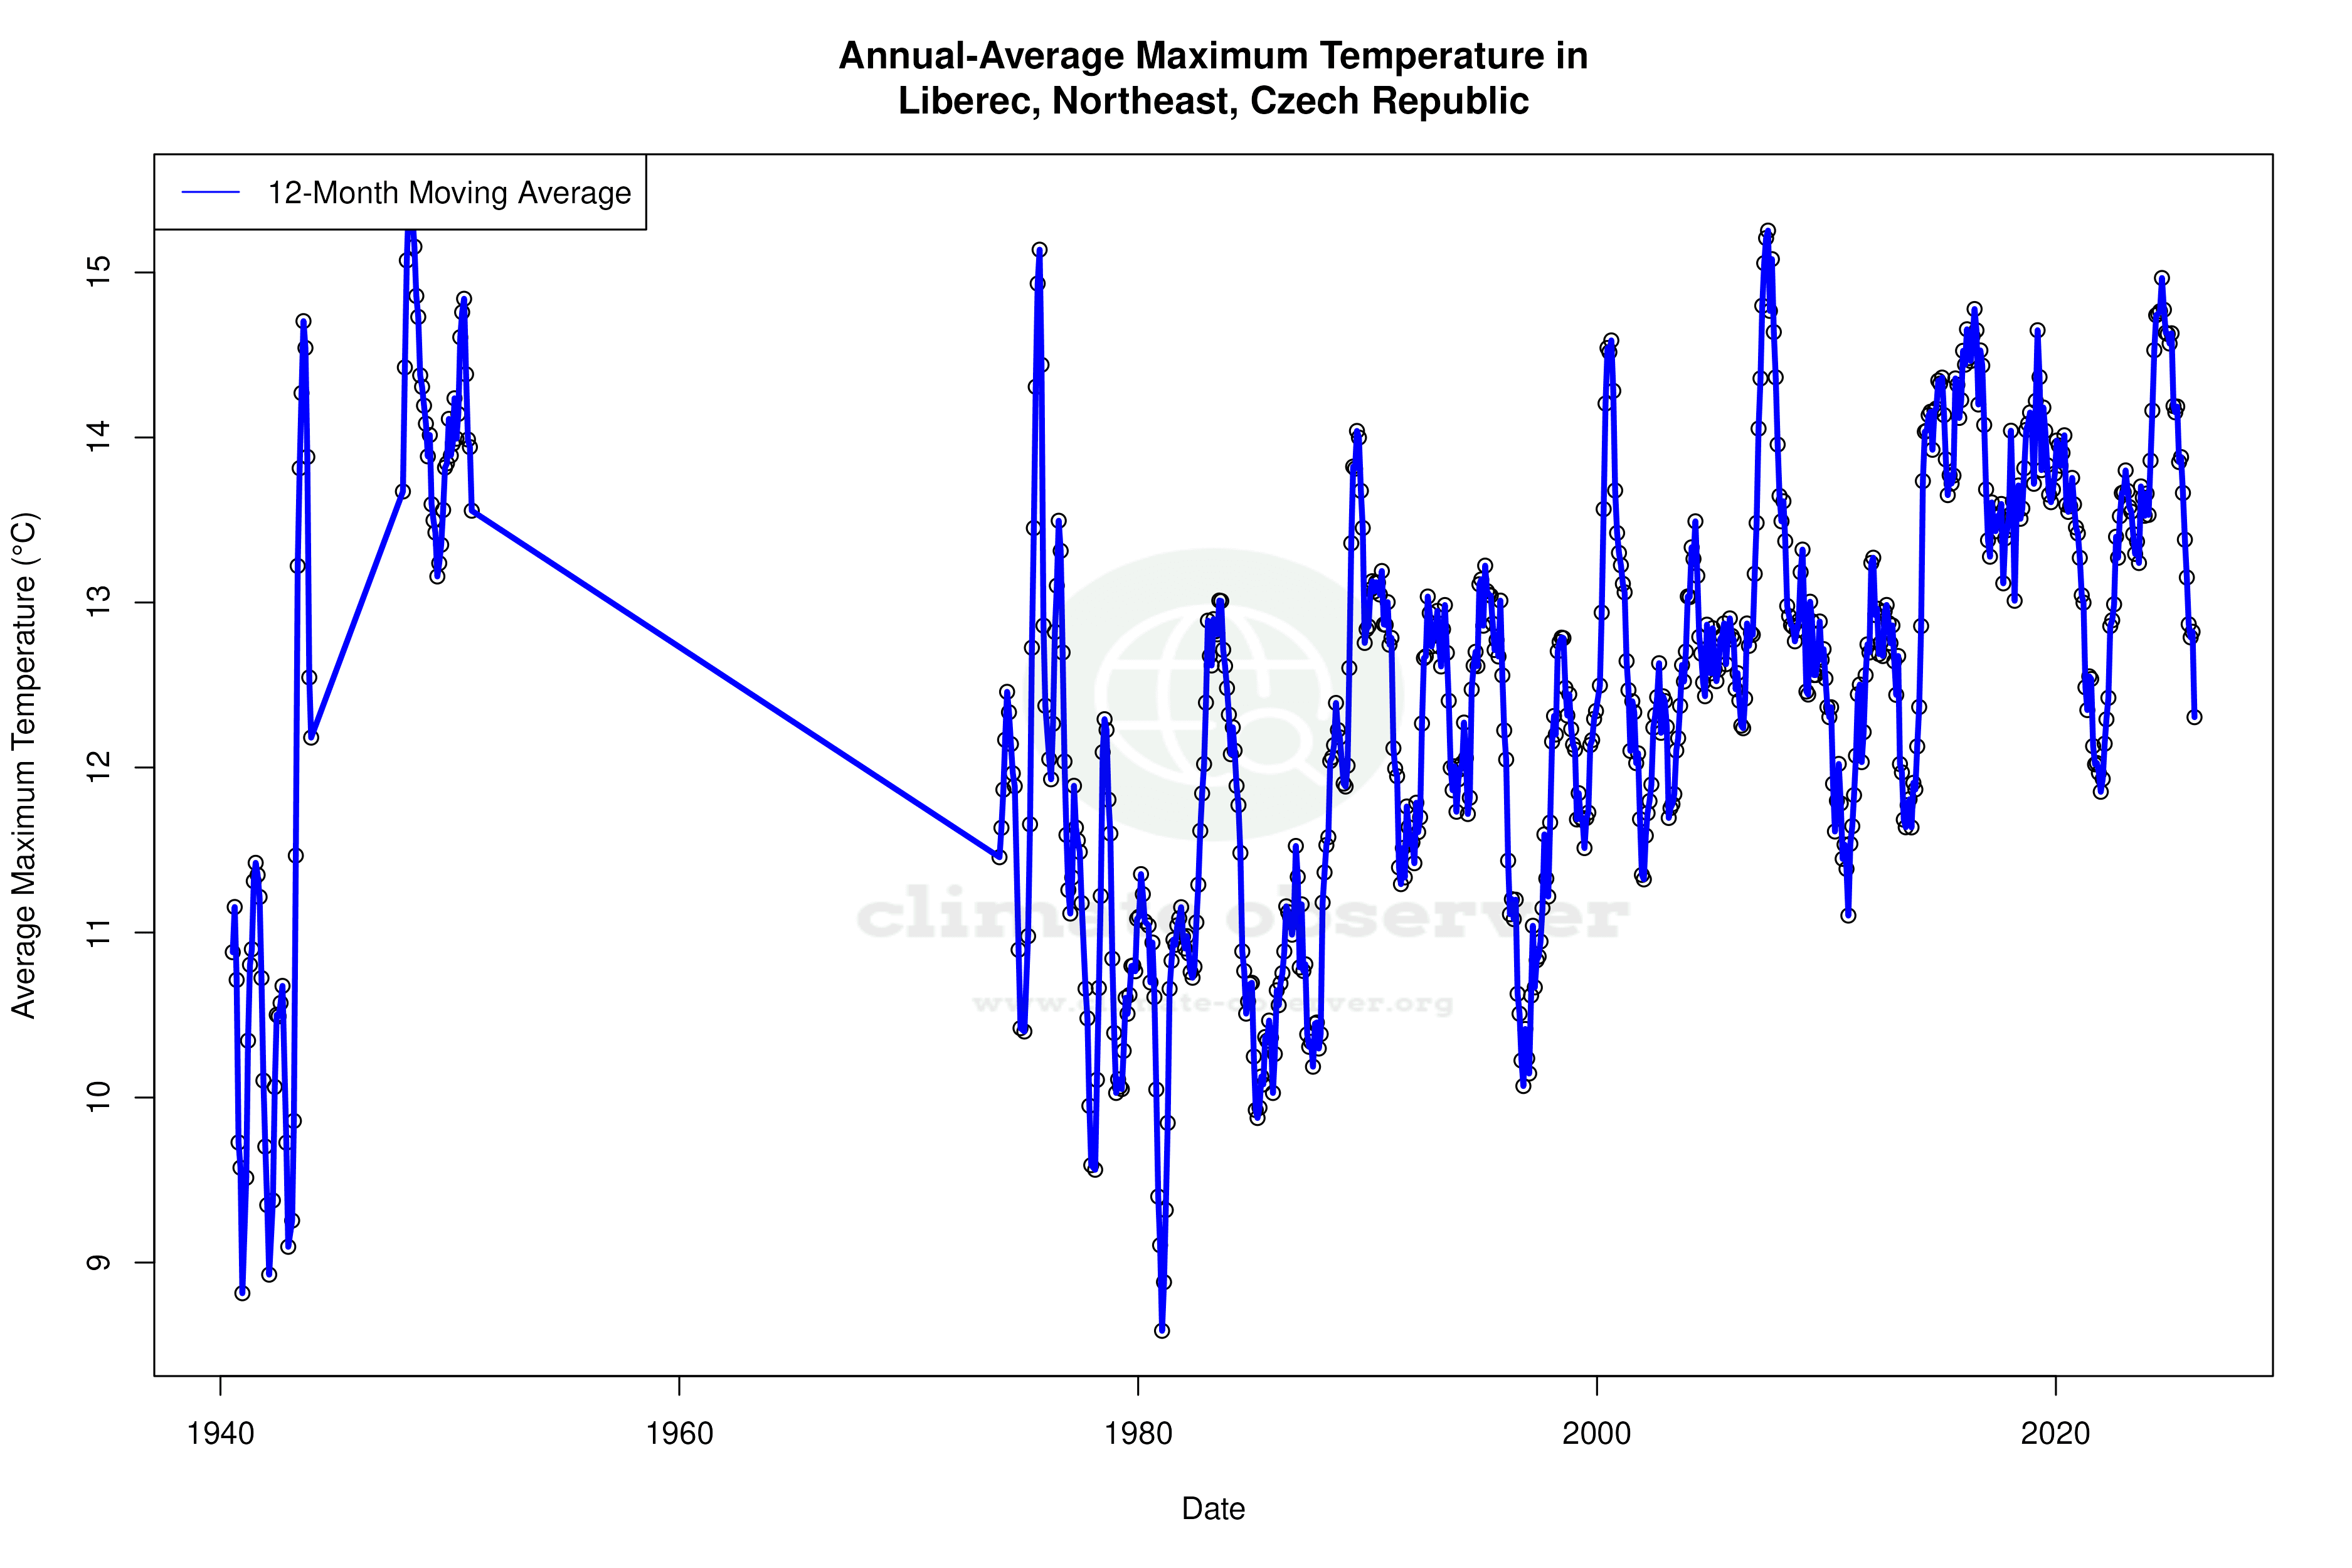
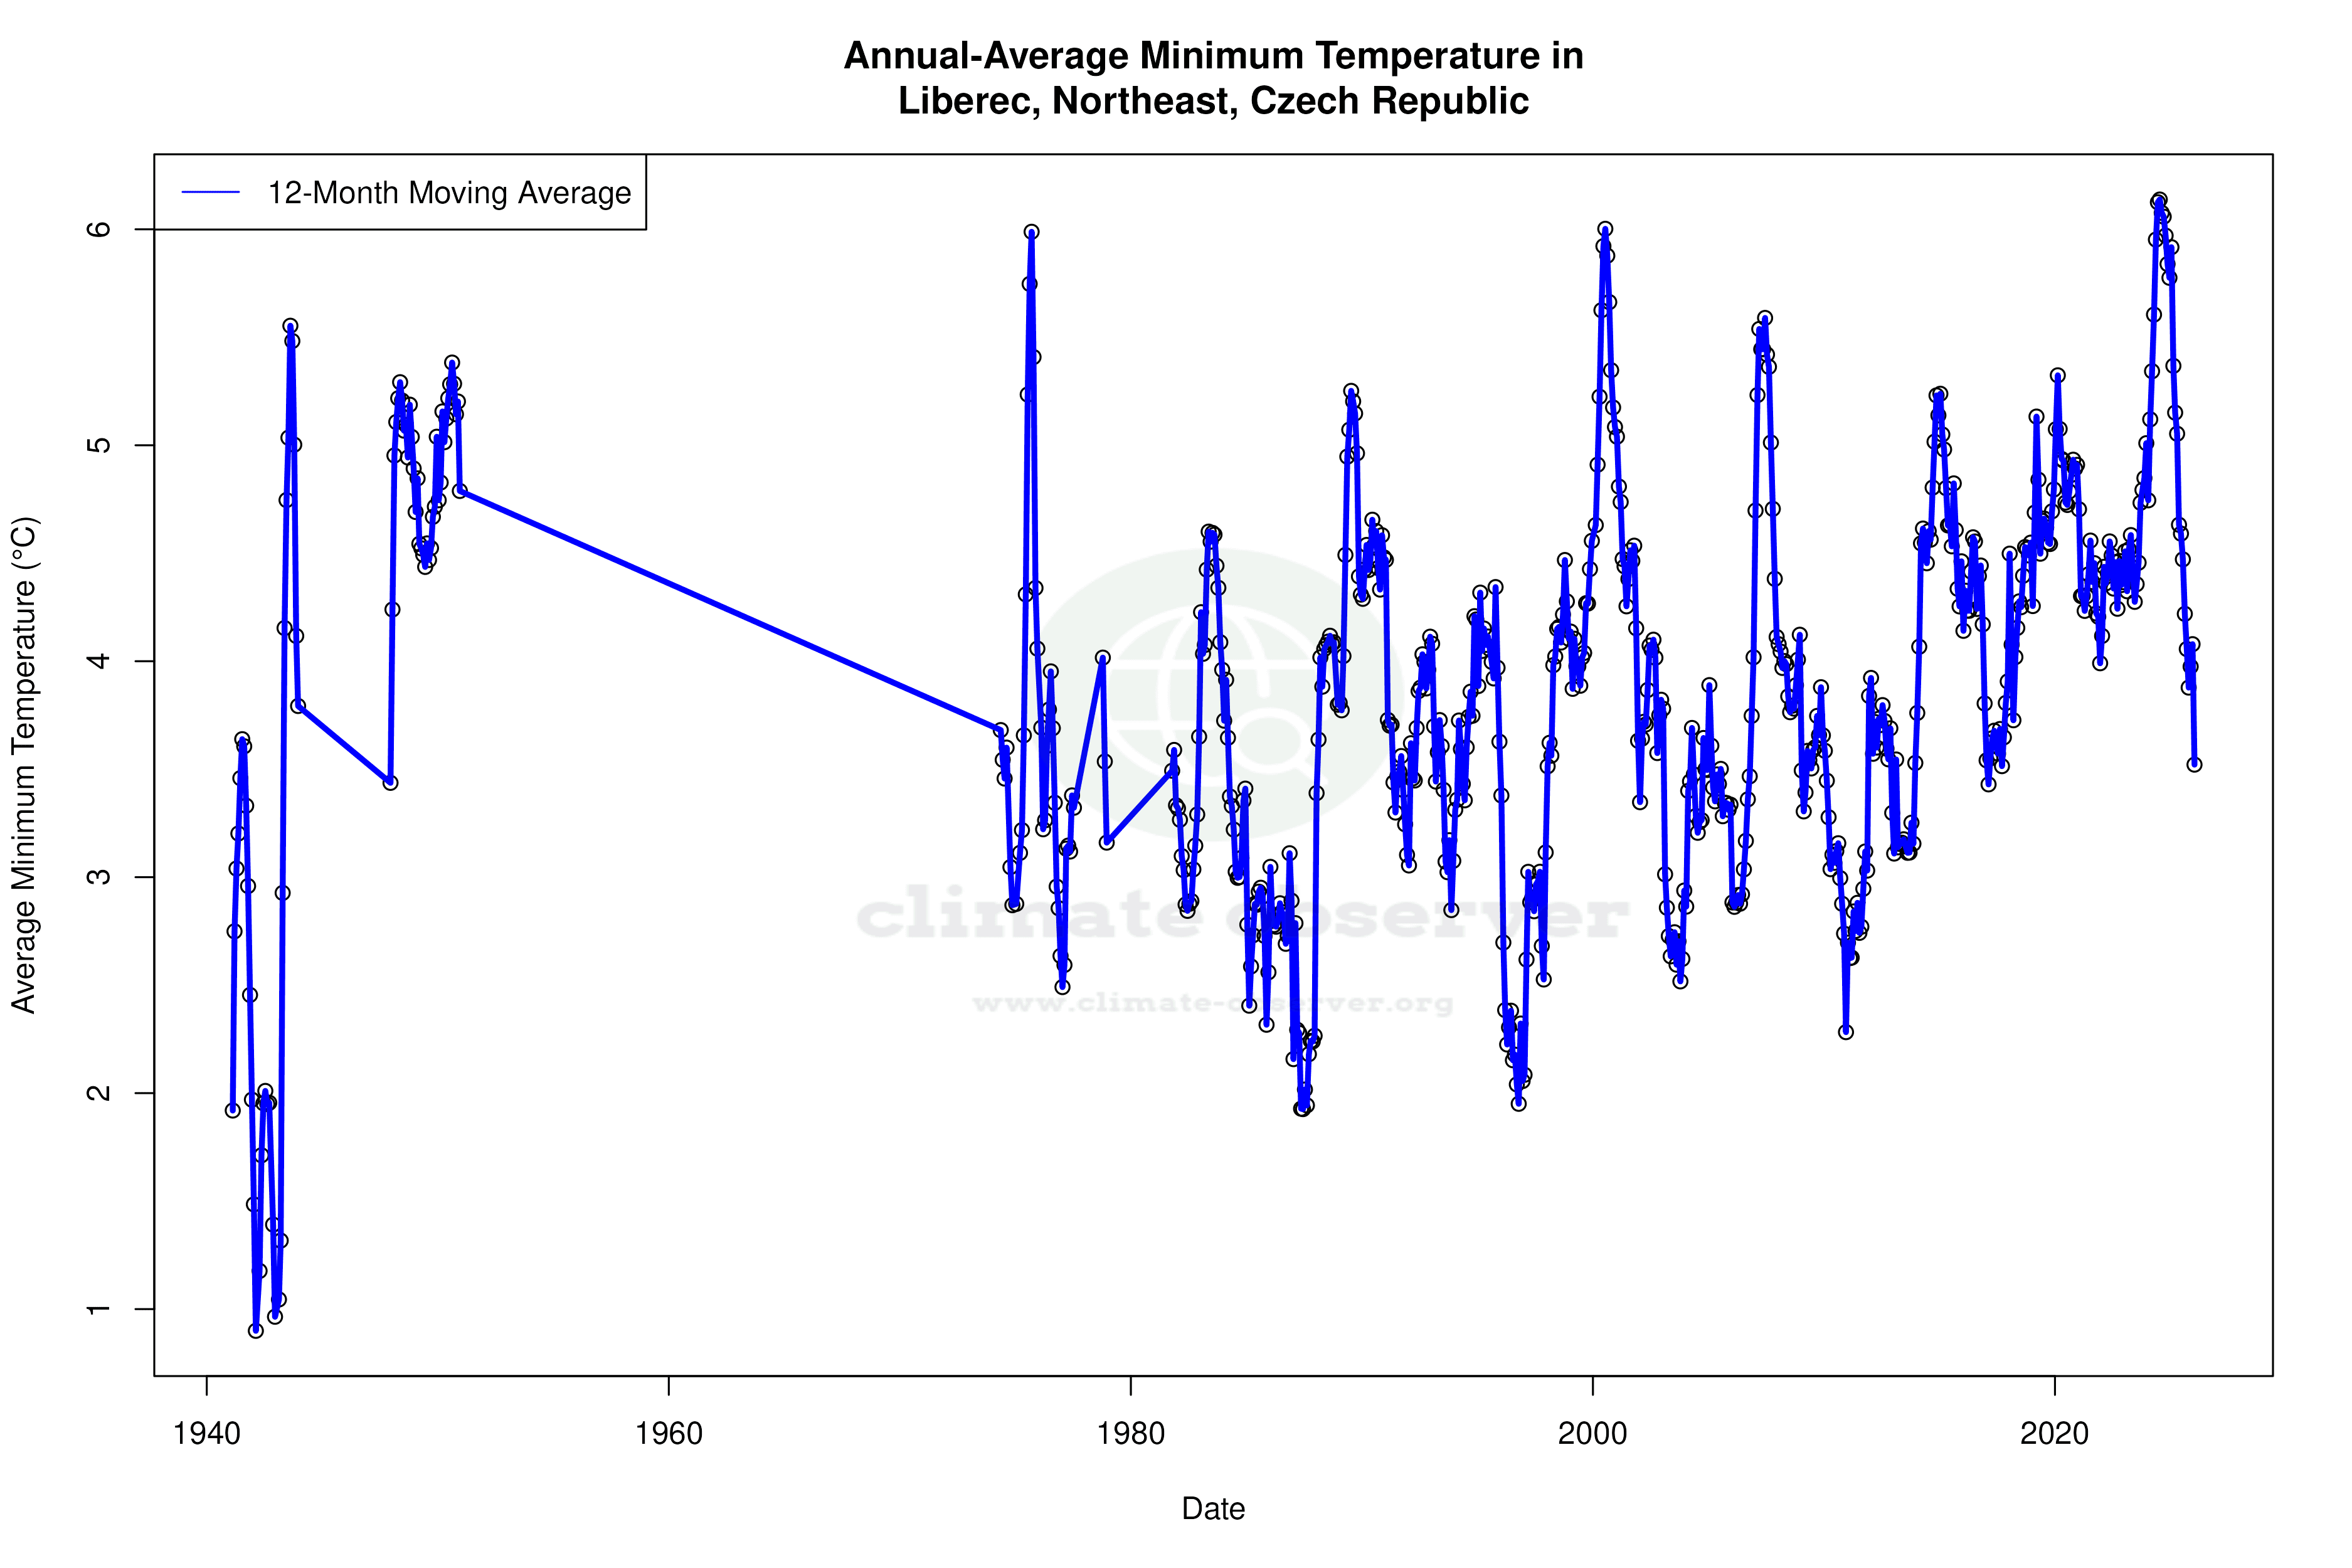
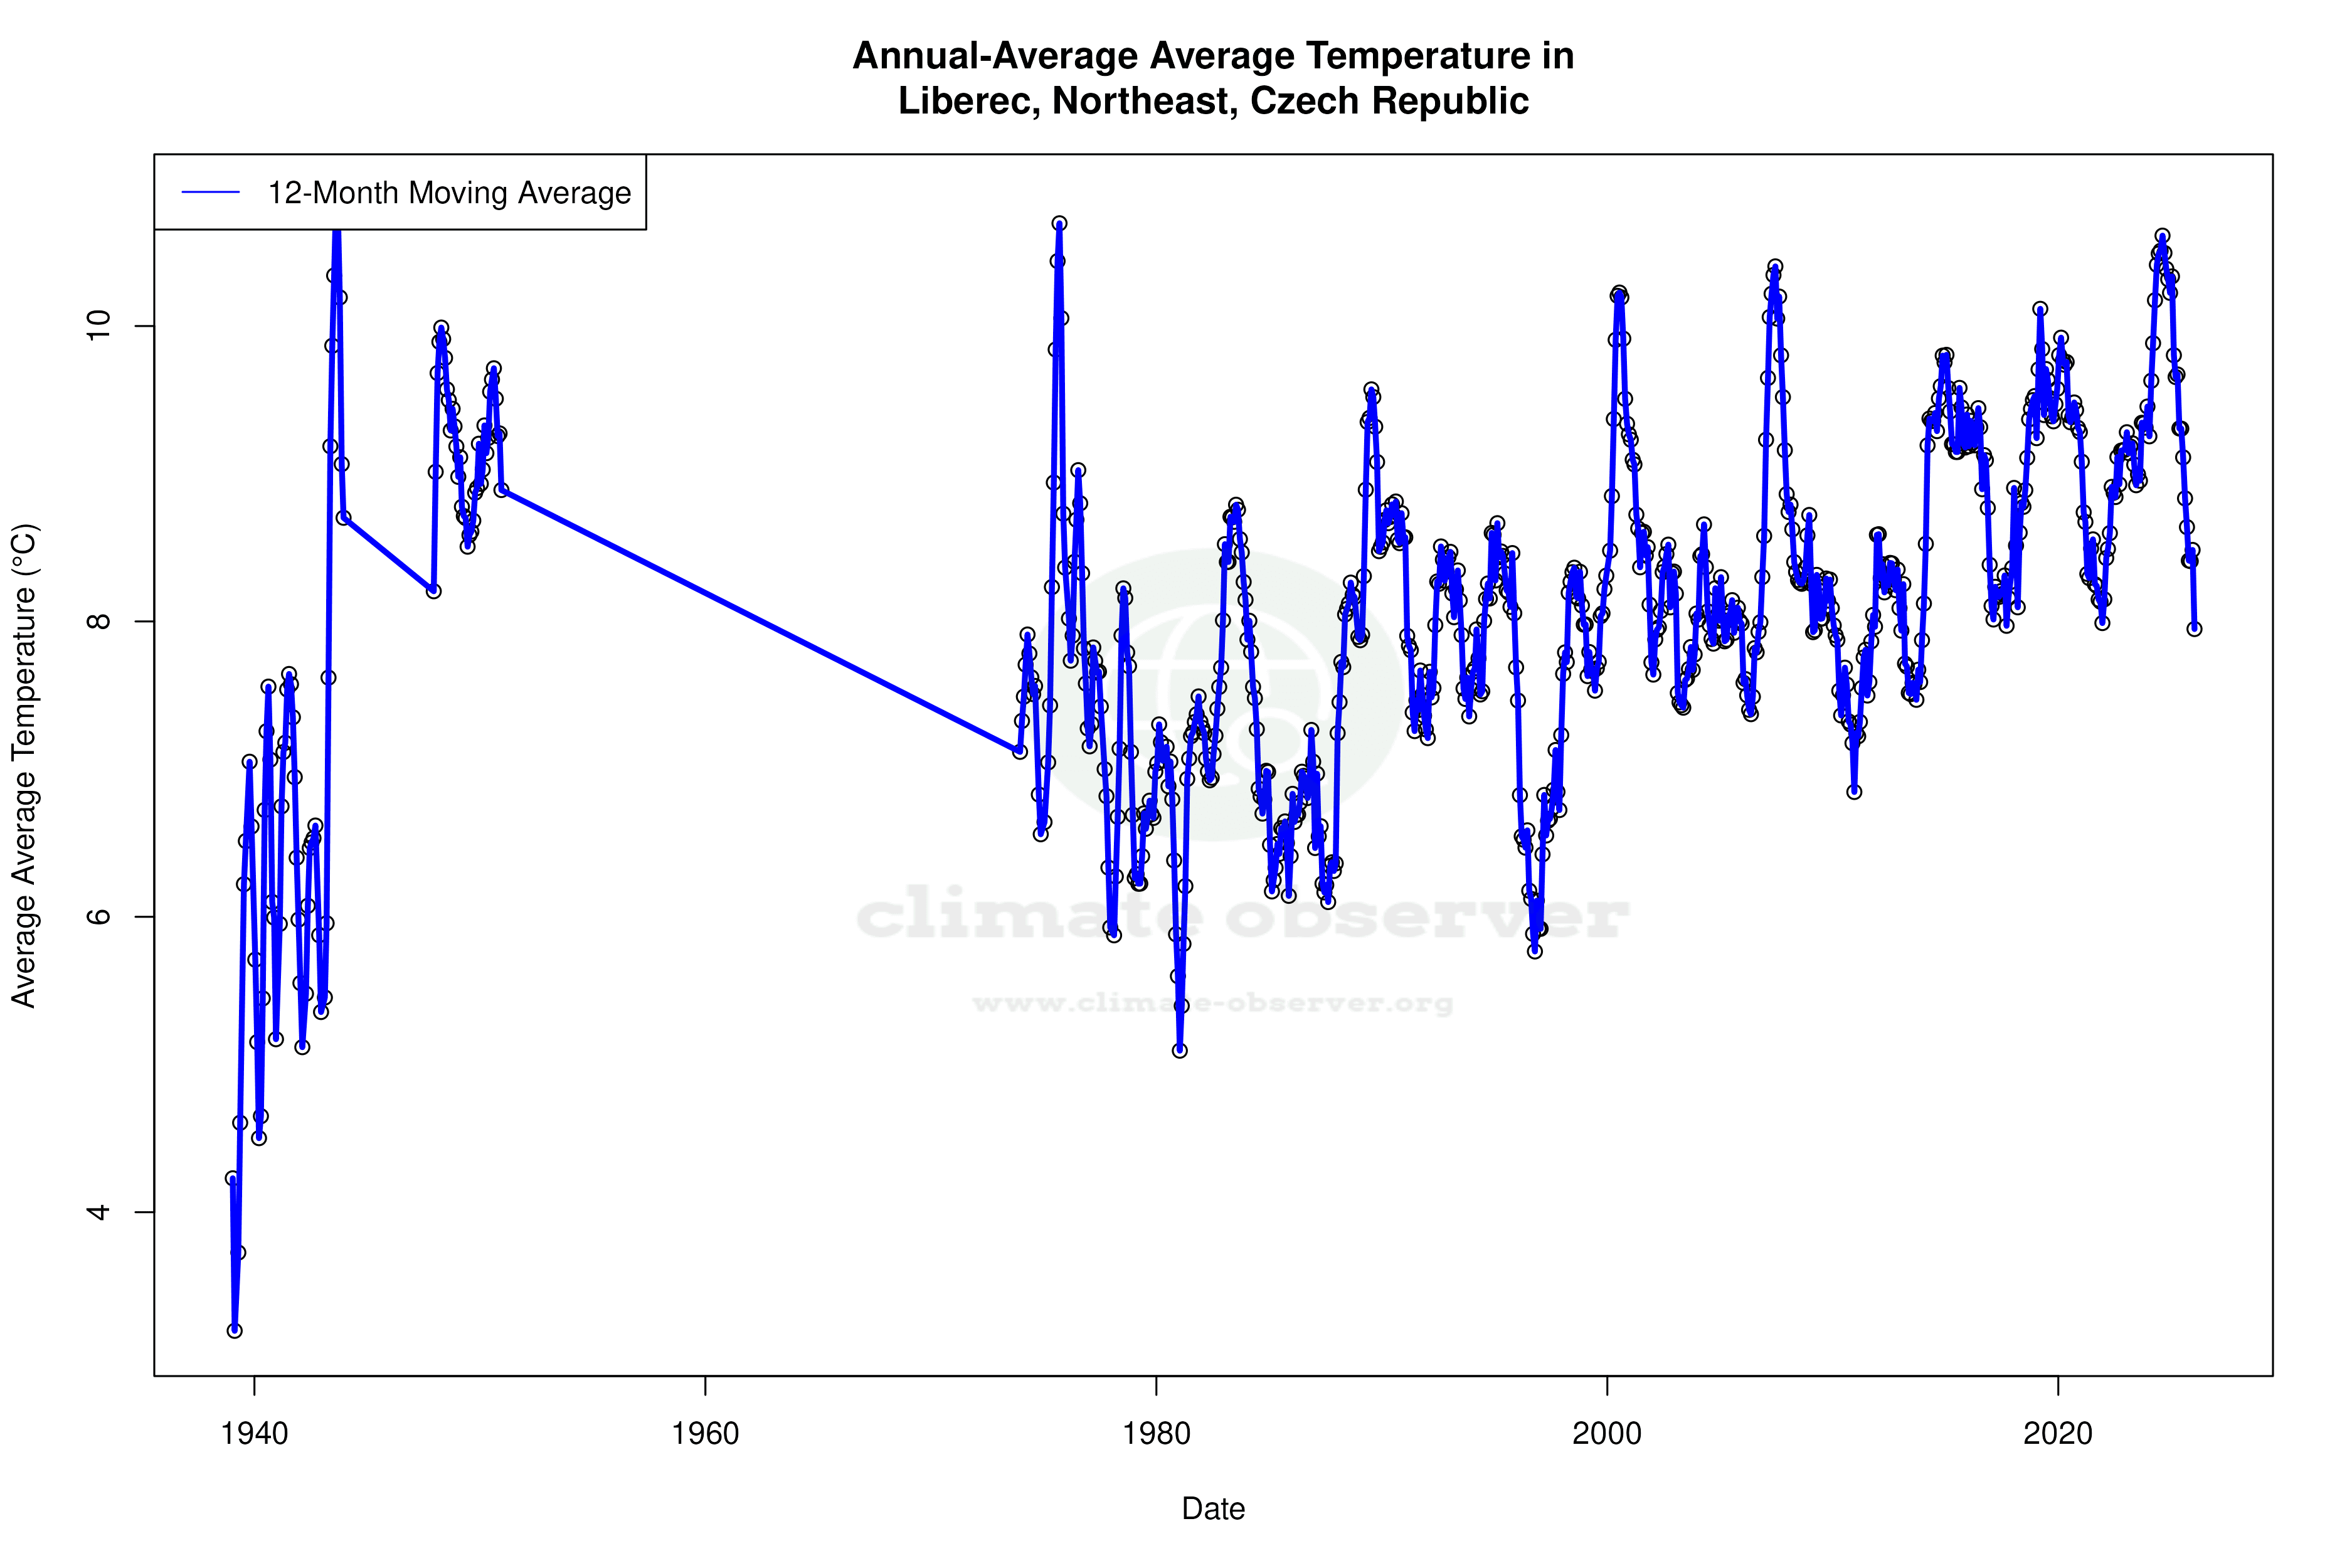


Max Temperature 12-Month MA | 1 of 6
Daily Data Points and Averages Throughout the Year
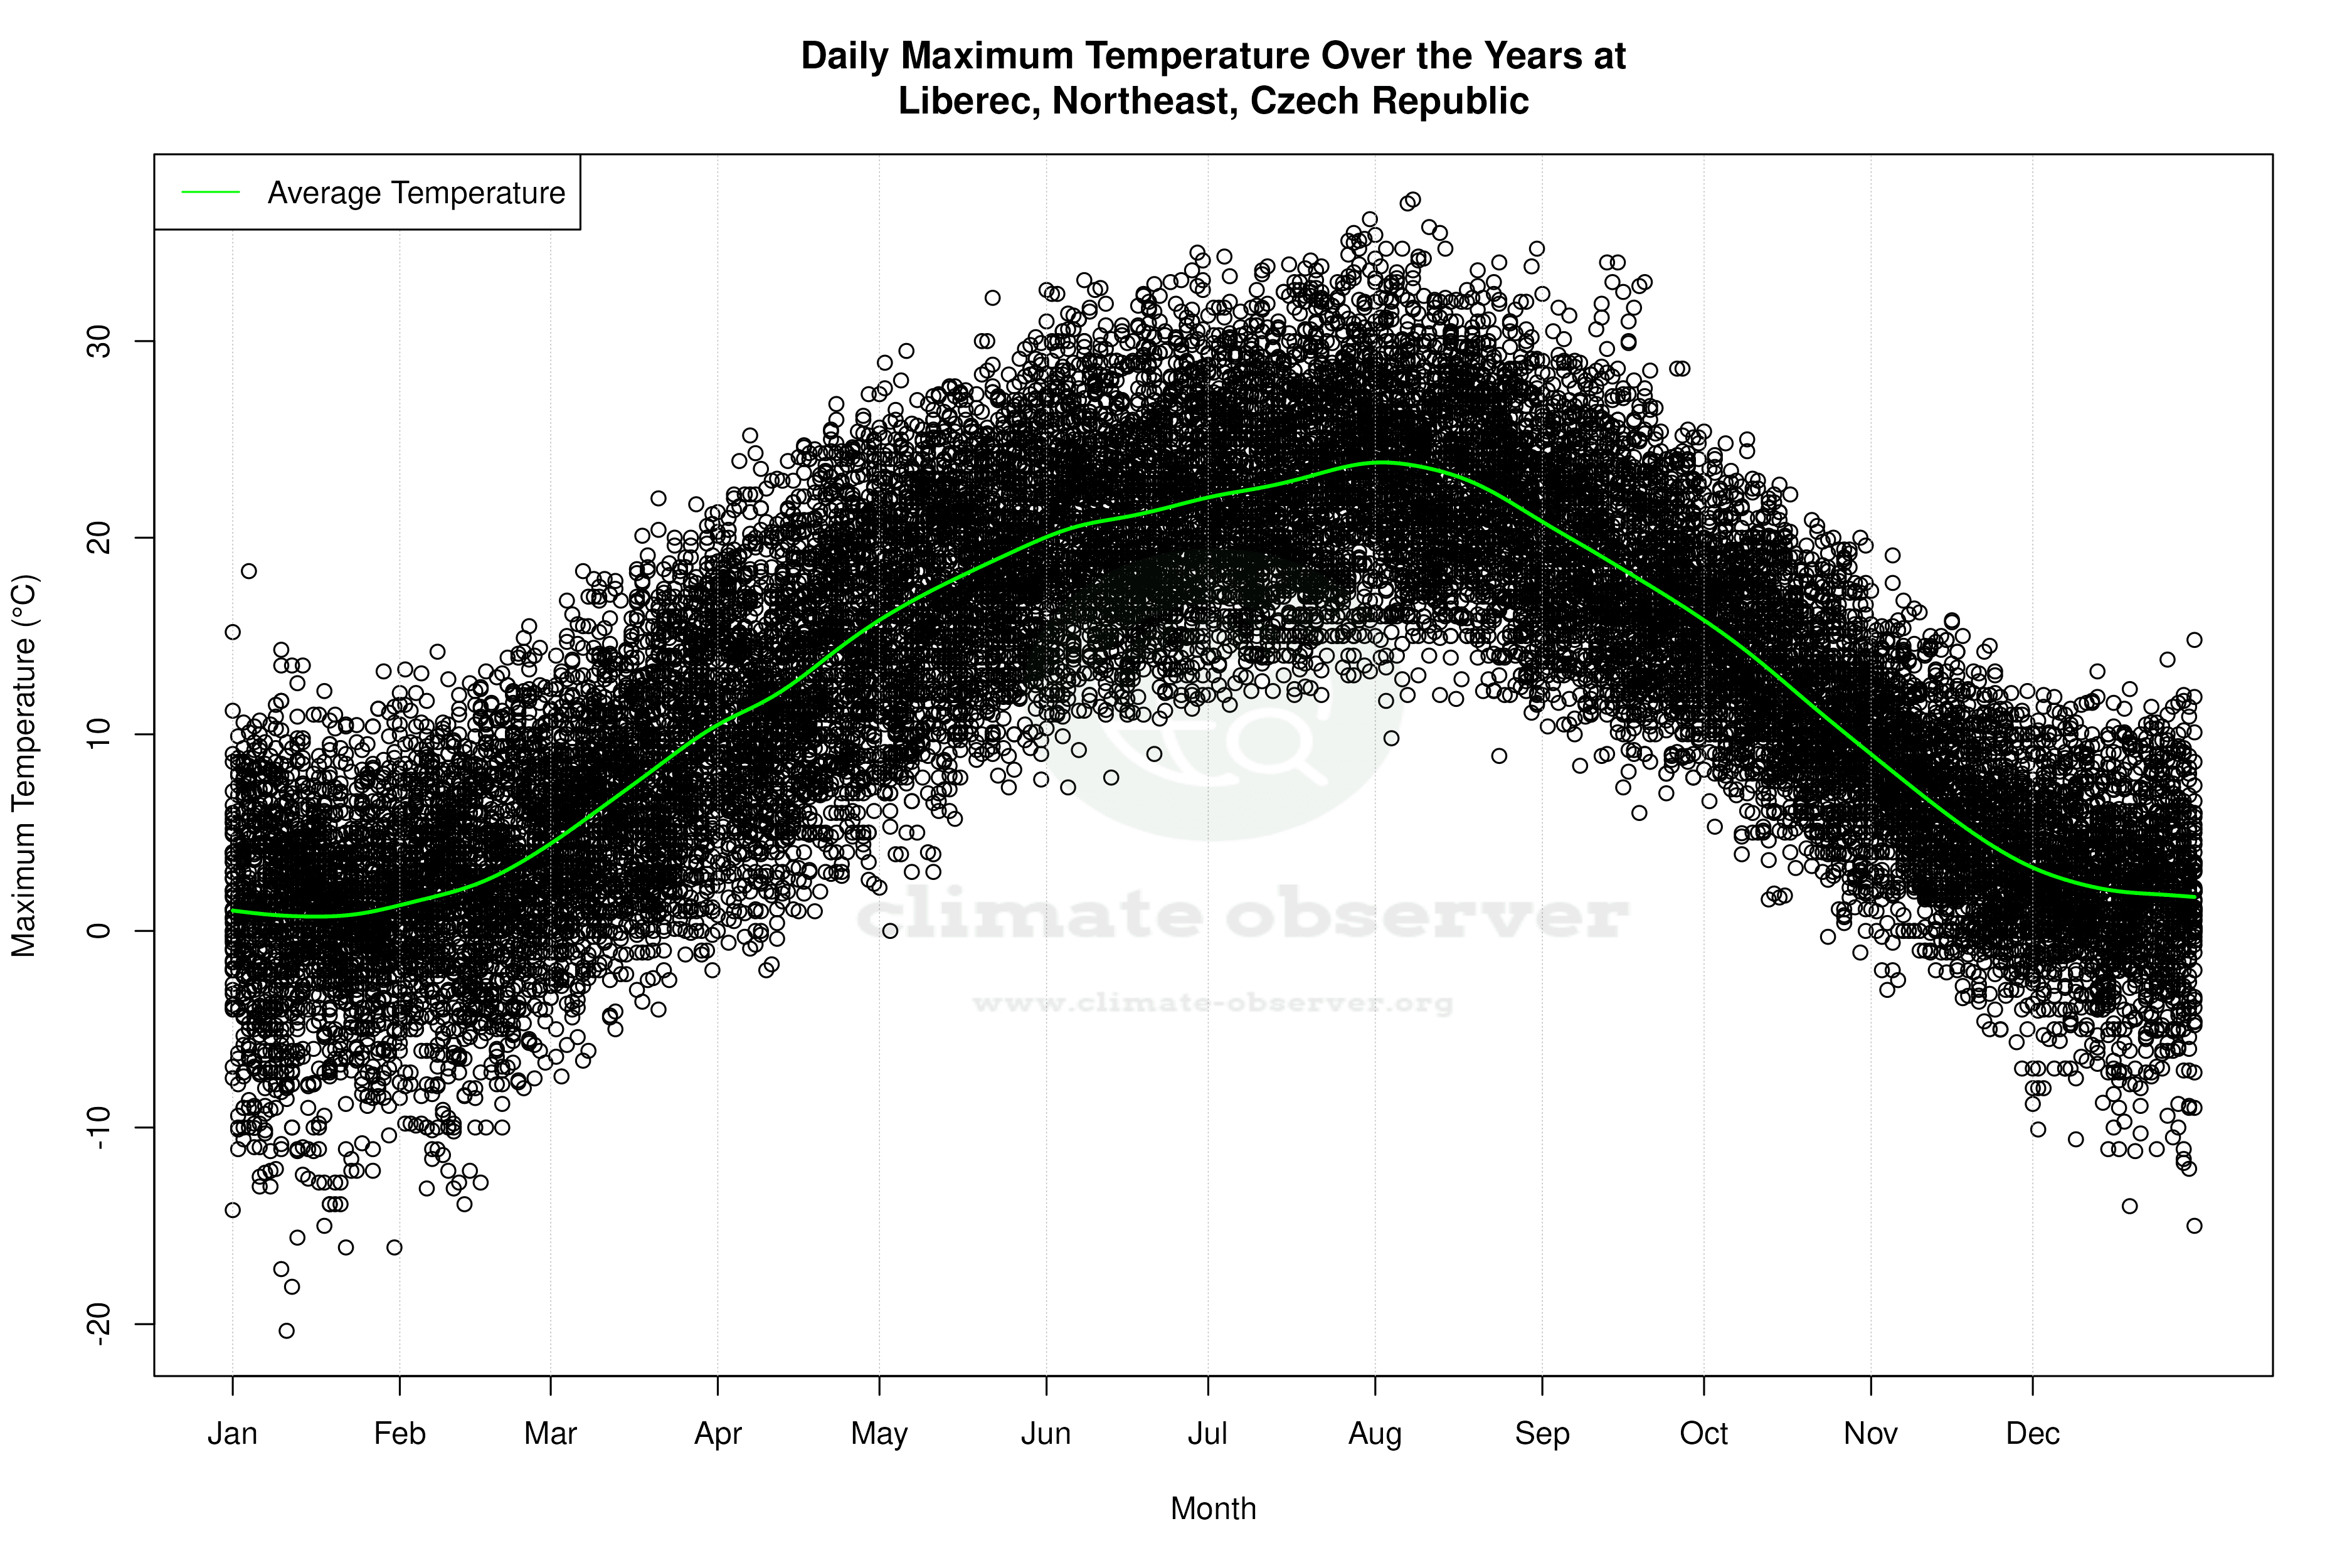

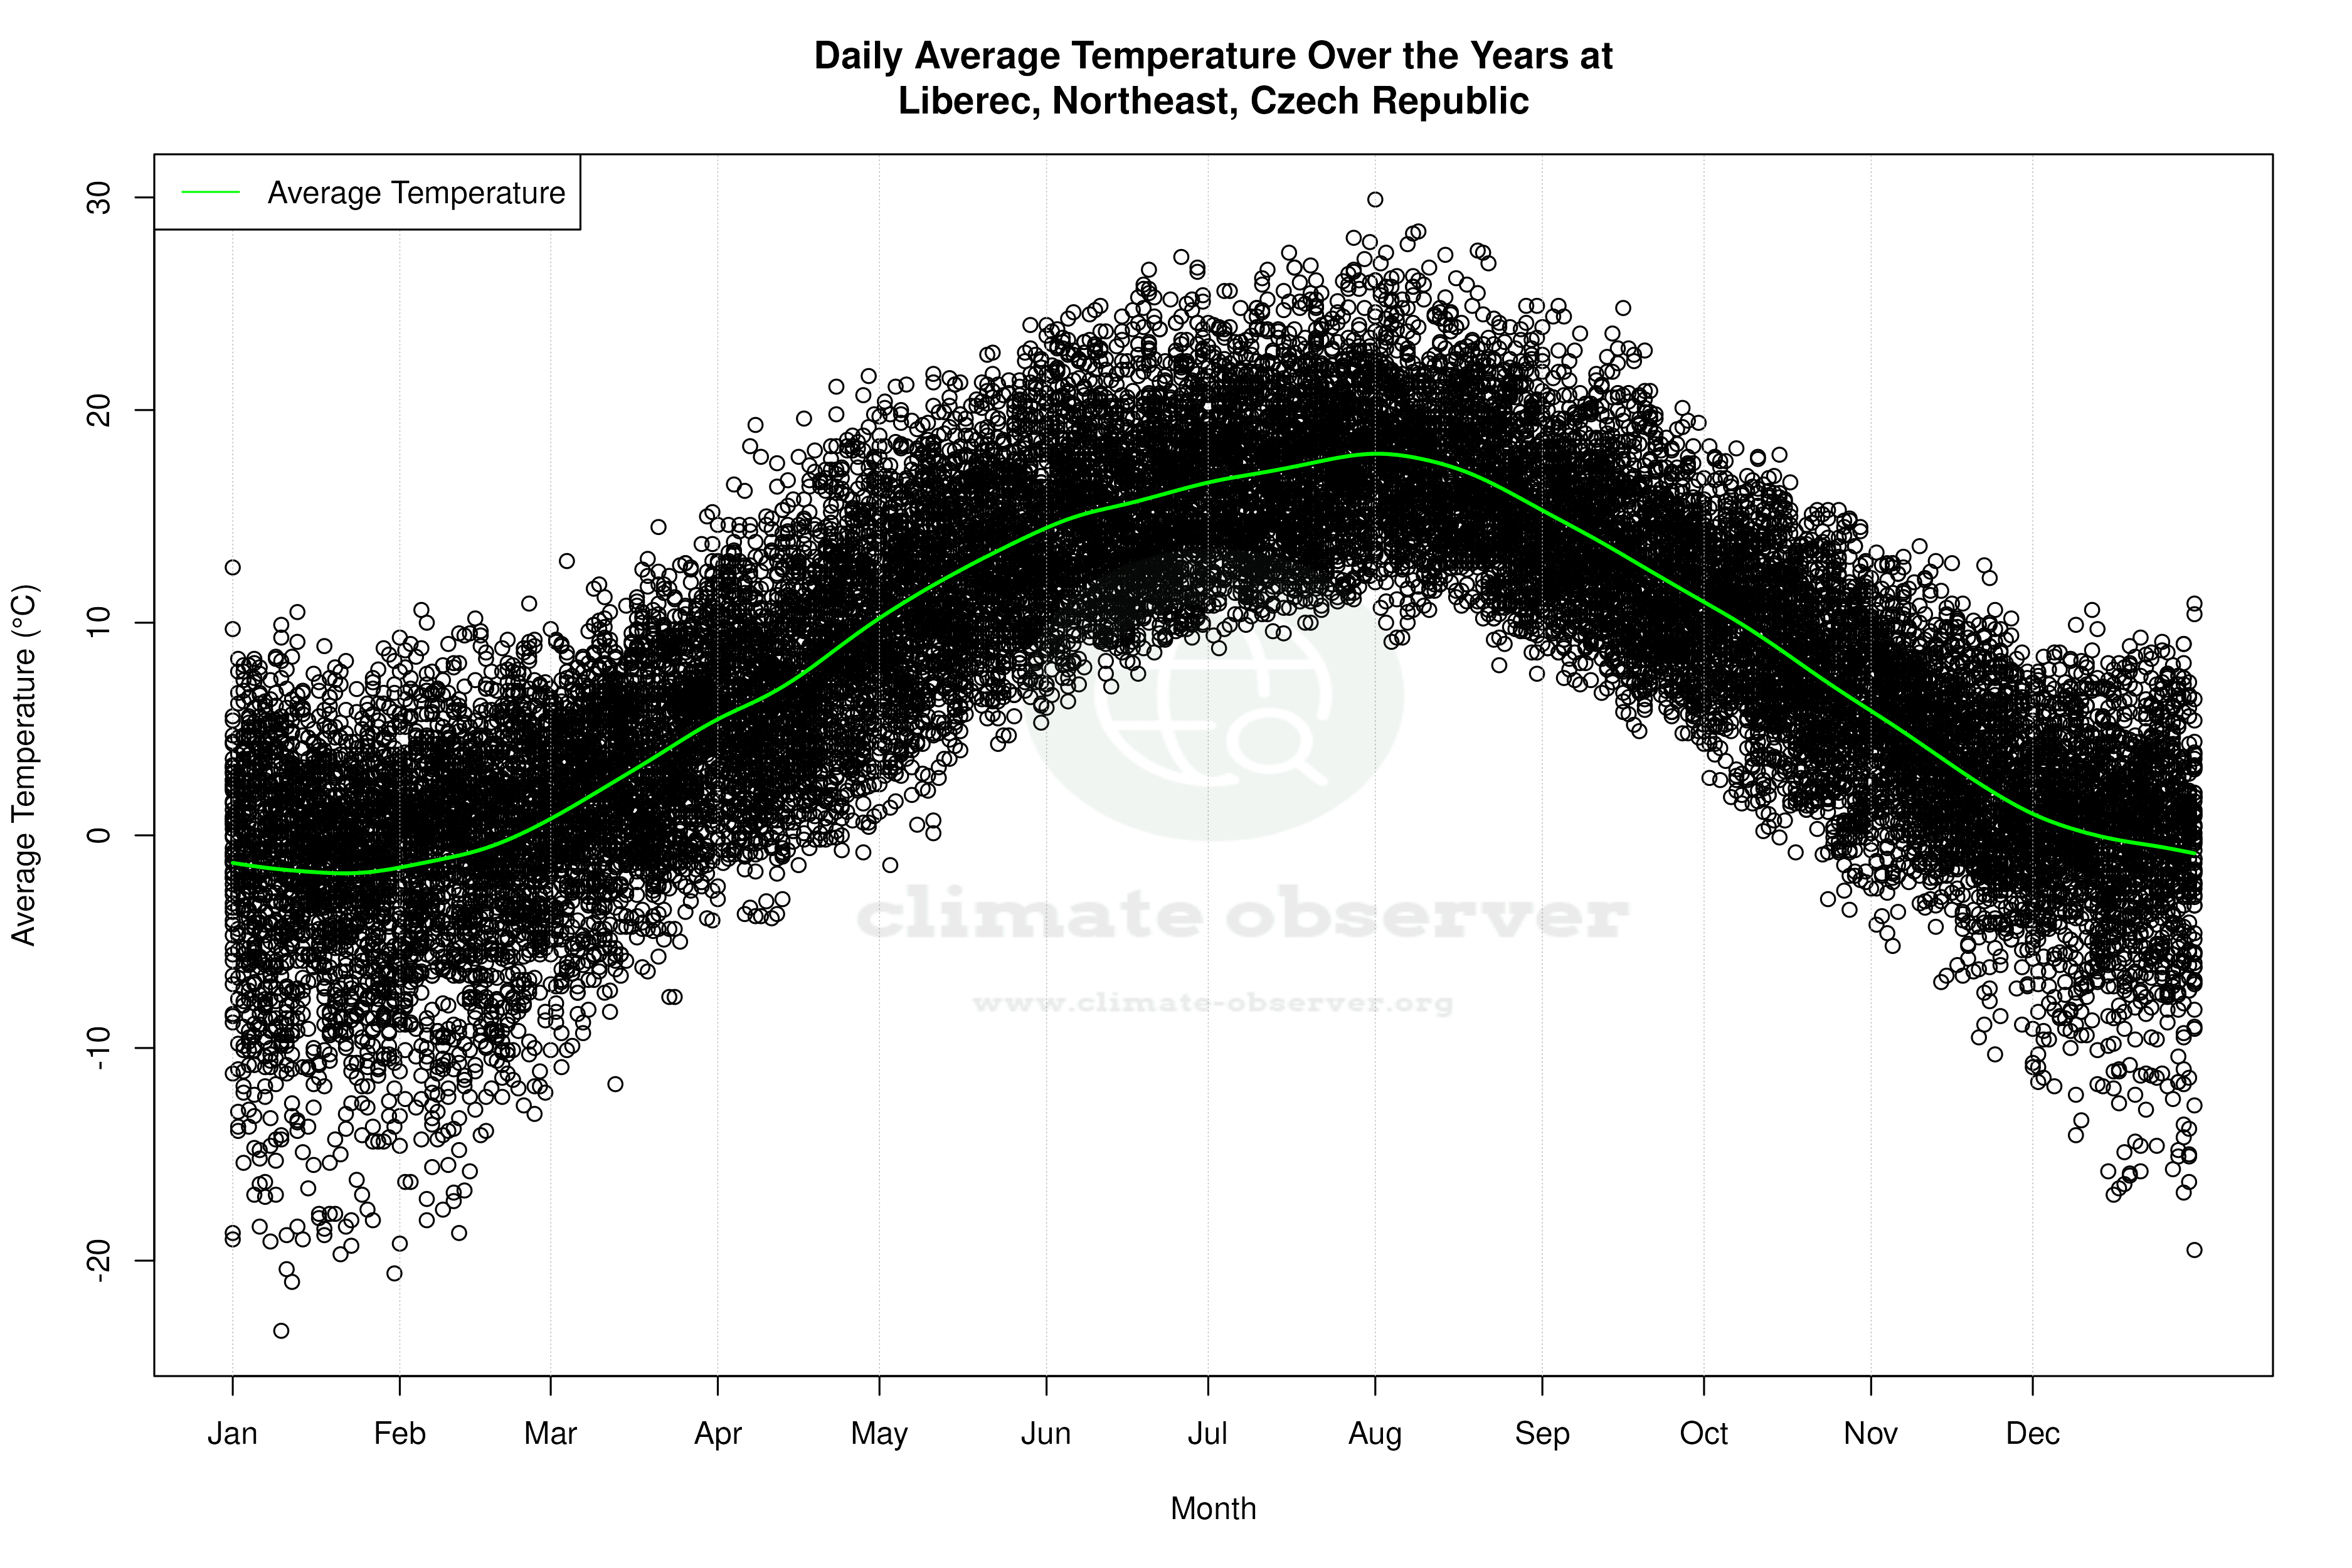
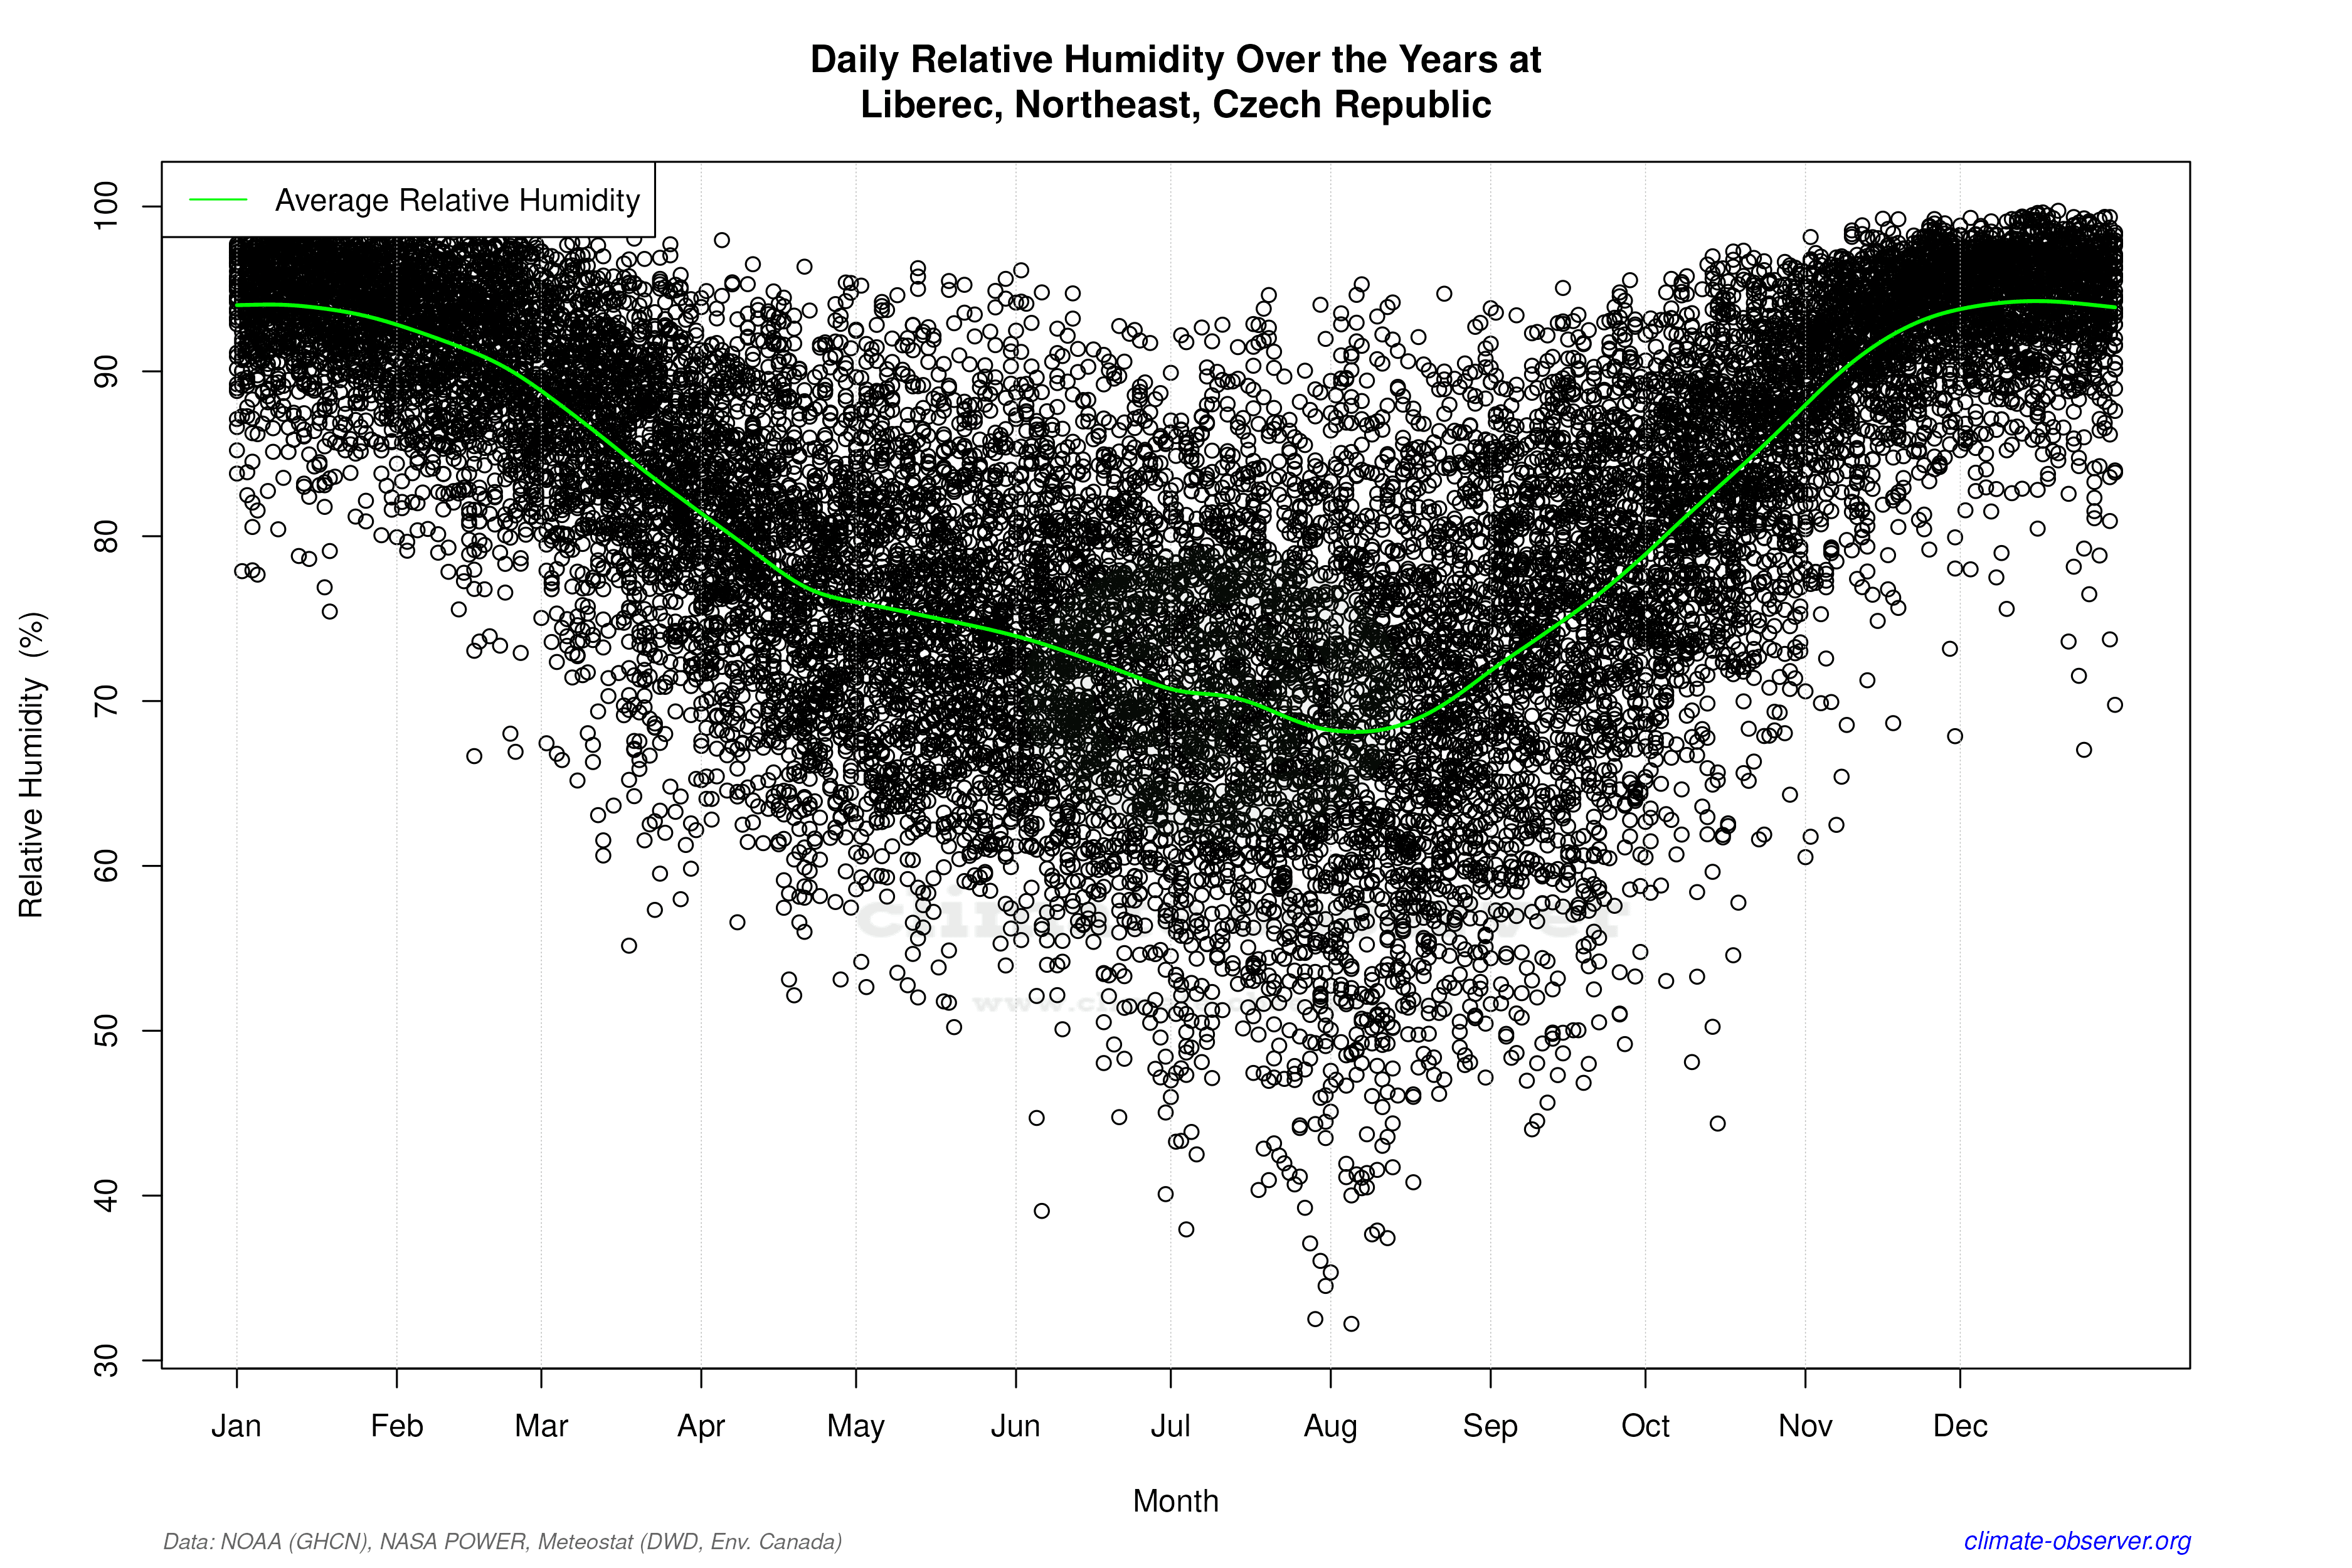

Average Max Temperature Throughout Year | 1 of 5
