Climate for Station: Nadi Airport, Western, Fiji
Loading live weather...
Climate Analysis & Overview
Nadi Airport is experiencing a warming trend, with a notable increase in high temperatures over the last decade. Despite this, precipitation is becoming more evenly distributed, which could influence local climate resilience efforts in Fiji.
Tropical Temperature Trends
Nadi Airport, situated in the tropical paradise of Fiji, is classified under the Köppen climate classification as an Af climate, indicating a tropical rainforest climate with significant rainfall throughout the year. Over the past decade, the temperature trends at this location reveal a warming pattern. High temperatures have increased by 0.57°C (1.03°F), while low temperatures have seen a modest rise of 0.07°C (0.13°F). When considering the all-time trends, the warming is more gradual, with highs increasing by 0.11°C (0.20°F) and lows by 0.10°C (0.18°F). These trends suggest a consistent rise in temperatures, aligning with global warming patterns.
Record Extremes and Implications
The absolute temperature records at Nadi Airport highlight the potential for extreme weather conditions. The maximum recorded temperature is 36.3°C (97.3°F), while the minimum is 9.0°C (48.2°F). These extremes underscore the variability within the tropical climate, which can impact local agriculture and infrastructure. The rising temperatures, particularly in highs, could pose challenges for heat-sensitive sectors, necessitating adaptive strategies.
Precipitation Patterns and Distribution
The Precipitation Concentration Index (PCI) at Nadi Airport has shifted from a baseline of 13.6 to a current value of 10.5. This decrease indicates that precipitation is now more evenly distributed throughout the year. An even distribution of rainfall can mitigate the risks of drought and flooding, providing a more stable environment for agriculture and water resources management. This trend is particularly relevant for Fiji, as the nation aims to enhance its climate resilience in the face of changing weather patterns.
Geographical Influences on Climate
Nadi Airport's location on the western side of Viti Levu, Fiji's largest island, places it in a region influenced by both maritime and continental weather patterns. The surrounding ocean moderates temperatures, while the island's topography can lead to localized variations in weather. The interplay between these factors contributes to the observed climate trends and highlights the complexity of predicting future conditions in this region.
Regional and Global Context
Fiji has been proactive in addressing climate change, setting ambitious goals for reducing carbon emissions and enhancing resilience to climate impacts. The warming trends and changes in precipitation distribution at Nadi Airport provide critical data for informing these efforts. Understanding these local climate dynamics is essential for developing strategies that align with both national and global climate objectives.
Station Statistics
10-Year Trend
High: +0.22 °C/decade
Low: +0.10 °C/decade
Rain: +1.22 mm/decade
25-Year Trend
High: +0.32 °C/decade
Low: +0.13 °C/decade
Rain: +0.31 mm/decade
50-Year Trend
High: +0.53 °C/decade
Low: -0.26 °C/decade
Rain: +0.50 mm/decade
All-Time Trend
High: +0.11 °C/decade
Low: +0.10 °C/decade
Rain: +0.50 mm/decade
Percentage Above-Average Days
Last 12 Months: 44.4%
This Year: 17.6%
Precipitation Concentration Index (PCI) ℹ️
Last 12 Months: 11.5
Historical Average: 15.8
Percentile Rank of Last 12 Months ℹ️
High: 76th percentile
Low: 76th percentile
Rain: 76th percentile
Change in Variance ℹ️
High: -20.0%
Low: -28.0%
Intraday: -34.5%
Data Coverage
71.0%
First Year of Data
1942
Station Location
Historical Weather Records
| Max High | Avg High | Min High | Max Avg | Avg Avg | Min Avg | Max Low | Avg Low | Min Low | Max Precipitation | Avg Precipitation | Max Snow | Avg Snow | |
|---|---|---|---|---|---|---|---|---|---|---|---|---|---|
| Record | 36.3 °C | — | 20.8 °C | 30.8 °C | — | 17.0 °C | 27.3 °C | — | 9.0 °C | 235.0 mm | — | — | — |
| January | 36.3 °C | 31.0 °C | 26.0 °C | 30.5 °C | 27.0 °C | 22.2 °C | 27.0 °C | 23.7 °C | 18.3 °C | 231.1 mm | 10.3 mm | — | — |
| February | 35.5 °C | 31.0 °C | 25.8 °C | 30.8 °C | 26.9 °C | 23.1 °C | 27.3 °C | 23.8 °C | 19.0 °C | 235.0 mm | 11.1 mm | — | — |
| March | 36.0 °C | 30.7 °C | 25.7 °C | 30.4 °C | 26.7 °C | 23.3 °C | 27.3 °C | 23.7 °C | 18.8 °C | 167.6 mm | 10.3 mm | — | — |
| April | 35.1 °C | 30.3 °C | 24.9 °C | 29.9 °C | 26.1 °C | 22.6 °C | 27.3 °C | 23.0 °C | 16.5 °C | 177.0 mm | 6.4 mm | — | — |
| May | 34.0 °C | 29.2 °C | 23.7 °C | 28.4 °C | 24.8 °C | 20.0 °C | 26.2 °C | 21.4 °C | 14.1 °C | 95.0 mm | 3.1 mm | — | — |
| June | 35.0 °C | 28.6 °C | 21.7 °C | 28.0 °C | 24.0 °C | 18.4 °C | 25.3 °C | 20.4 °C | 9.6 °C | 71.4 mm | 2.1 mm | — | — |
| July | 33.9 °C | 28.0 °C | 21.1 °C | 28.5 °C | 23.3 °C | 17.0 °C | 26.0 °C | 19.4 °C | 9.0 °C | 70.1 mm | 1.4 mm | — | — |
| August | 34.2 °C | 28.2 °C | 21.0 °C | 28.6 °C | 23.5 °C | 17.2 °C | 25.2 °C | 19.6 °C | 9.0 °C | 75.9 mm | 2.2 mm | — | — |
| September | 34.9 °C | 28.9 °C | 20.8 °C | 28.4 °C | 24.4 °C | 19.1 °C | 25.0 °C | 20.5 °C | 12.4 °C | 140.0 mm | 2.6 mm | — | — |
| October | 34.3 °C | 29.6 °C | 23.0 °C | 29.0 °C | 25.2 °C | 19.3 °C | 26.3 °C | 21.4 °C | 14.5 °C | 117.5 mm | 3.0 mm | — | — |
| November | 35.9 °C | 30.3 °C | 24.5 °C | 29.4 °C | 26.1 °C | 21.6 °C | 26.5 °C | 22.4 °C | 15.1 °C | 104.9 mm | 4.6 mm | — | — |
| December | 35.6 °C | 30.8 °C | 25.0 °C | 29.8 °C | 26.7 °C | 22.0 °C | 27.1 °C | 23.2 °C | 17.5 °C | 186.2 mm | 6.7 mm | — | — |
Data Visualisations
Remove WatermarksCurrent Year Climate Trends vs Historical


Max Temperature this Year | 1 of 6
Climate 12-Month Moving Averages
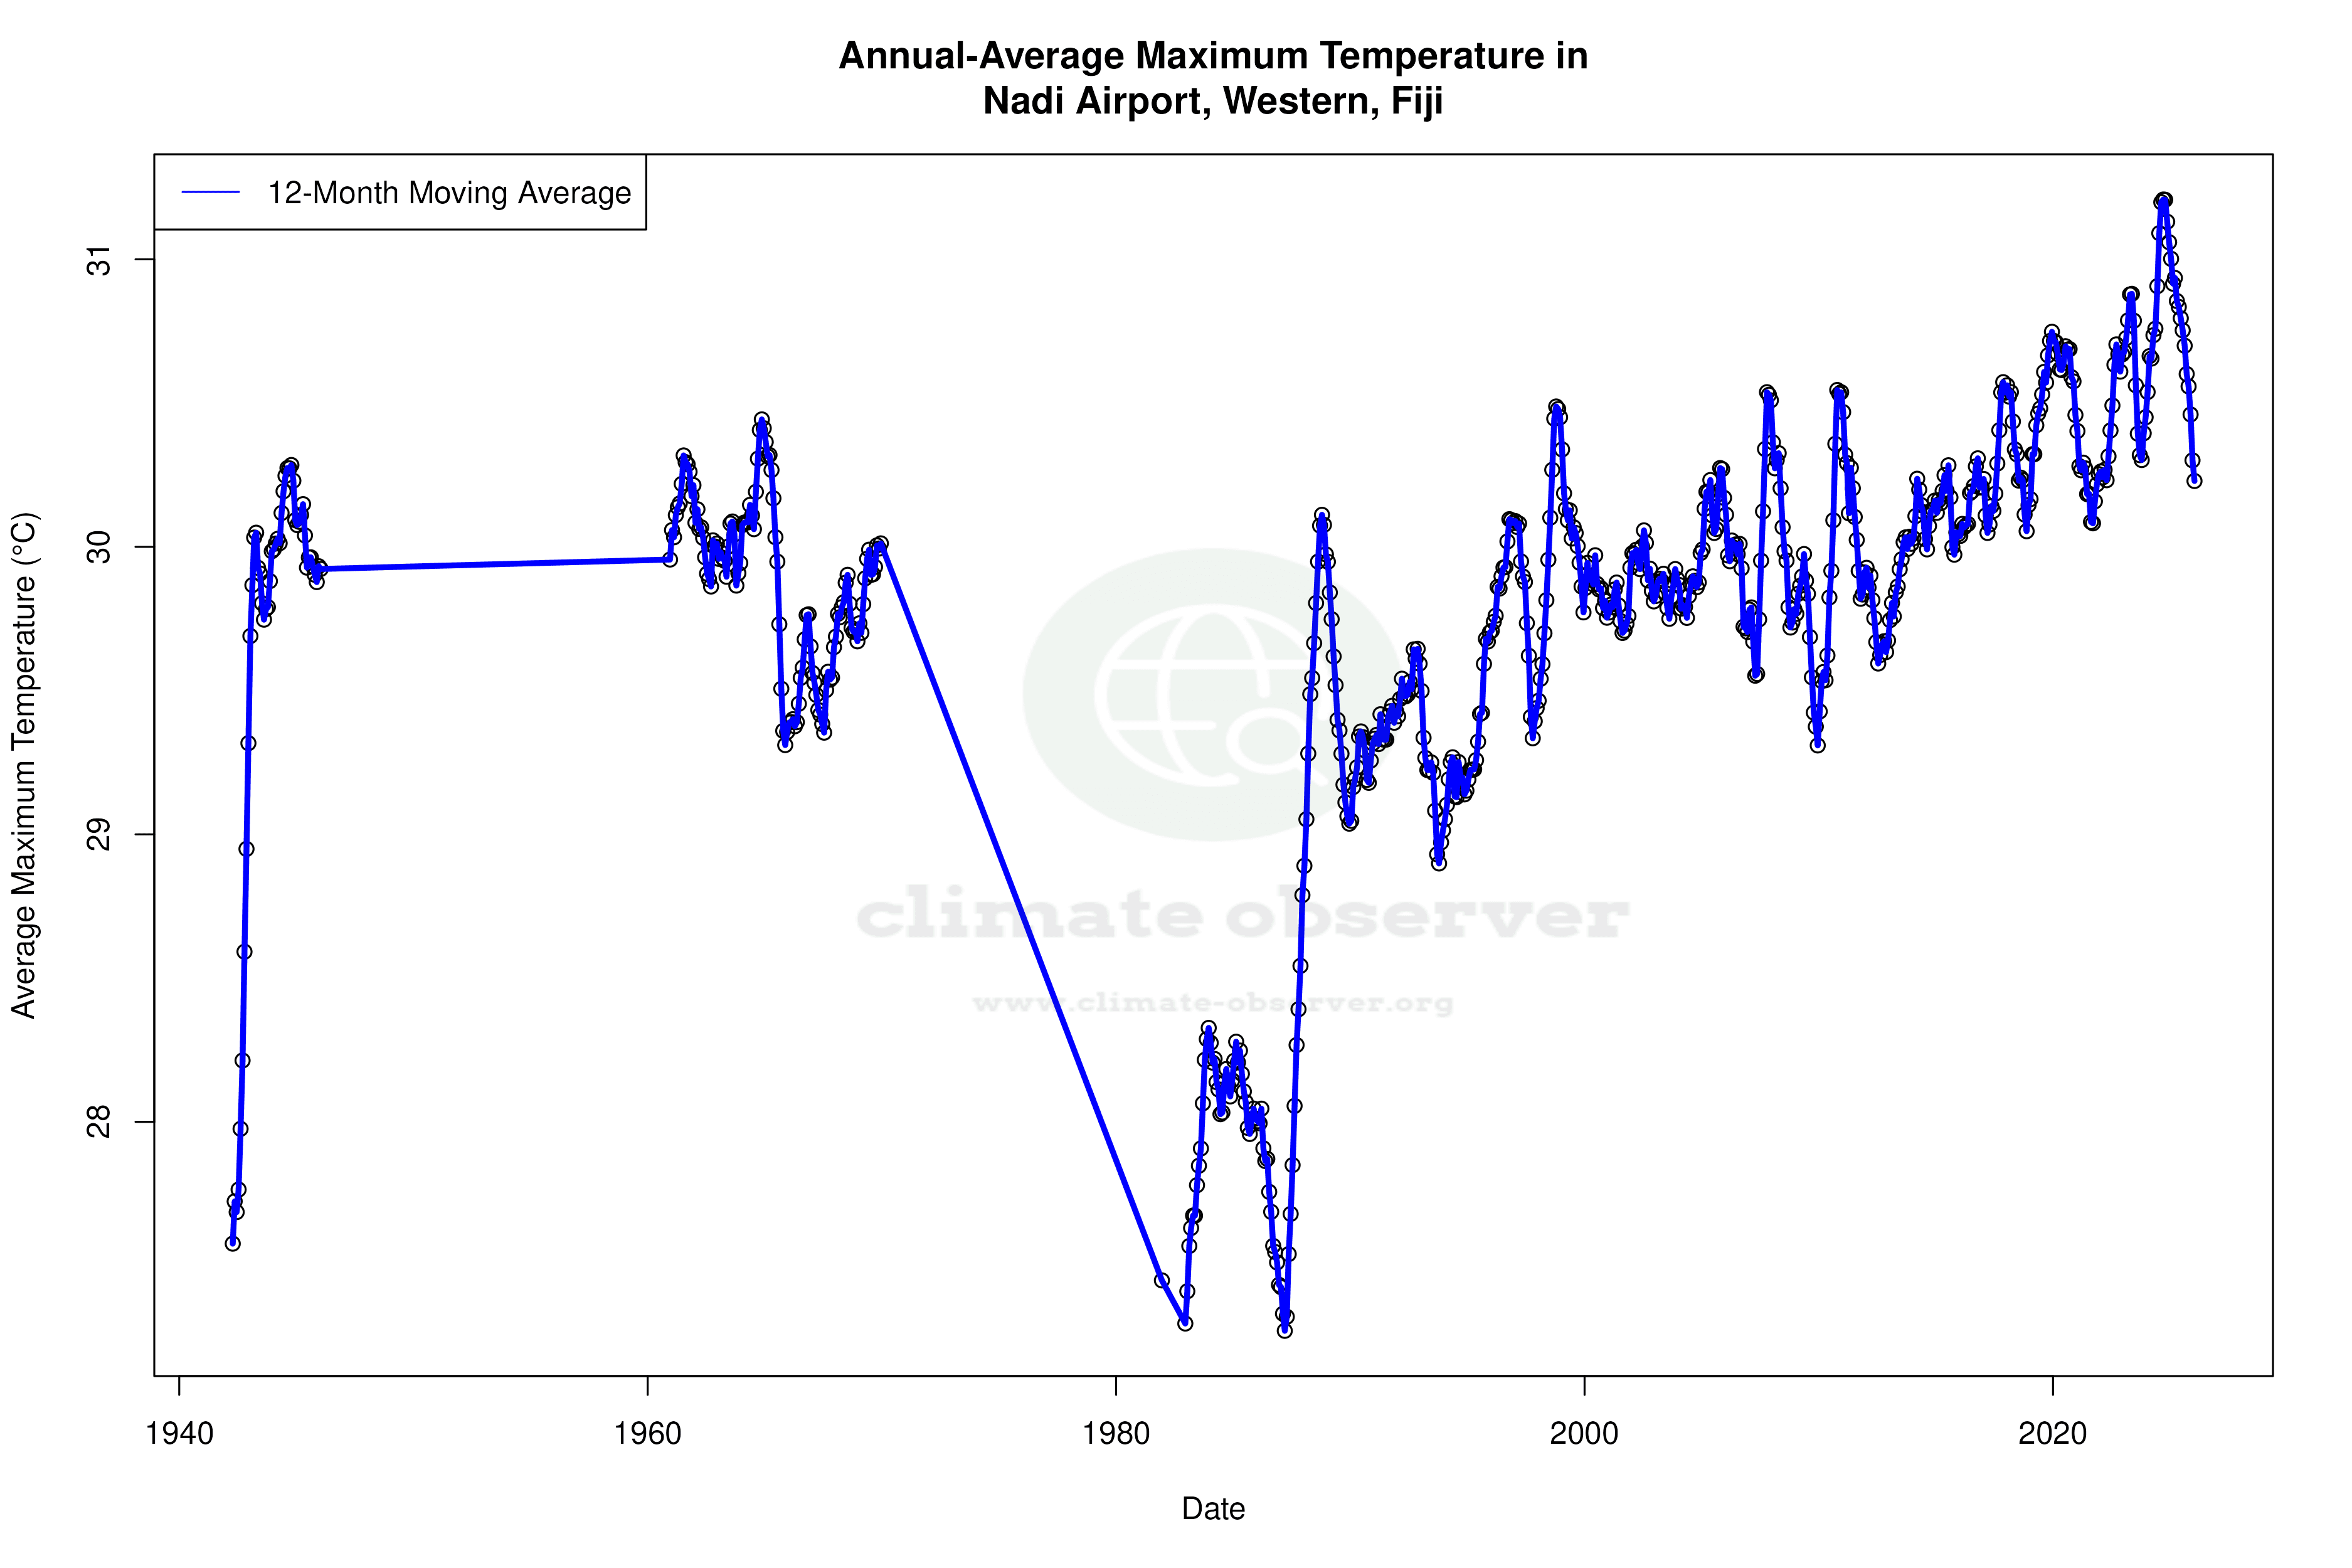


Max Temperature 12-Month MA | 1 of 6
Daily Data Points and Averages Throughout the Year


Average Max Temperature Throughout Year | 1 of 5
