Climate for Station: Yap Island Wso Ap, Yap, Federated States of Micronesia
Loading live weather...
Climate Analysis & Overview
Yap Island, located in the Federated States of Micronesia, is experiencing a nuanced climate evolution. While long-term trends indicate a slight warming, recent data reveals a cooling in high temperatures over the last decade. The precipitation pattern has become more evenly distributed, offering a rare stability in a region otherwise known for its climatic volatility.
Tropical Maritime Climate Dynamics
Yap Island, situated at coordinates 9.48°N, 138.08°E, falls under the tropical rainforest climate classification (Af) according to the Köppen system. This classification is characterised by high humidity and significant rainfall throughout the year. The island's location in the western Pacific Ocean makes it susceptible to maritime influences, which moderate temperature extremes. However, the island's climate is also shaped by its proximity to the equator, resulting in consistently warm conditions.
Temperature Trends: A Mixed Bag
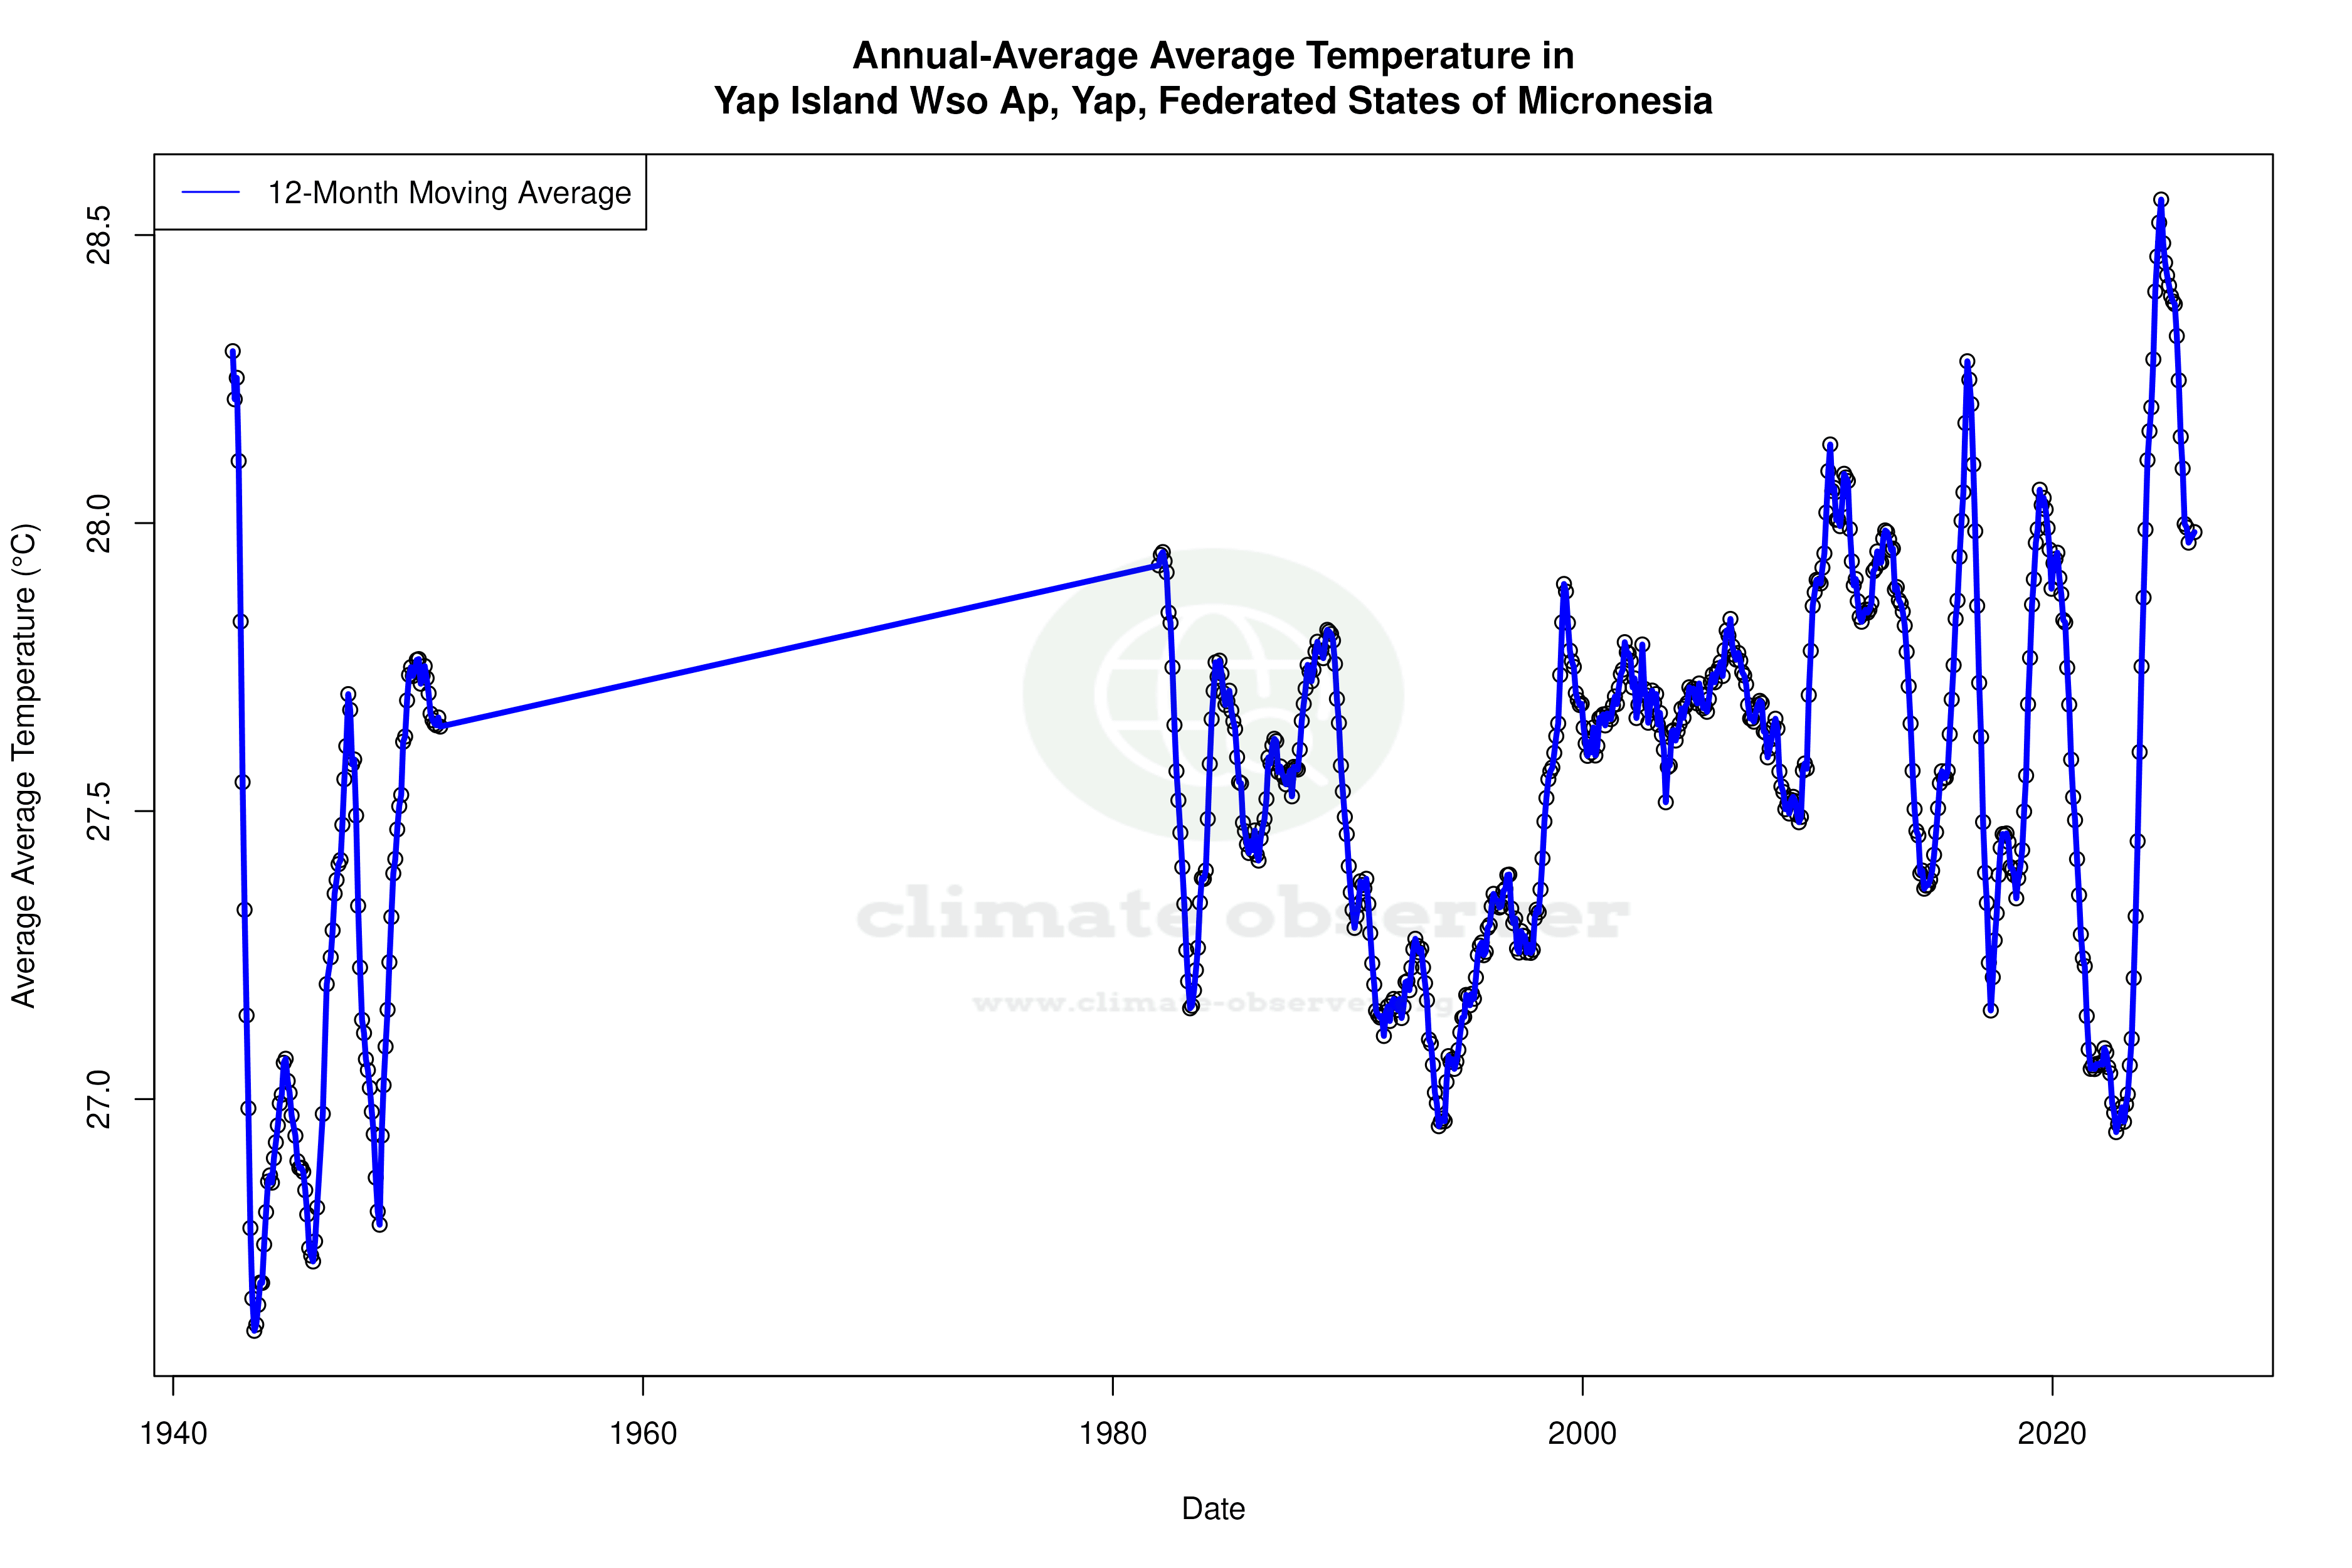
When examining temperature trends, Yap Island presents a complex picture. The all-time data indicates a slight warming trend, with highs increasing by 0.08°C (0.14°F) and lows by 0.11°C (0.20°F). However, the last decade tells a different story, with a cooling trend in high temperatures of -0.76°C (-1.36°F), while low temperatures have seen a marginal rise of 0.05°C (0.09°F). This divergence suggests a short-term cooling phase amidst a long-term warming pattern, possibly influenced by regional climate variability.
Precipitation Patterns: A Shift Towards Evenness
The Precipitation Concentration Index (PCI) provides insights into how rainfall is distributed over time. For Yap Island, the PCI has decreased from a baseline of 11.77 to a current value of 9.26, indicating a more even distribution of precipitation events. This shift suggests a move away from concentrated rainfall episodes towards a steadier pattern, which can be beneficial for agriculture and water resource management on the island.
Temperature Extremes: Record Observations
Yap Island has recorded an absolute maximum temperature of 35.9°C (96.6°F) and a minimum of 17.8°C (64.0°F). These extremes highlight the island's capacity for significant temperature variation despite its generally stable tropical climate. Such records are critical for understanding the potential range of future climate scenarios and preparing for possible impacts on local ecosystems and communities.
Regional Climate Context and Goals
The Federated States of Micronesia have set regional climate goals focusing on resilience and adaptation to climate change. Yap Island's evolving climate profile, with its mixed temperature trends and more evenly distributed rainfall, aligns with these goals by providing a foundation for sustainable development. Recent weather events, such as typhoons, underscore the importance of understanding these trends to enhance preparedness and response strategies.
Station Statistics
10-Year Trend
High: -0.74 °C/decade
Low: -0.05 °C/decade
Rain: +2.95 mm/decade
25-Year Trend
High: -0.32 °C/decade
Low: +1.43 °C/decade
Rain: +0.68 mm/decade
50-Year Trend
High: +0.03 °C/decade
Low: +0.54 °C/decade
Rain: +0.31 mm/decade
All-Time Trend
High: +0.08 °C/decade
Low: +0.10 °C/decade
Rain: -0.26 mm/decade
Percentage Above-Average Days
Last 12 Months: 42.2%
This Year: 59.0%
Precipitation Concentration Index (PCI) ℹ️
Last 12 Months: 9.3
Historical Average: 14.0
Percentile Rank of Last 12 Months ℹ️
High: 52nd percentile
Low: 88th percentile
Rain: 61st percentile
Change in Variance ℹ️
High: -3.2%
Low: -56.5%
Intraday: -47.7%
Data Coverage
84.4%
First Year of Data
1943
Station Location
Historical Weather Records
| Max High | Avg High | Min High | Max Avg | Avg Avg | Min Avg | Max Low | Avg Low | Min Low | Max Precipitation | Avg Precipitation | Max Snow | Avg Snow | |
|---|---|---|---|---|---|---|---|---|---|---|---|---|---|
| Record | 35.9 °C | — | 25.6 °C | 31.2 °C | — | 23.9 °C | 29.0 °C | — | 17.2 °C | 230.9 mm | — | 0.0 mm | — |
| January | 34.4 °C | 30.2 °C | 25.8 °C | 29.8 °C | 27.3 °C | 24.6 °C | 28.7 °C | 24.0 °C | 19.4 °C | 227.6 mm | 5.6 mm | 0.0 mm | 0.0 mm |
| February | 35.3 °C | 30.3 °C | 25.6 °C | 30.0 °C | 27.2 °C | 24.2 °C | 28.8 °C | 24.0 °C | 18.9 °C | 146.6 mm | 4.5 mm | 0.0 mm | 0.0 mm |
| March | 35.1 °C | 30.7 °C | 26.1 °C | 30.8 °C | 27.5 °C | 24.3 °C | 28.9 °C | 24.0 °C | 17.8 °C | 129.3 mm | 4.0 mm | 0.0 mm | 0.0 mm |
| April | 35.6 °C | 31.1 °C | 26.1 °C | 30.0 °C | 27.8 °C | 24.7 °C | 28.2 °C | 24.4 °C | 18.9 °C | 152.4 mm | 4.6 mm | 0.0 mm | 0.0 mm |
| May | 35.4 °C | 31.2 °C | 25.6 °C | 30.3 °C | 27.9 °C | 25.1 °C | 28.4 °C | 24.5 °C | 19.4 °C | 230.9 mm | 6.6 mm | 0.0 mm | 0.0 mm |
| June | 35.9 °C | 31.0 °C | 26.1 °C | 30.0 °C | 27.7 °C | 23.9 °C | 28.4 °C | 24.2 °C | 18.3 °C | 140.0 mm | 8.8 mm | 0.0 mm | 0.0 mm |
| July | 35.3 °C | 30.8 °C | 25.6 °C | 29.6 °C | 27.5 °C | 24.9 °C | 27.9 °C | 24.0 °C | 18.9 °C | 167.6 mm | 10.3 mm | 0.0 mm | 0.0 mm |
| August | 34.9 °C | 30.6 °C | 26.1 °C | 30.4 °C | 27.5 °C | 24.8 °C | 28.5 °C | 23.9 °C | 18.3 °C | 160.8 mm | 10.4 mm | 0.0 mm | 0.0 mm |
| September | 35.6 °C | 30.8 °C | 25.6 °C | 30.0 °C | 27.5 °C | 24.8 °C | 28.4 °C | 23.9 °C | 18.9 °C | 174.0 mm | 9.6 mm | 0.0 mm | 0.0 mm |
| October | 35.6 °C | 30.9 °C | 25.6 °C | 29.8 °C | 27.5 °C | 24.7 °C | 28.7 °C | 23.9 °C | 18.9 °C | 121.7 mm | 9.0 mm | 0.0 mm | 0.0 mm |
| November | 34.4 °C | 30.9 °C | 26.7 °C | 31.2 °C | 27.7 °C | 24.4 °C | 28.5 °C | 24.2 °C | 17.2 °C | 226.3 mm | 7.2 mm | 0.0 mm | 0.0 mm |
| December | 34.7 °C | 30.5 °C | 26.1 °C | 30.3 °C | 27.5 °C | 24.6 °C | 29.0 °C | 24.2 °C | 18.3 °C | 126.5 mm | 6.9 mm | 0.0 mm | 0.0 mm |
Data Visualisations
Remove WatermarksCurrent Year Climate Trends vs Historical


Max Temperature this Year | 1 of 6
Climate 12-Month Moving Averages


Max Temperature 12-Month MA | 1 of 6
Daily Data Points and Averages Throughout the Year

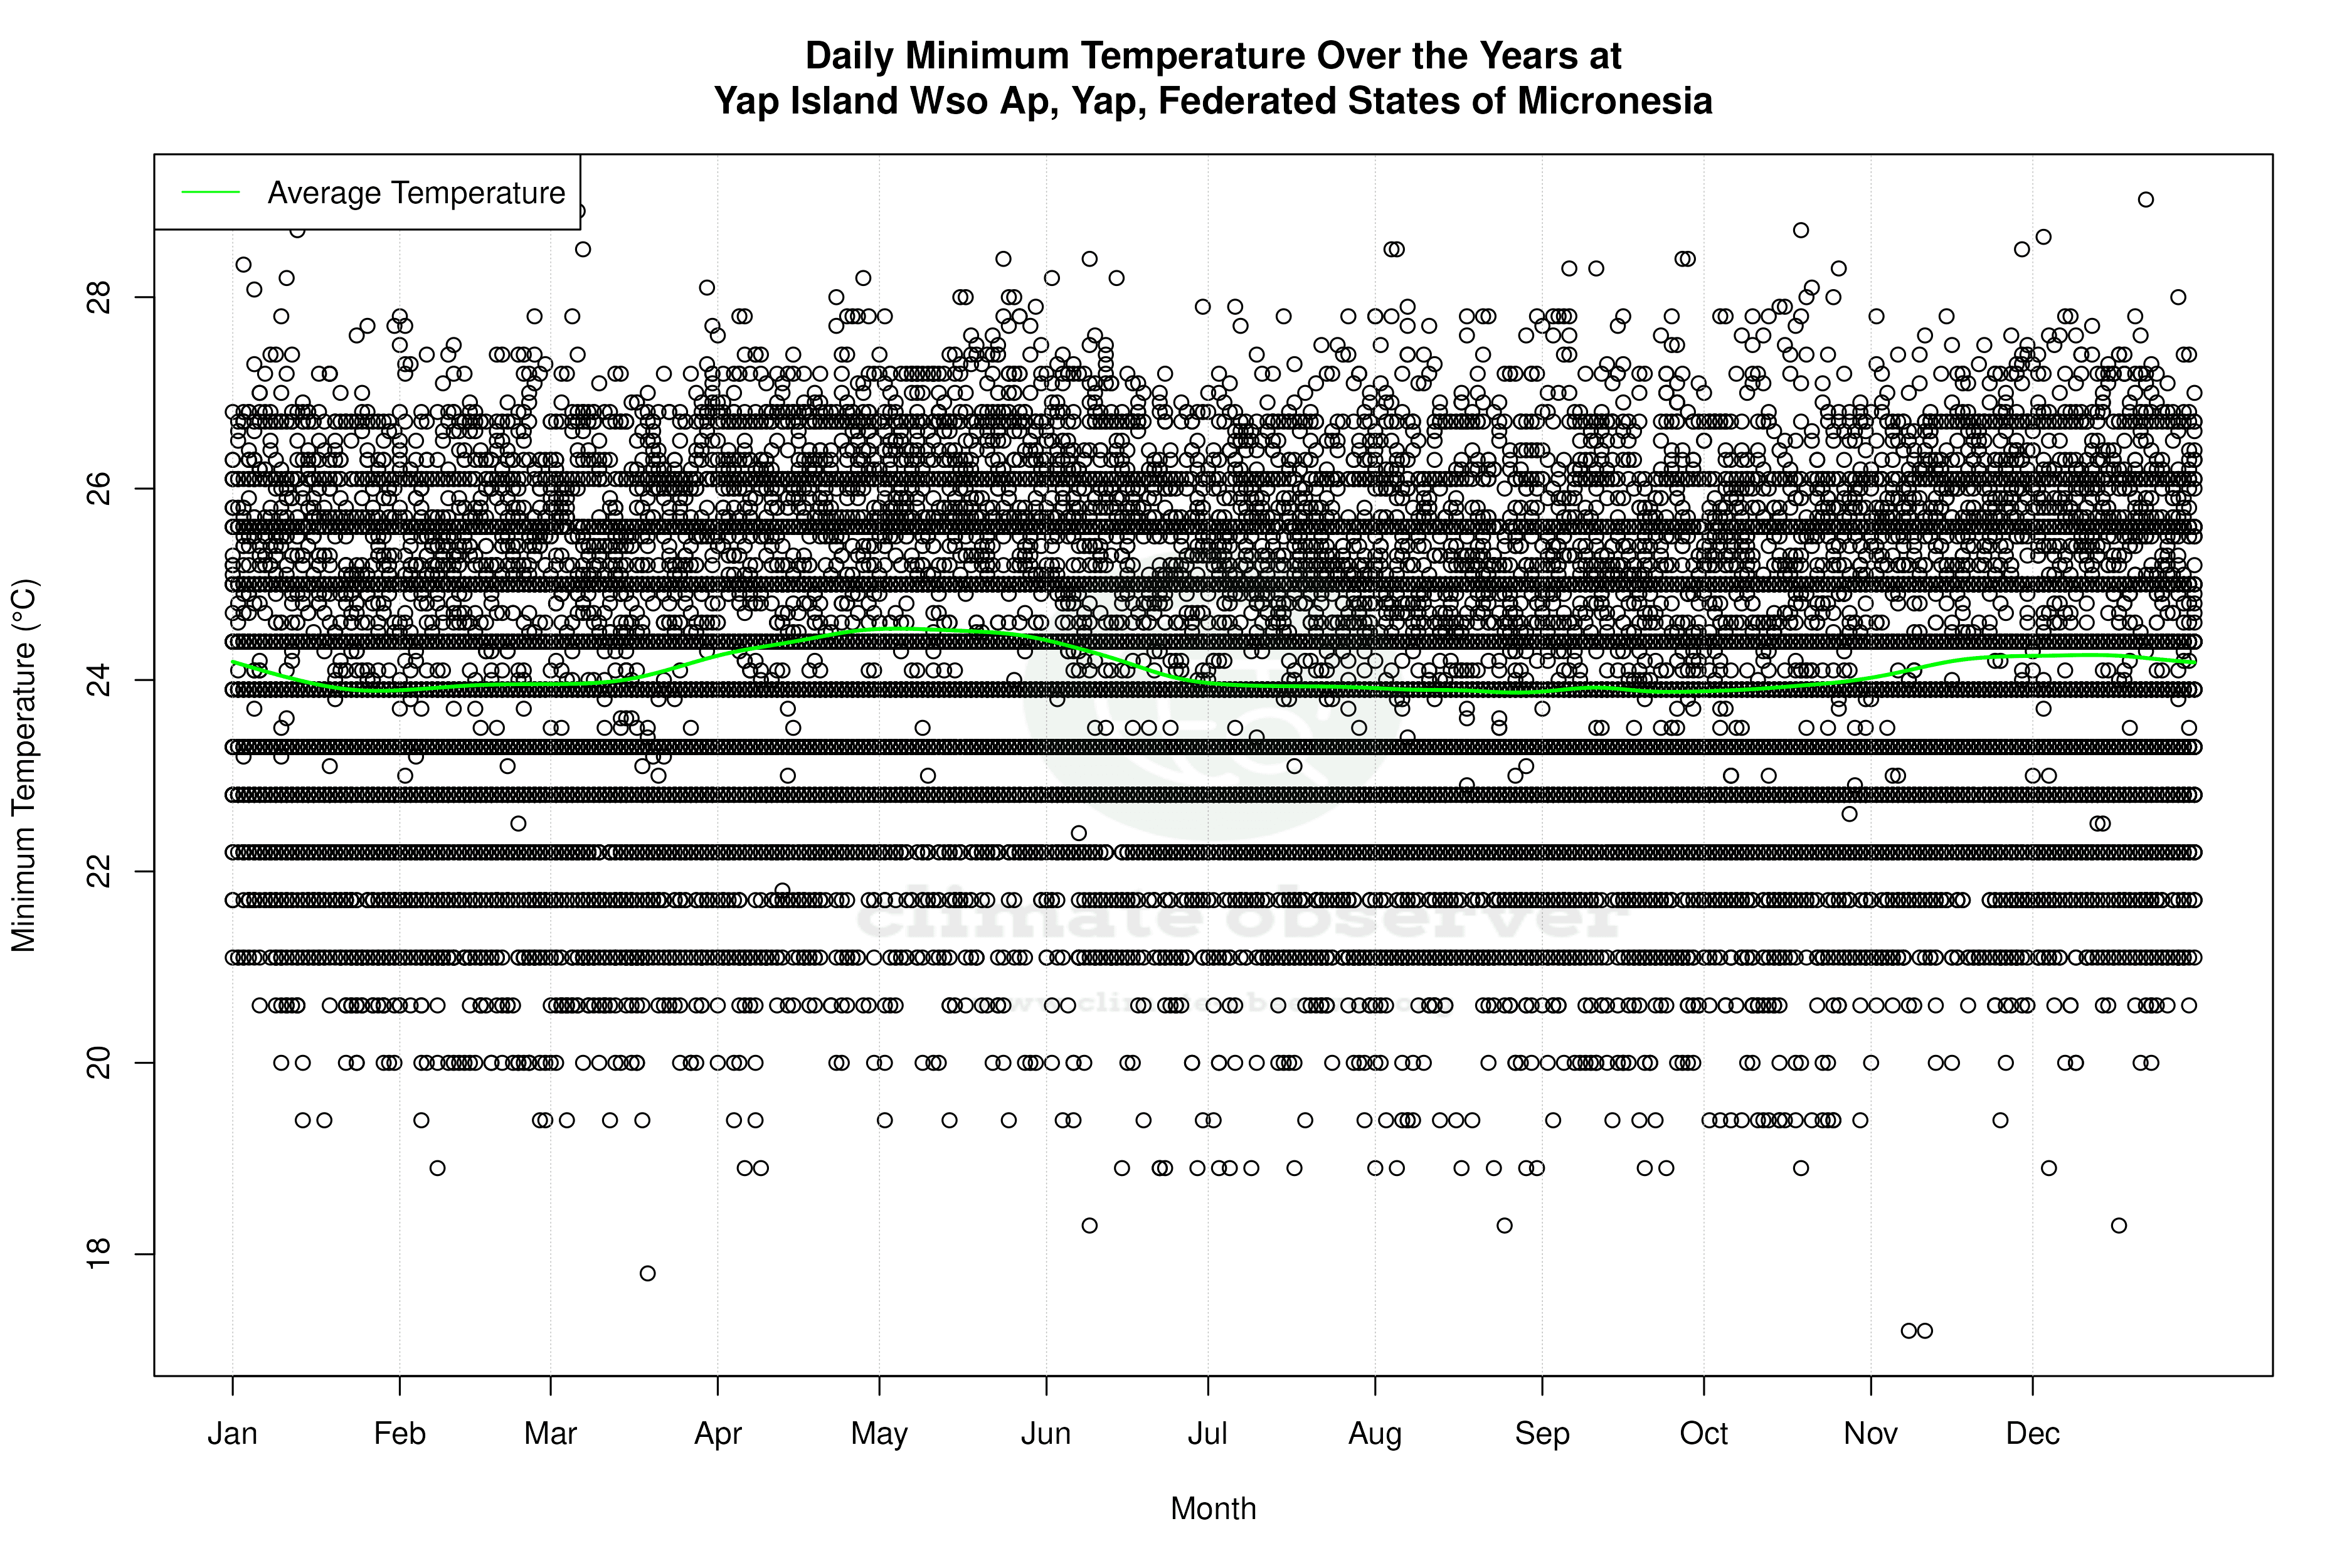


Average Max Temperature Throughout Year | 1 of 5
