Climate for Station: Toulouse-Blagnac, Occitanie, France
Loading live weather...
Climate Analysis & Overview
Toulouse-Blagnac is experiencing a notable warming trend, with both high and low temperatures rising over the past decade. The concentration of precipitation events has increased, suggesting a shift towards more intense rainfall occurrences. These changes align with broader regional climate goals to understand and adapt to evolving weather patterns.
Climate Classification and Geographic Influence
Toulouse-Blagnac, located in the Haute-Garonne department of Occitanie, France, is characterised by a Cfb climate according to the Köppen classification, indicating an oceanic climate with temperate summers. The proximity to the Pyrenees Mountains influences local weather patterns, often leading to variability in precipitation and temperature. The region's geography plays a crucial role in moderating extreme weather, yet recent trends suggest a shift towards warmer conditions.
Warming Trends in Temperature
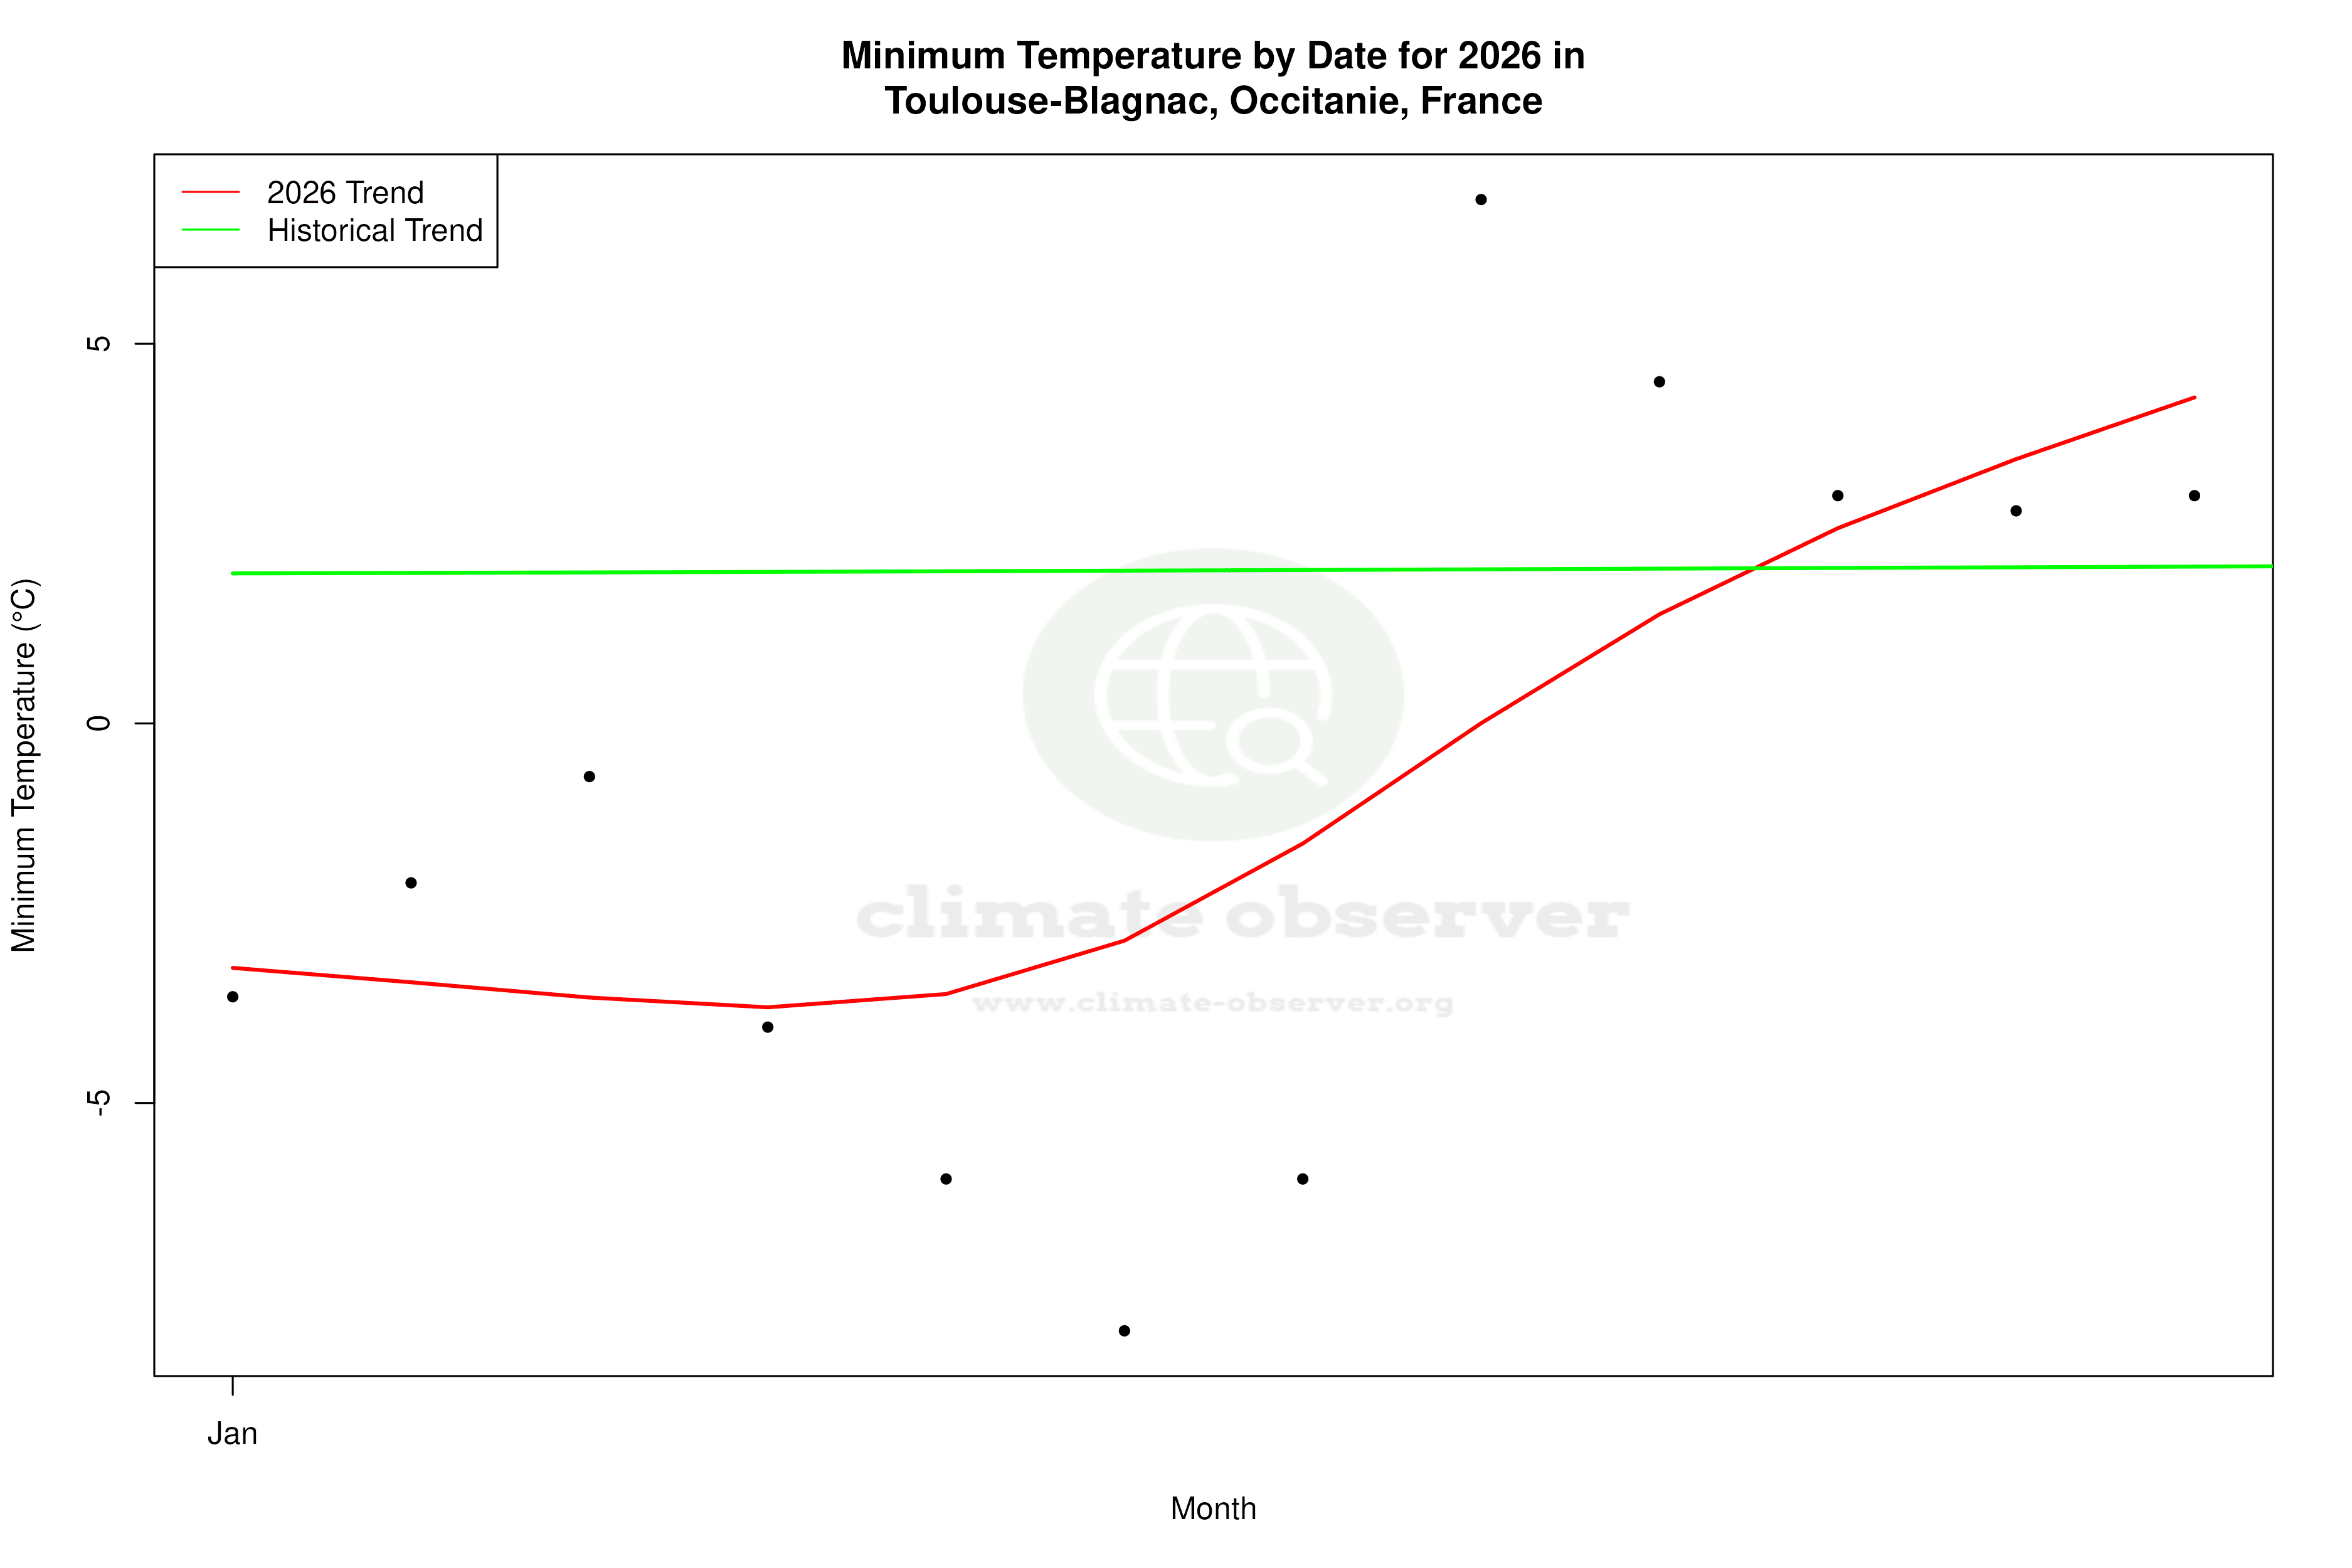
Over the past decade, Toulouse-Blagnac has experienced a warming trend, with high temperatures increasing by 1.18°C (2.12°F) and low temperatures rising by 0.99°C (1.78°F). This is more pronounced than the all-time trends, which show a rise of 0.31°C (0.56°F) for highs and 0.37°C (0.67°F) for lows. The recent decade's accelerated warming could be indicative of changing climatic conditions, potentially influenced by anthropogenic factors. The highest recorded temperature at the station is 42.4°C (108.3°F), while the lowest is -19.2°C (-2.6°F), highlighting the range of thermal extremes experienced in the area.
Precipitation Patterns and Concentration
The Precipitation Concentration Index (PCI) for Toulouse-Blagnac has increased from a baseline of 11.2 to a current value of 15.6. This indicates a shift towards more concentrated precipitation events, where rainfall is increasingly occurring in fewer, more intense episodes. Such a change can lead to challenges in water management and agriculture, as the region may face periods of drought interspersed with heavy rainfall.
Regional Climate Goals and Adaptation
In the context of France's regional climate goals, which aim to mitigate and adapt to climate change impacts, the data from Toulouse-Blagnac provides valuable insights. The observed warming trends and increased precipitation concentration align with broader patterns seen across France and Europe. These findings underscore the importance of continued monitoring and adaptation strategies to address the potential impacts on agriculture, infrastructure, and natural ecosystems.
Implications for Future Weather Events
The trends observed at Toulouse-Blagnac suggest potential implications for future weather events, including increased frequency of heatwaves and intense rainfall. These changes necessitate a proactive approach to climate resilience, ensuring that infrastructure and communities are prepared to cope with evolving weather patterns. As the region continues to monitor these changes, the data from Toulouse-Blagnac will be crucial in informing policy and adaptation strategies.
Station Statistics
10-Year Trend
High: +1.14 °C/decade
Low: +0.99 °C/decade
Rain: -0.19 mm/decade
25-Year Trend
High: +0.90 °C/decade
Low: +0.64 °C/decade
Rain: -0.09 mm/decade
50-Year Trend
High: +0.47 °C/decade
Low: +0.50 °C/decade
Rain: -0.07 mm/decade
All-Time Trend
High: +0.29 °C/decade
Low: +0.35 °C/decade
Rain: -0.03 mm/decade
Percentage Above-Average Days
Last 12 Months: 53.4%
This Year: 69.2%
Precipitation Concentration Index (PCI) ℹ️
Last 12 Months: 12.1
Historical Average: 12.6
Percentile Rank of Last 12 Months ℹ️
High: 93rd percentile
Low: 95th percentile
Rain: 13th percentile
Change in Variance ℹ️
High: +6.3%
Low: +0.7%
Intraday: -6.9%
Data Coverage
91.8%
First Year of Data
1947
Station Location
Historical Weather Records
| Max High | Avg High | Min High | Max Avg | Avg Avg | Min Avg | Max Low | Avg Low | Min Low | Max Precipitation | Avg Precipitation | Max Snow | Avg Snow | |
|---|---|---|---|---|---|---|---|---|---|---|---|---|---|
| Record | 42.4 °C | — | -9.6 °C | 33.1 °C | — | -11.2 °C | 27.4 °C | — | -18.6 °C | 82.7 mm | — | — | — |
| January | 21.2 °C | 9.2 °C | -8.4 °C | 15.3 °C | 5.7 °C | -11.2 °C | 13.6 °C | 2.2 °C | -18.6 °C | 45.4 mm | 1.7 mm | — | — |
| February | 24.1 °C | 11.0 °C | -9.6 °C | 15.2 °C | 7.0 °C | -7.7 °C | 12.3 °C | 2.8 °C | -15.8 °C | 57.0 mm | 1.6 mm | — | — |
| March | 27.1 °C | 14.3 °C | -0.8 °C | 18.2 °C | 9.6 °C | -1.7 °C | 12.9 °C | 4.8 °C | -8.4 °C | 42.2 mm | 1.6 mm | — | — |
| April | 30.0 °C | 16.9 °C | 5.3 °C | 21.0 °C | 11.9 °C | 2.3 °C | 15.9 °C | 7.1 °C | -3.0 °C | 43.8 mm | 2.0 mm | — | — |
| May | 34.5 °C | 20.8 °C | 6.9 °C | 26.7 °C | 15.7 °C | 5.9 °C | 19.3 °C | 10.5 °C | -0.8 °C | 55.0 mm | 2.3 mm | — | — |
| June | 40.2 °C | 24.9 °C | 13.3 °C | 31.8 °C | 19.7 °C | 10.0 °C | 24.2 °C | 13.9 °C | 4.0 °C | 62.3 mm | 2.0 mm | — | — |
| July | 40.2 °C | 27.8 °C | 16.0 °C | 31.2 °C | 22.2 °C | 13.2 °C | 24.6 °C | 16.0 °C | 7.6 °C | 82.7 mm | 1.3 mm | — | — |
| August | 42.4 °C | 27.7 °C | 15.4 °C | 33.1 °C | 22.1 °C | 14.2 °C | 27.4 °C | 16.0 °C | 5.5 °C | 47.0 mm | 1.4 mm | — | — |
| September | 35.3 °C | 24.4 °C | 11.8 °C | 28.3 °C | 18.8 °C | 9.6 °C | 24.2 °C | 13.4 °C | 1.9 °C | 44.1 mm | 1.6 mm | — | — |
| October | 33.0 °C | 19.5 °C | 5.6 °C | 23.9 °C | 14.6 °C | 2.2 °C | 20.6 °C | 10.0 °C | -3.0 °C | 59.3 mm | 1.6 mm | — | — |
| November | 24.3 °C | 13.2 °C | 0.0 °C | 18.1 °C | 9.4 °C | -2.7 °C | 16.8 °C | 5.5 °C | -7.5 °C | 43.7 mm | 1.8 mm | — | — |
| December | 21.1 °C | 10.0 °C | -5.0 °C | 15.6 °C | 6.6 °C | -4.8 °C | 15.0 °C | 3.2 °C | -12.0 °C | 46.4 mm | 1.7 mm | — | — |
Data Visualisations
Remove WatermarksCurrent Year Climate Trends vs Historical


Max Temperature this Year | 1 of 6
Climate 12-Month Moving Averages


Max Temperature 12-Month MA | 1 of 6
Daily Data Points and Averages Throughout the Year


Average Max Temperature Throughout Year | 1 of 5
