Climate for Station: Nantes-Bouguenais, Pays de la Loire, France
Loading live weather...
Climate Analysis & Overview
Nantes-Bouguenais is experiencing a warming trend, with significant increases in both high and low temperatures over the past decade. The precipitation pattern is becoming more concentrated, indicating fewer but more intense rainfall events. These changes are consistent with broader regional climate goals to understand and adapt to climate variability.
Maritime Influences on Temperature Trends
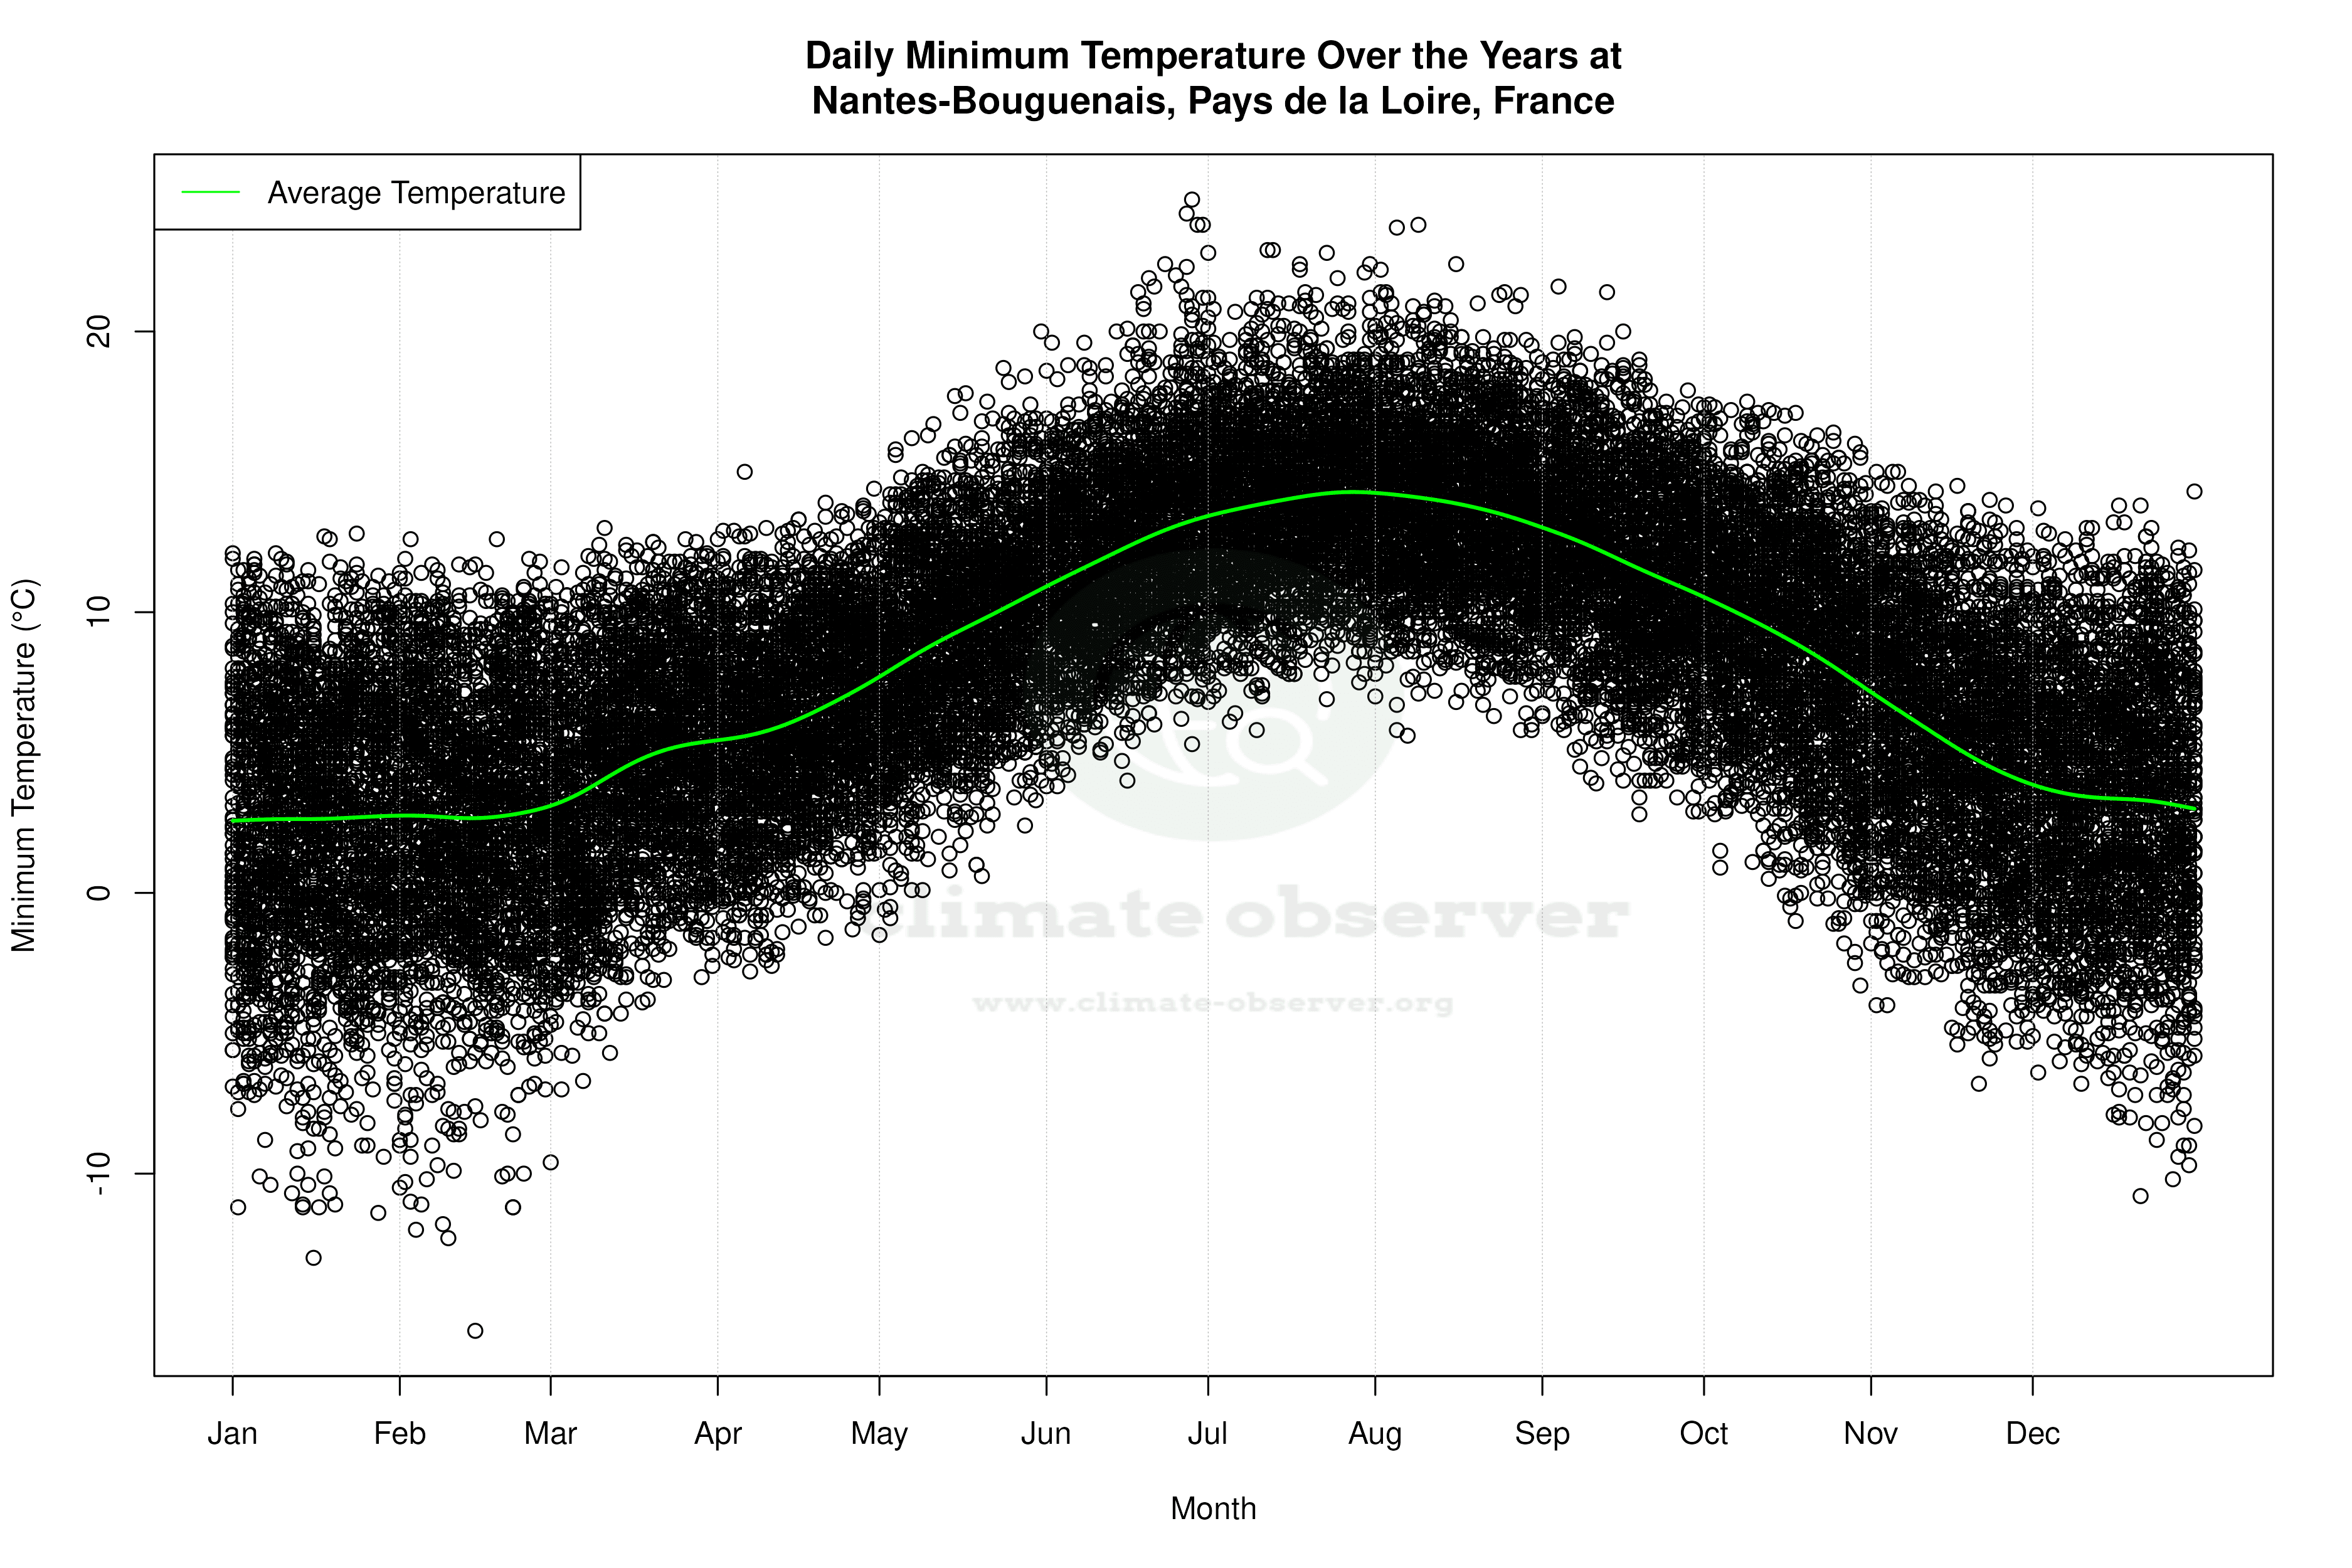
Nantes-Bouguenais, located in the Pays de la Loire region of France, is characterised by an oceanic climate (Cfb in the Köppen classification). The proximity to the Atlantic Ocean moderates temperatures, but recent data shows a warming trend. Over the past decade, high temperatures have increased by 0.51°C (0.92°F), while low temperatures have risen more sharply by 1.16°C (2.08°F). This suggests that warmer nights are becoming more common. Long-term trends also indicate a warming pattern, with all-time highs increasing by 0.23°C (0.41°F) and lows by 0.23°C (0.41°F). This rise in temperatures aligns with France's efforts to monitor and mitigate climate change impacts.
Record Extremes: A Tale of Two Temperatures
The station at Nantes-Bouguenais has recorded extreme temperatures, with a maximum of 42.0°C (107.6°F) and a minimum of -15.6°C (3.9°F). These records highlight the potential for significant temperature variability, despite the generally moderate maritime climate. Such extremes are critical for understanding potential future scenarios in the context of global warming.
Precipitation Patterns: From Even to Extreme
The Precipitation Concentration Index (PCI) at Nantes-Bouguenais has increased from a baseline of 11.99 to a current value of 15.79. This indicates a shift towards more concentrated rainfall events, meaning precipitation is increasingly falling in fewer, more intense episodes. Such a change can lead to challenges in water management and flood risk, necessitating adaptive strategies in line with regional climate goals.
Decadal Dynamics: A Closer Look at Recent Changes
While all-time trends show a steady warming, the past decade has seen more pronounced changes, especially in low temperatures. The 1.16°C (2.08°F) increase in lows over ten years suggests a significant shift in nighttime temperatures, which could affect local ecosystems and energy demands. This recent acceleration in warming highlights the importance of ongoing climate monitoring and adaptation strategies.
Regional Climate Goals and Adaptation
France's commitment to understanding and adapting to climate variability is evident in the data from Nantes-Bouguenais. The observed trends in temperature and precipitation provide valuable insights for regional climate policies. As the country aims to enhance resilience to climate impacts, such data-driven insights are crucial for informed decision-making and sustainable development.
Station Statistics
10-Year Trend
High: +0.46 °C/decade
Low: +1.17 °C/decade
Rain: +0.58 mm/decade
25-Year Trend
High: +0.68 °C/decade
Low: +0.52 °C/decade
Rain: -0.01 mm/decade
50-Year Trend
High: +0.42 °C/decade
Low: +0.23 °C/decade
Rain: +0.00 mm/decade
All-Time Trend
High: +0.20 °C/decade
Low: +0.21 °C/decade
Rain: +0.01 mm/decade
Percentage Above-Average Days
Last 12 Months: 57.5%
This Year: 64.1%
Precipitation Concentration Index (PCI) ℹ️
Last 12 Months: 10.2
Historical Average: 12.5
Percentile Rank of Last 12 Months ℹ️
High: 82nd percentile
Low: 90th percentile
Rain: 74th percentile
Change in Variance ℹ️
High: +5.5%
Low: -0.6%
Intraday: +14.6%
Data Coverage
91.4%
First Year of Data
1996
Station Location
Historical Weather Records
| Max High | Avg High | Min High | Max Avg | Avg Avg | Min Avg | Max Low | Avg Low | Min Low | Max Precipitation | Avg Precipitation | Max Snow | Avg Snow | |
|---|---|---|---|---|---|---|---|---|---|---|---|---|---|
| Record | 42.0 °C | — | -7.8 °C | 32.7 °C | — | -9.1 °C | 24.7 °C | — | -15.6 °C | 94.9 mm | — | — | — |
| January | 18.2 °C | 8.8 °C | -7.8 °C | 13.4 °C | 6.0 °C | -9.1 °C | 12.8 °C | 2.7 °C | -13.0 °C | 50.1 mm | 2.8 mm | — | — |
| February | 22.6 °C | 10.0 °C | -5.2 °C | 14.5 °C | 6.5 °C | -6.9 °C | 12.6 °C | 2.8 °C | -15.6 °C | 34.5 mm | 2.4 mm | — | — |
| March | 24.2 °C | 13.0 °C | -0.3 °C | 17.2 °C | 8.8 °C | -2.5 °C | 13.0 °C | 4.5 °C | -9.6 °C | 47.4 mm | 2.0 mm | — | — |
| April | 28.3 °C | 15.7 °C | 4.4 °C | 21.1 °C | 11.0 °C | 2.1 °C | 15.0 °C | 6.2 °C | -2.8 °C | 43.6 mm | 1.7 mm | — | — |
| May | 32.8 °C | 19.1 °C | 9.0 °C | 24.2 °C | 14.5 °C | 5.2 °C | 20.0 °C | 9.3 °C | -1.5 °C | 56.5 mm | 2.0 mm | — | — |
| June | 39.1 °C | 22.6 °C | 13.0 °C | 31.4 °C | 17.8 °C | 10.3 °C | 24.7 °C | 12.3 °C | 3.8 °C | 41.0 mm | 1.6 mm | — | — |
| July | 42.0 °C | 24.8 °C | 15.2 °C | 32.7 °C | 19.6 °C | 13.2 °C | 22.9 °C | 14.0 °C | 5.8 °C | 94.9 mm | 1.4 mm | — | — |
| August | 39.6 °C | 24.6 °C | 12.2 °C | 30.6 °C | 19.4 °C | 12.2 °C | 23.8 °C | 13.8 °C | 5.6 °C | 53.4 mm | 1.6 mm | — | — |
| September | 35.4 °C | 22.1 °C | 11.3 °C | 27.0 °C | 16.8 °C | 9.6 °C | 21.6 °C | 11.8 °C | 2.8 °C | 48.2 mm | 2.1 mm | — | — |
| October | 30.4 °C | 17.6 °C | 6.2 °C | 21.0 °C | 13.2 °C | 3.8 °C | 17.5 °C | 9.0 °C | -3.3 °C | 69.5 mm | 2.6 mm | — | — |
| November | 21.8 °C | 12.4 °C | -0.9 °C | 17.1 °C | 9.0 °C | -1.9 °C | 15.0 °C | 5.4 °C | -6.8 °C | 45.9 mm | 3.0 mm | — | — |
| December | 18.4 °C | 9.4 °C | -5.2 °C | 16.2 °C | 6.6 °C | -7.1 °C | 14.3 °C | 3.4 °C | -10.8 °C | 38.6 mm | 3.0 mm | — | — |
Data Visualisations
Remove WatermarksCurrent Year Climate Trends vs Historical


Max Temperature this Year | 1 of 6
Climate 12-Month Moving Averages


Max Temperature 12-Month MA | 1 of 6
Daily Data Points and Averages Throughout the Year


Average Max Temperature Throughout Year | 1 of 5
