Climate for Station: Tasiilaq, Greenland, Greenland [Denmark]
Loading live weather...
Climate Analysis & Overview
Tasiilaq's climate profile reveals a subtle cooling trend over the long term, with a more pronounced cooling in recent years. Precipitation patterns have become slightly more even, indicating a shift in local weather dynamics. These changes offer insights into the broader climatic shifts affecting Greenland [Denmark] and its environmental policies.
Arctic Maritime Climate
Tasiilaq, located at 65.5997°N, -37.6331°W, is classified under the Köppen climate classification as ET, or Tundra climate. This classification is characterised by long, cold winters and short, cool summers. The town's coastal position on Greenland's eastern seaboard influences its weather patterns, moderating temperatures compared to more inland areas. The presence of nearby mountains can also impact local wind patterns and precipitation distribution.
Temperature Trends: A Cooling Narrative
Over the past decade, Tasiilaq has experienced a noticeable cooling trend. High temperatures have decreased by 0.83°C (1.49°F), while low temperatures have fallen by 0.76°C (1.37°F). This recent cooling is more pronounced than the all-time trend, which shows a slight cooling of high temperatures by 0.03°C (0.05°F). Interestingly, low temperatures have actually risen slightly by 0.21°C (0.38°F) over the long term, indicating a complex interplay of factors affecting the region's climate.
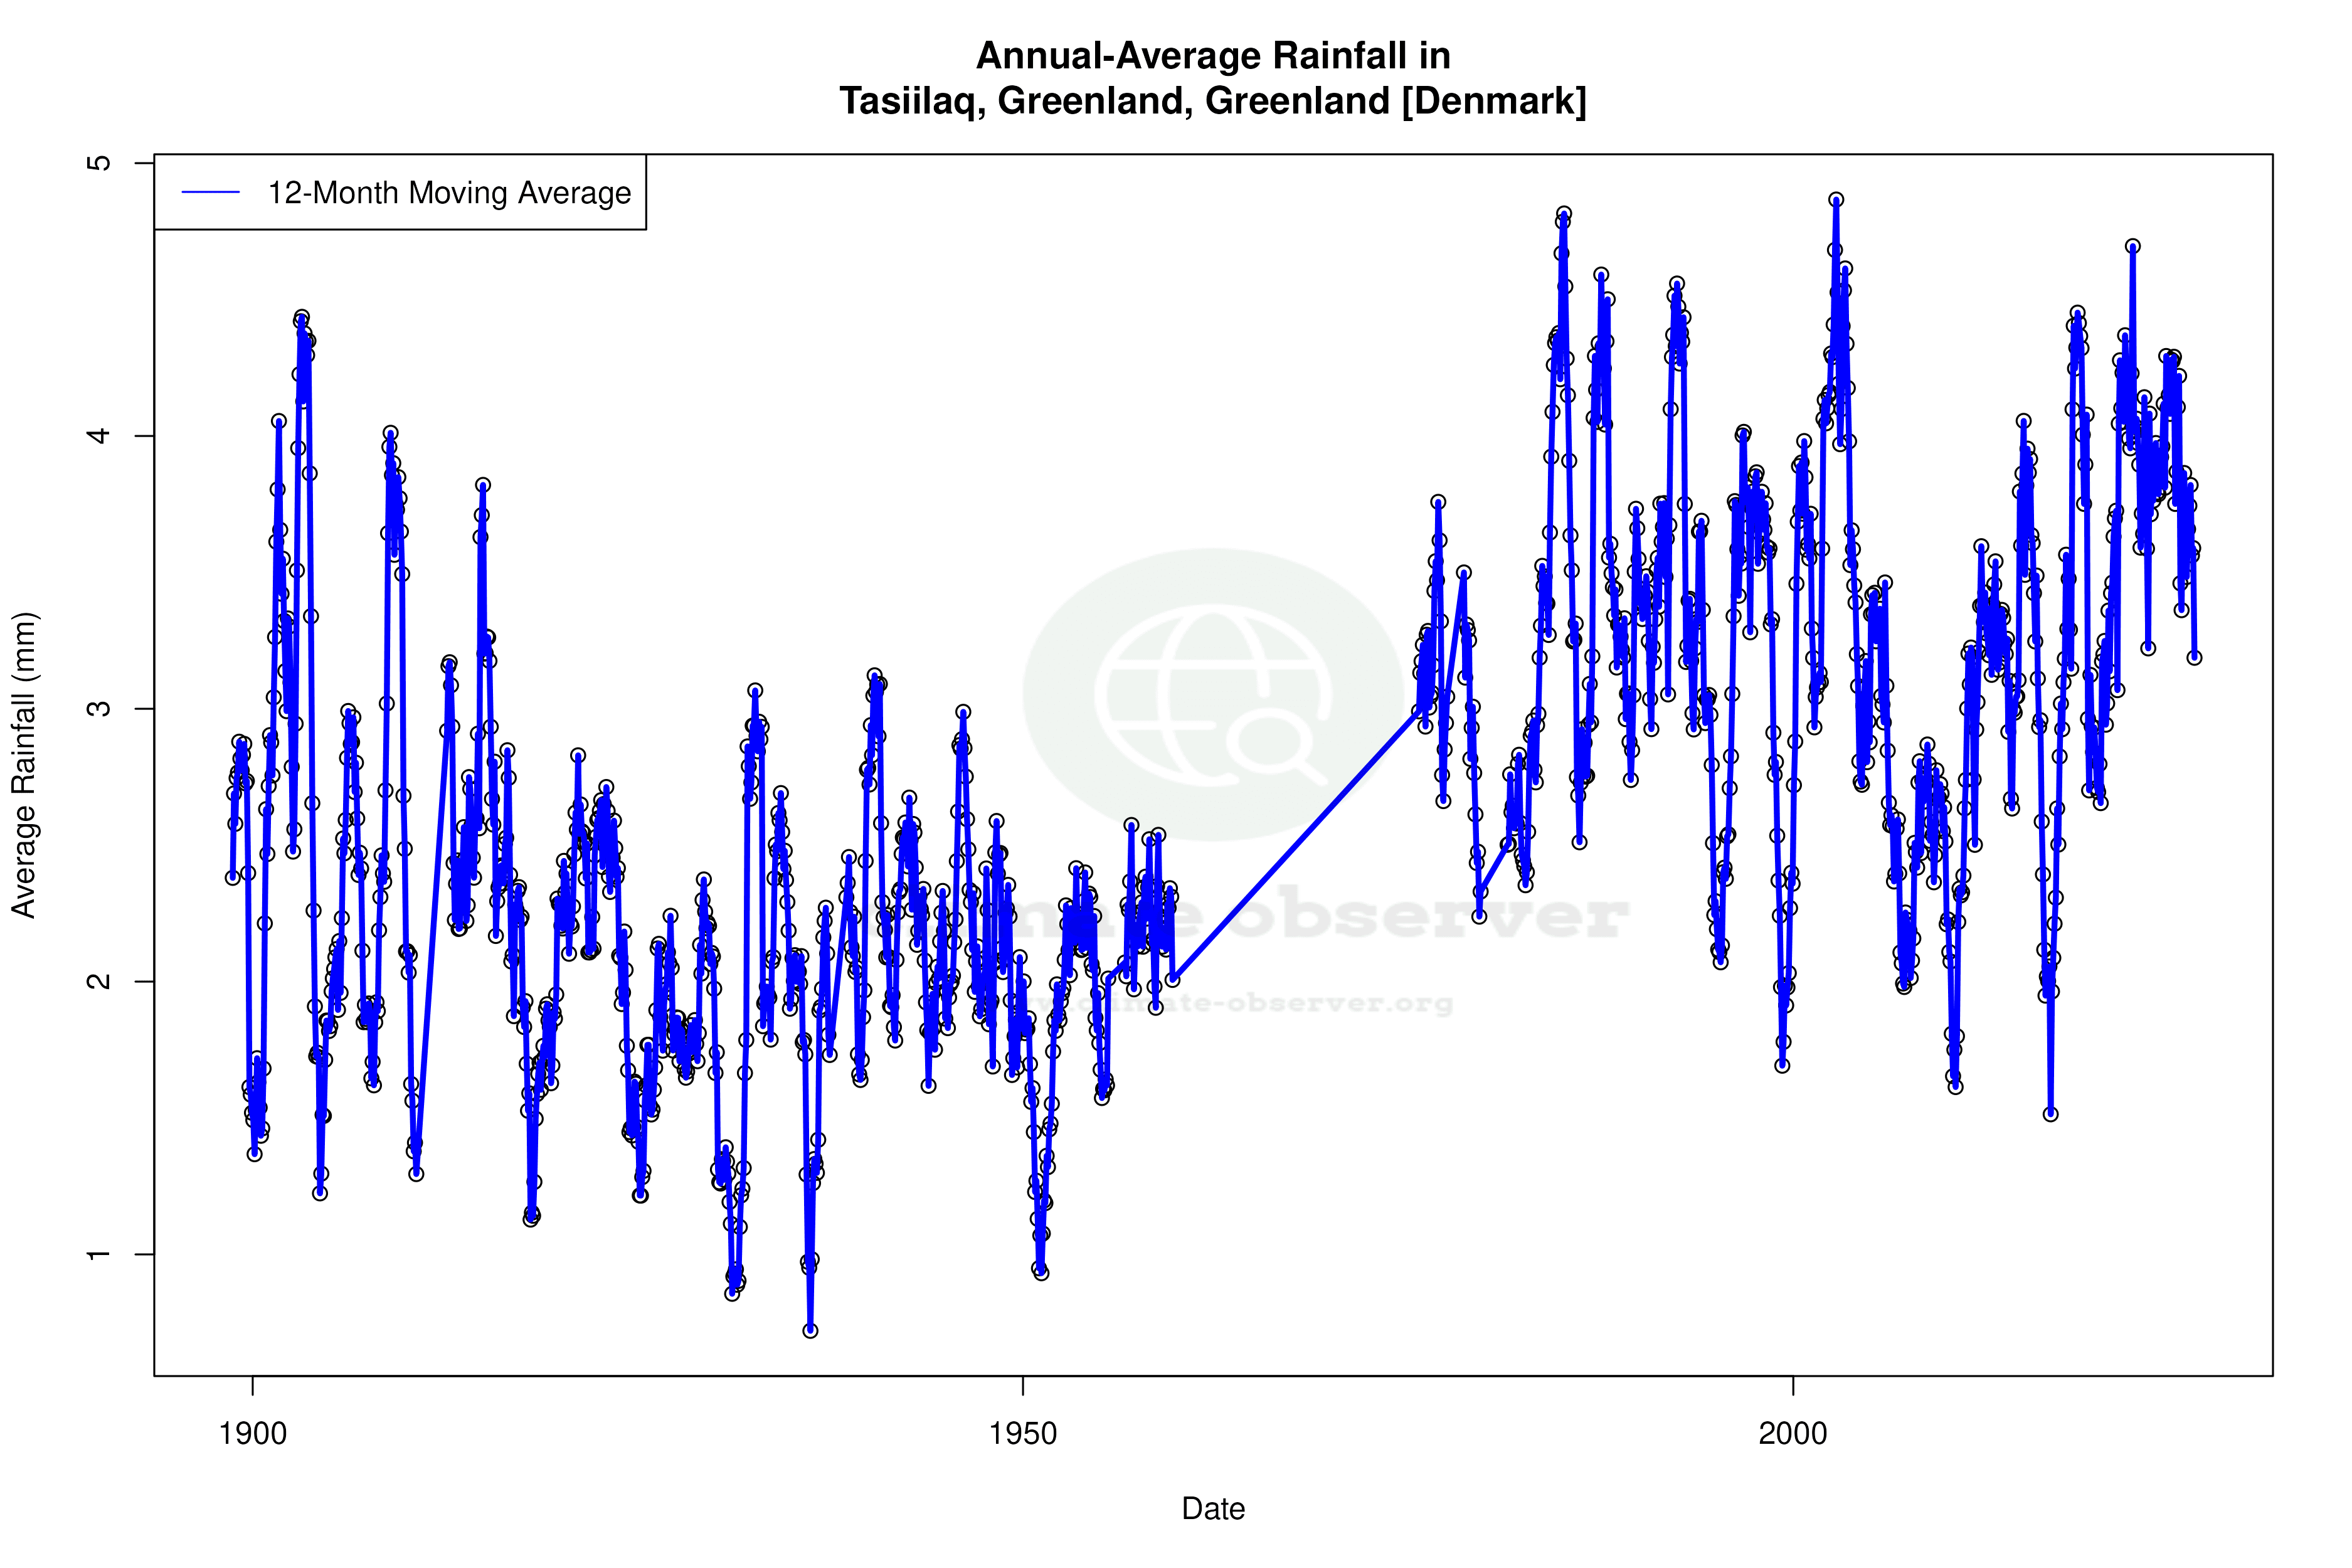
Precipitation Patterns: Even Distribution
The Precipitation Concentration Index (PCI) for Tasiilaq has decreased from a baseline of 11.4 to a current value of 9.7. This suggests that precipitation is now more evenly distributed throughout the year, rather than concentrated in a few heavy events. This slight change could be indicative of shifts in atmospheric circulation patterns, potentially linked to broader climatic changes in the Arctic region.
Record Extremes: Temperature Benchmarks
Tasiilaq's recorded temperature extremes provide a snapshot of its climatic boundaries. The highest temperature ever recorded is 25.3°C (77.5°F), while the lowest is a frigid -32.0°C (-25.6°F). These extremes highlight the region's capacity for significant temperature variation, a characteristic feature of its Tundra climate.
Regional Climate Goals and Implications
Greenland [Denmark] has been actively pursuing climate goals aimed at understanding and mitigating the impacts of climate change. The subtle cooling trend observed in Tasiilaq may inform these efforts, as it contrasts with the global warming narrative seen in many other parts of the world. Recent weather events, such as unusual storm patterns or shifts in sea ice extent, may also be influencing local climatic conditions, providing valuable data for ongoing research and policy development.
Station Statistics
10-Year Trend
High: -0.72 °C/decade
Low: -0.55 °C/decade
Rain: +0.89 mm/decade
25-Year Trend
High: -0.32 °C/decade
Low: -0.08 °C/decade
Rain: +0.26 mm/decade
50-Year Trend
High: +0.34 °C/decade
Low: +0.56 °C/decade
Rain: +0.03 mm/decade
All-Time Trend
High: -0.03 °C/decade
Low: +0.21 °C/decade
Rain: +0.11 mm/decade
Percentage Above-Average Days
Last 12 Months: 47.7%
This Year: 35.5%
Precipitation Concentration Index (PCI) ℹ️
Last 12 Months: 10.9
Historical Average: 11.9
Percentile Rank of Last 12 Months ℹ️
High: 63rd percentile
Low: 98th percentile
Rain: 78th percentile
Change in Variance ℹ️
High: -16.1%
Low: -28.0%
Intraday: -48.7%
Data Coverage
79.6%
First Year of Data
1894
Station Location
Historical Weather Records
| Max High | Avg High | Min High | Max Avg | Avg Avg | Min Avg | Max Low | Avg Low | Min Low | Max Precipitation | Avg Precipitation | Max Snow | Avg Snow | |
|---|---|---|---|---|---|---|---|---|---|---|---|---|---|
| Record | 25.3 °C | — | -24.2 °C | 18.1 °C | — | -24.7 °C | 14.4 °C | — | -32.0 °C | 125.5 mm | — | — | — |
| January | 13.5 °C | -3.7 °C | -21.6 °C | 4.8 °C | -6.5 °C | -23.6 °C | 4.0 °C | -10.5 °C | -30.3 °C | 86.8 mm | 3.2 mm | — | — |
| February | 15.2 °C | -3.9 °C | -24.2 °C | 4.6 °C | -6.7 °C | -24.7 °C | 5.0 °C | -11.2 °C | -30.7 °C | 83.6 mm | 3.5 mm | — | — |
| March | 15.1 °C | -2.4 °C | -21.2 °C | 9.9 °C | -6.5 °C | -22.0 °C | 5.0 °C | -10.5 °C | -32.0 °C | 75.6 mm | 2.9 mm | — | — |
| April | 15.2 °C | 1.5 °C | -14.9 °C | 9.6 °C | -2.8 °C | -17.6 °C | 7.0 °C | -7.0 °C | -25.4 °C | 83.1 mm | 2.4 mm | — | — |
| May | 17.9 °C | 5.5 °C | -5.2 °C | 10.1 °C | 1.0 °C | -9.5 °C | 6.7 °C | -1.9 °C | -15.7 °C | 125.5 mm | 2.1 mm | — | — |
| June | 22.2 °C | 9.1 °C | 0.0 °C | 14.4 °C | 4.4 °C | -1.7 °C | 11.6 °C | 1.3 °C | -8.6 °C | 49.0 mm | 1.7 mm | — | — |
| July | 25.3 °C | 11.5 °C | 0.0 °C | 18.1 °C | 6.8 °C | 0.4 °C | 14.4 °C | 3.2 °C | -3.7 °C | 58.5 mm | 1.5 mm | — | — |
| August | 23.6 °C | 10.7 °C | 1.8 °C | 13.9 °C | 6.6 °C | 0.3 °C | 10.8 °C | 3.1 °C | -5.7 °C | 81.5 mm | 2.0 mm | — | — |
| September | 21.2 °C | 7.0 °C | -1.5 °C | 14.9 °C | 3.9 °C | -3.6 °C | 12.0 °C | 1.0 °C | -7.6 °C | 81.9 mm | 3.2 mm | — | — |
| October | 14.9 °C | 2.3 °C | -8.9 °C | 10.3 °C | -0.1 °C | -10.6 °C | 9.1 °C | -2.9 °C | -18.3 °C | 100.0 mm | 3.4 mm | — | — |
| November | 14.2 °C | -1.0 °C | -18.0 °C | 10.5 °C | -3.1 °C | -16.6 °C | 6.5 °C | -6.6 °C | -25.2 °C | 82.0 mm | 3.2 mm | — | — |
| December | 12.6 °C | -3.0 °C | -18.3 °C | 6.4 °C | -5.7 °C | -20.2 °C | 5.1 °C | -9.2 °C | -29.4 °C | 92.9 mm | 2.9 mm | — | — |
Data Visualisations
Remove WatermarksCurrent Year Climate Trends vs Historical


Max Temperature this Year | 1 of 6
Climate 12-Month Moving Averages


Max Temperature 12-Month MA | 1 of 6
Daily Data Points and Averages Throughout the Year


Average Max Temperature Throughout Year | 1 of 5
