Climate for Station: Bremen-Seefahrtschule, Bremen, Germany
Loading live weather...
Climate Analysis & Overview
Bremen-Seefahrtschule is experiencing a noticeable warming trend, with significant increases in both high and low temperatures over the past decade. The climate is becoming more stable in terms of precipitation distribution, reflecting a shift towards more evenly spread rainfall events.
Maritime Influence and Climate Classification
Bremen-Seefahrtschule, located at 53.1017°N, 8.7842°E, sits within the temperate maritime climate zone, classified as Cfb according to the Köppen system. This classification is characterised by mild winters, cool summers, and a relatively even distribution of precipitation throughout the year. The nearby North Sea plays a crucial role in moderating temperatures, preventing extreme highs and lows, which is evident in the station's all-time temperature records: a maximum of 37.6°C (99.7°F) and a minimum of -23.6°C (-10.5°F).
Decadal Warming Trends
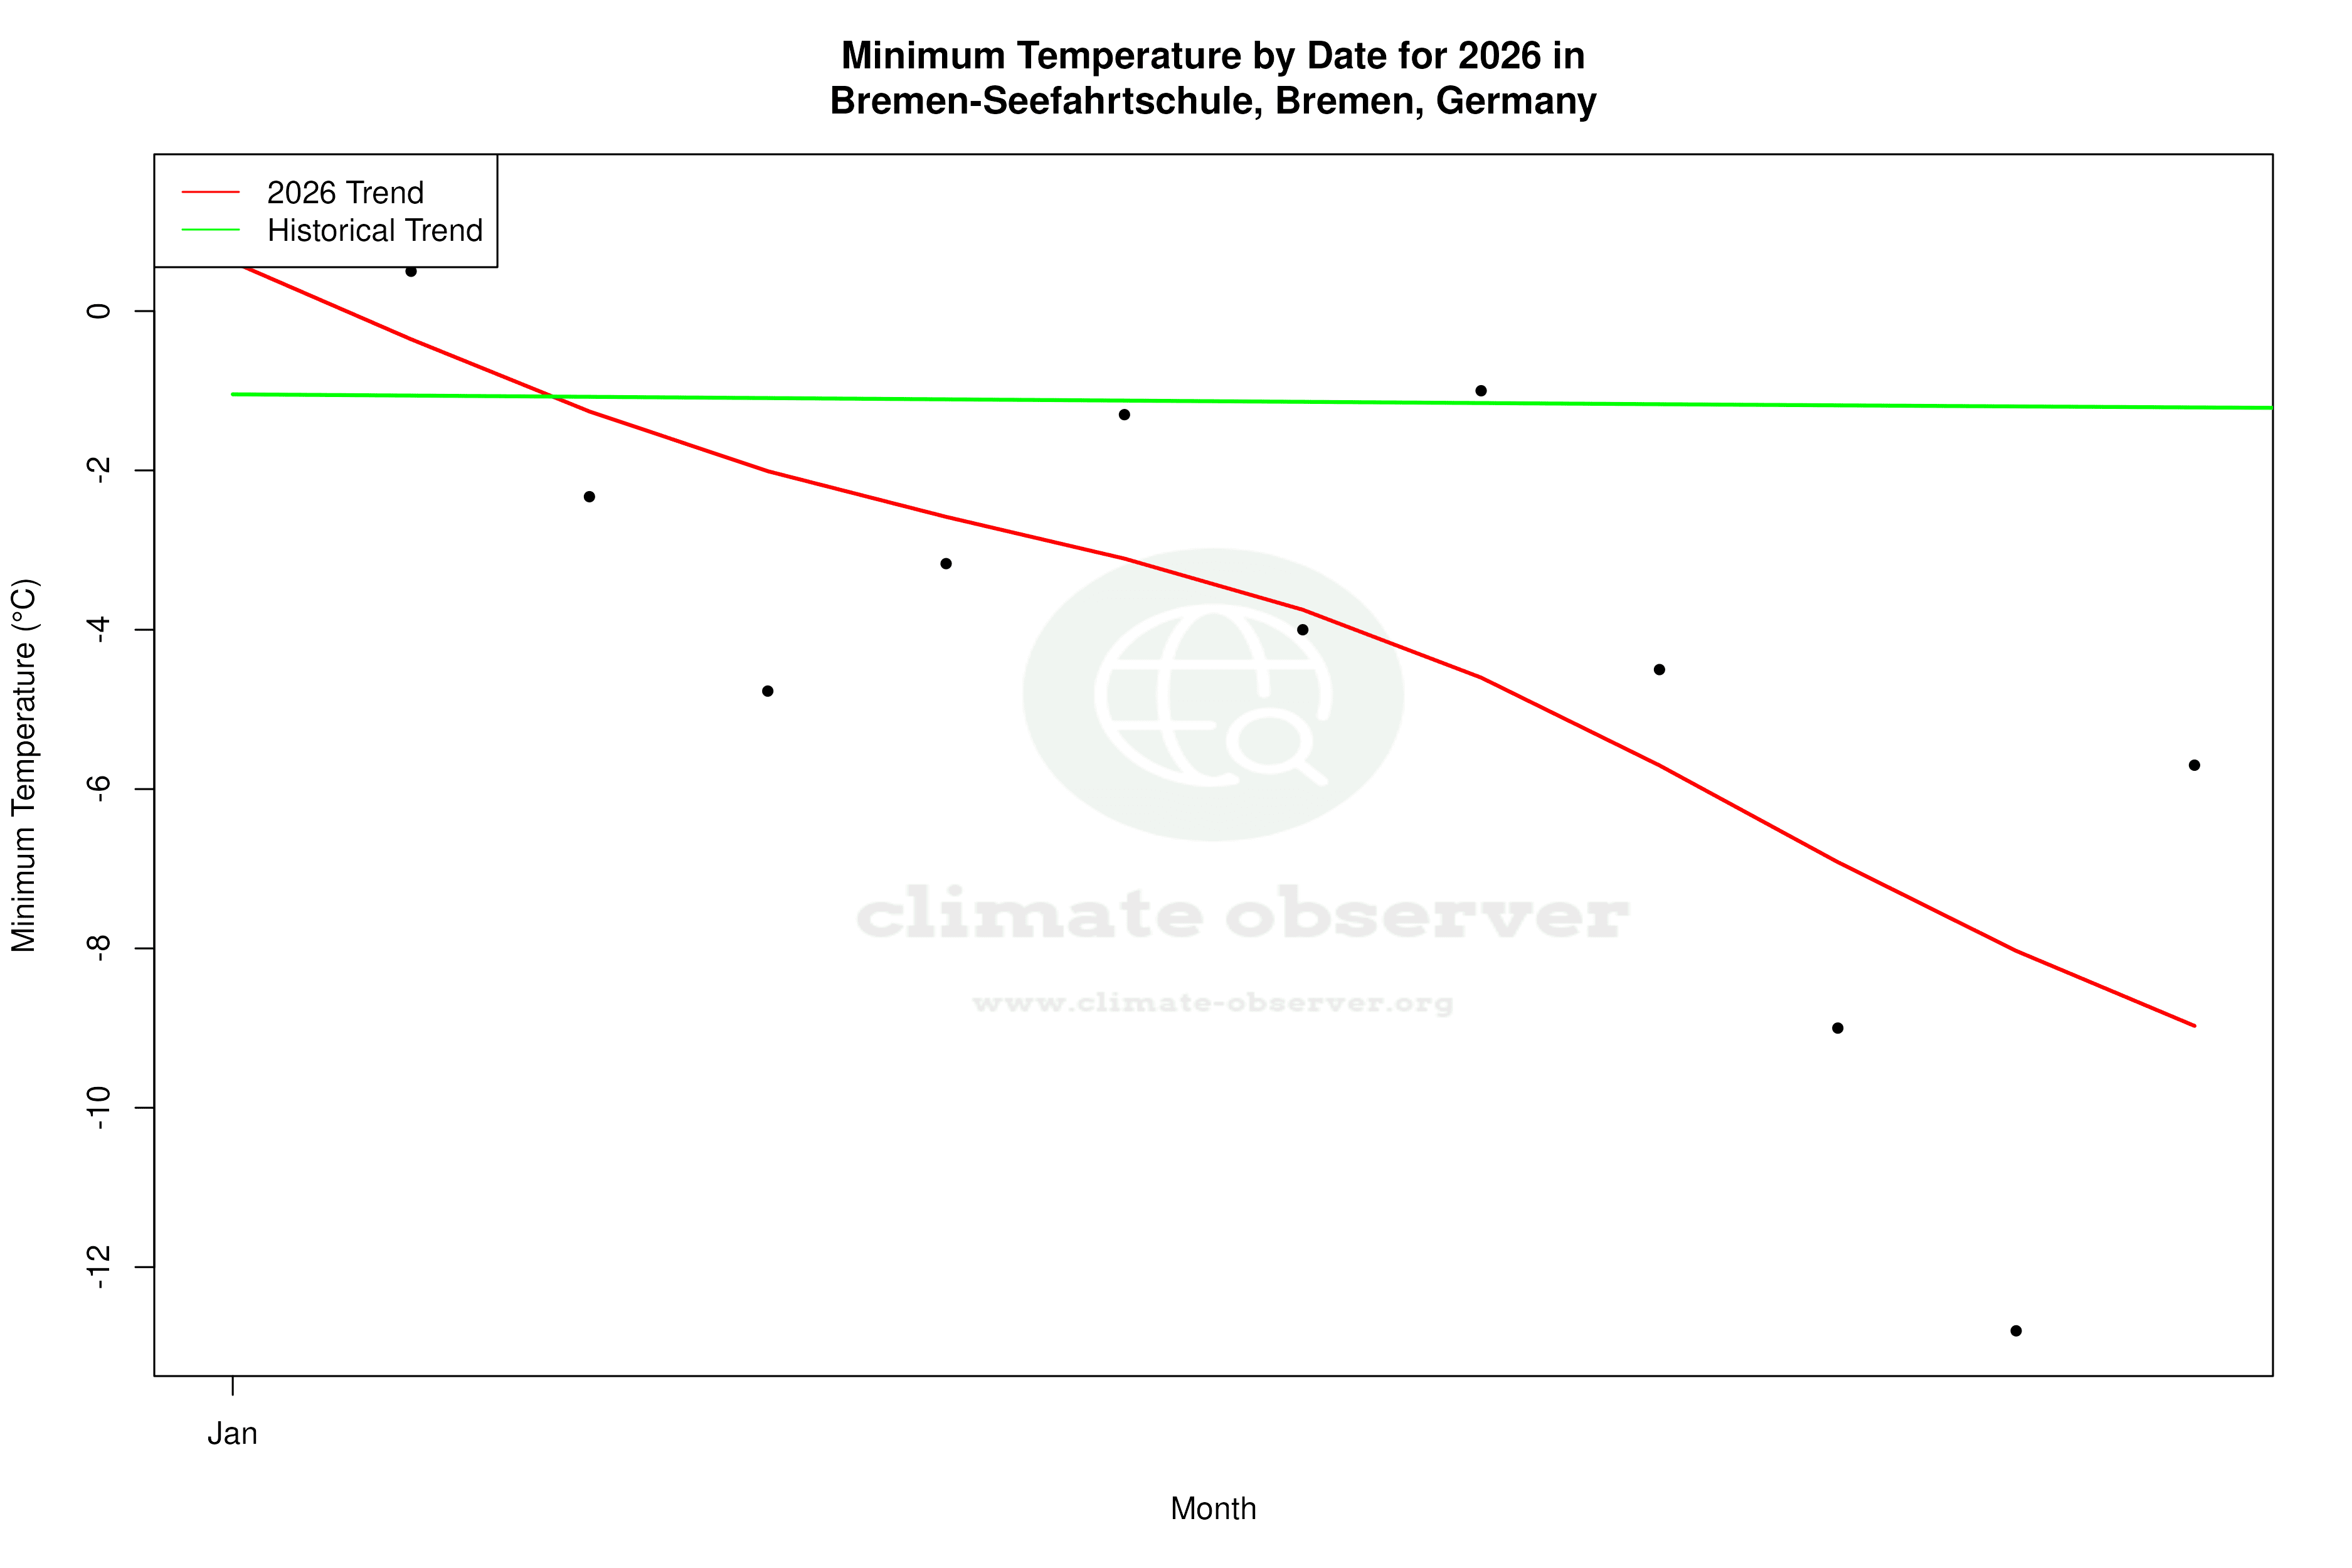
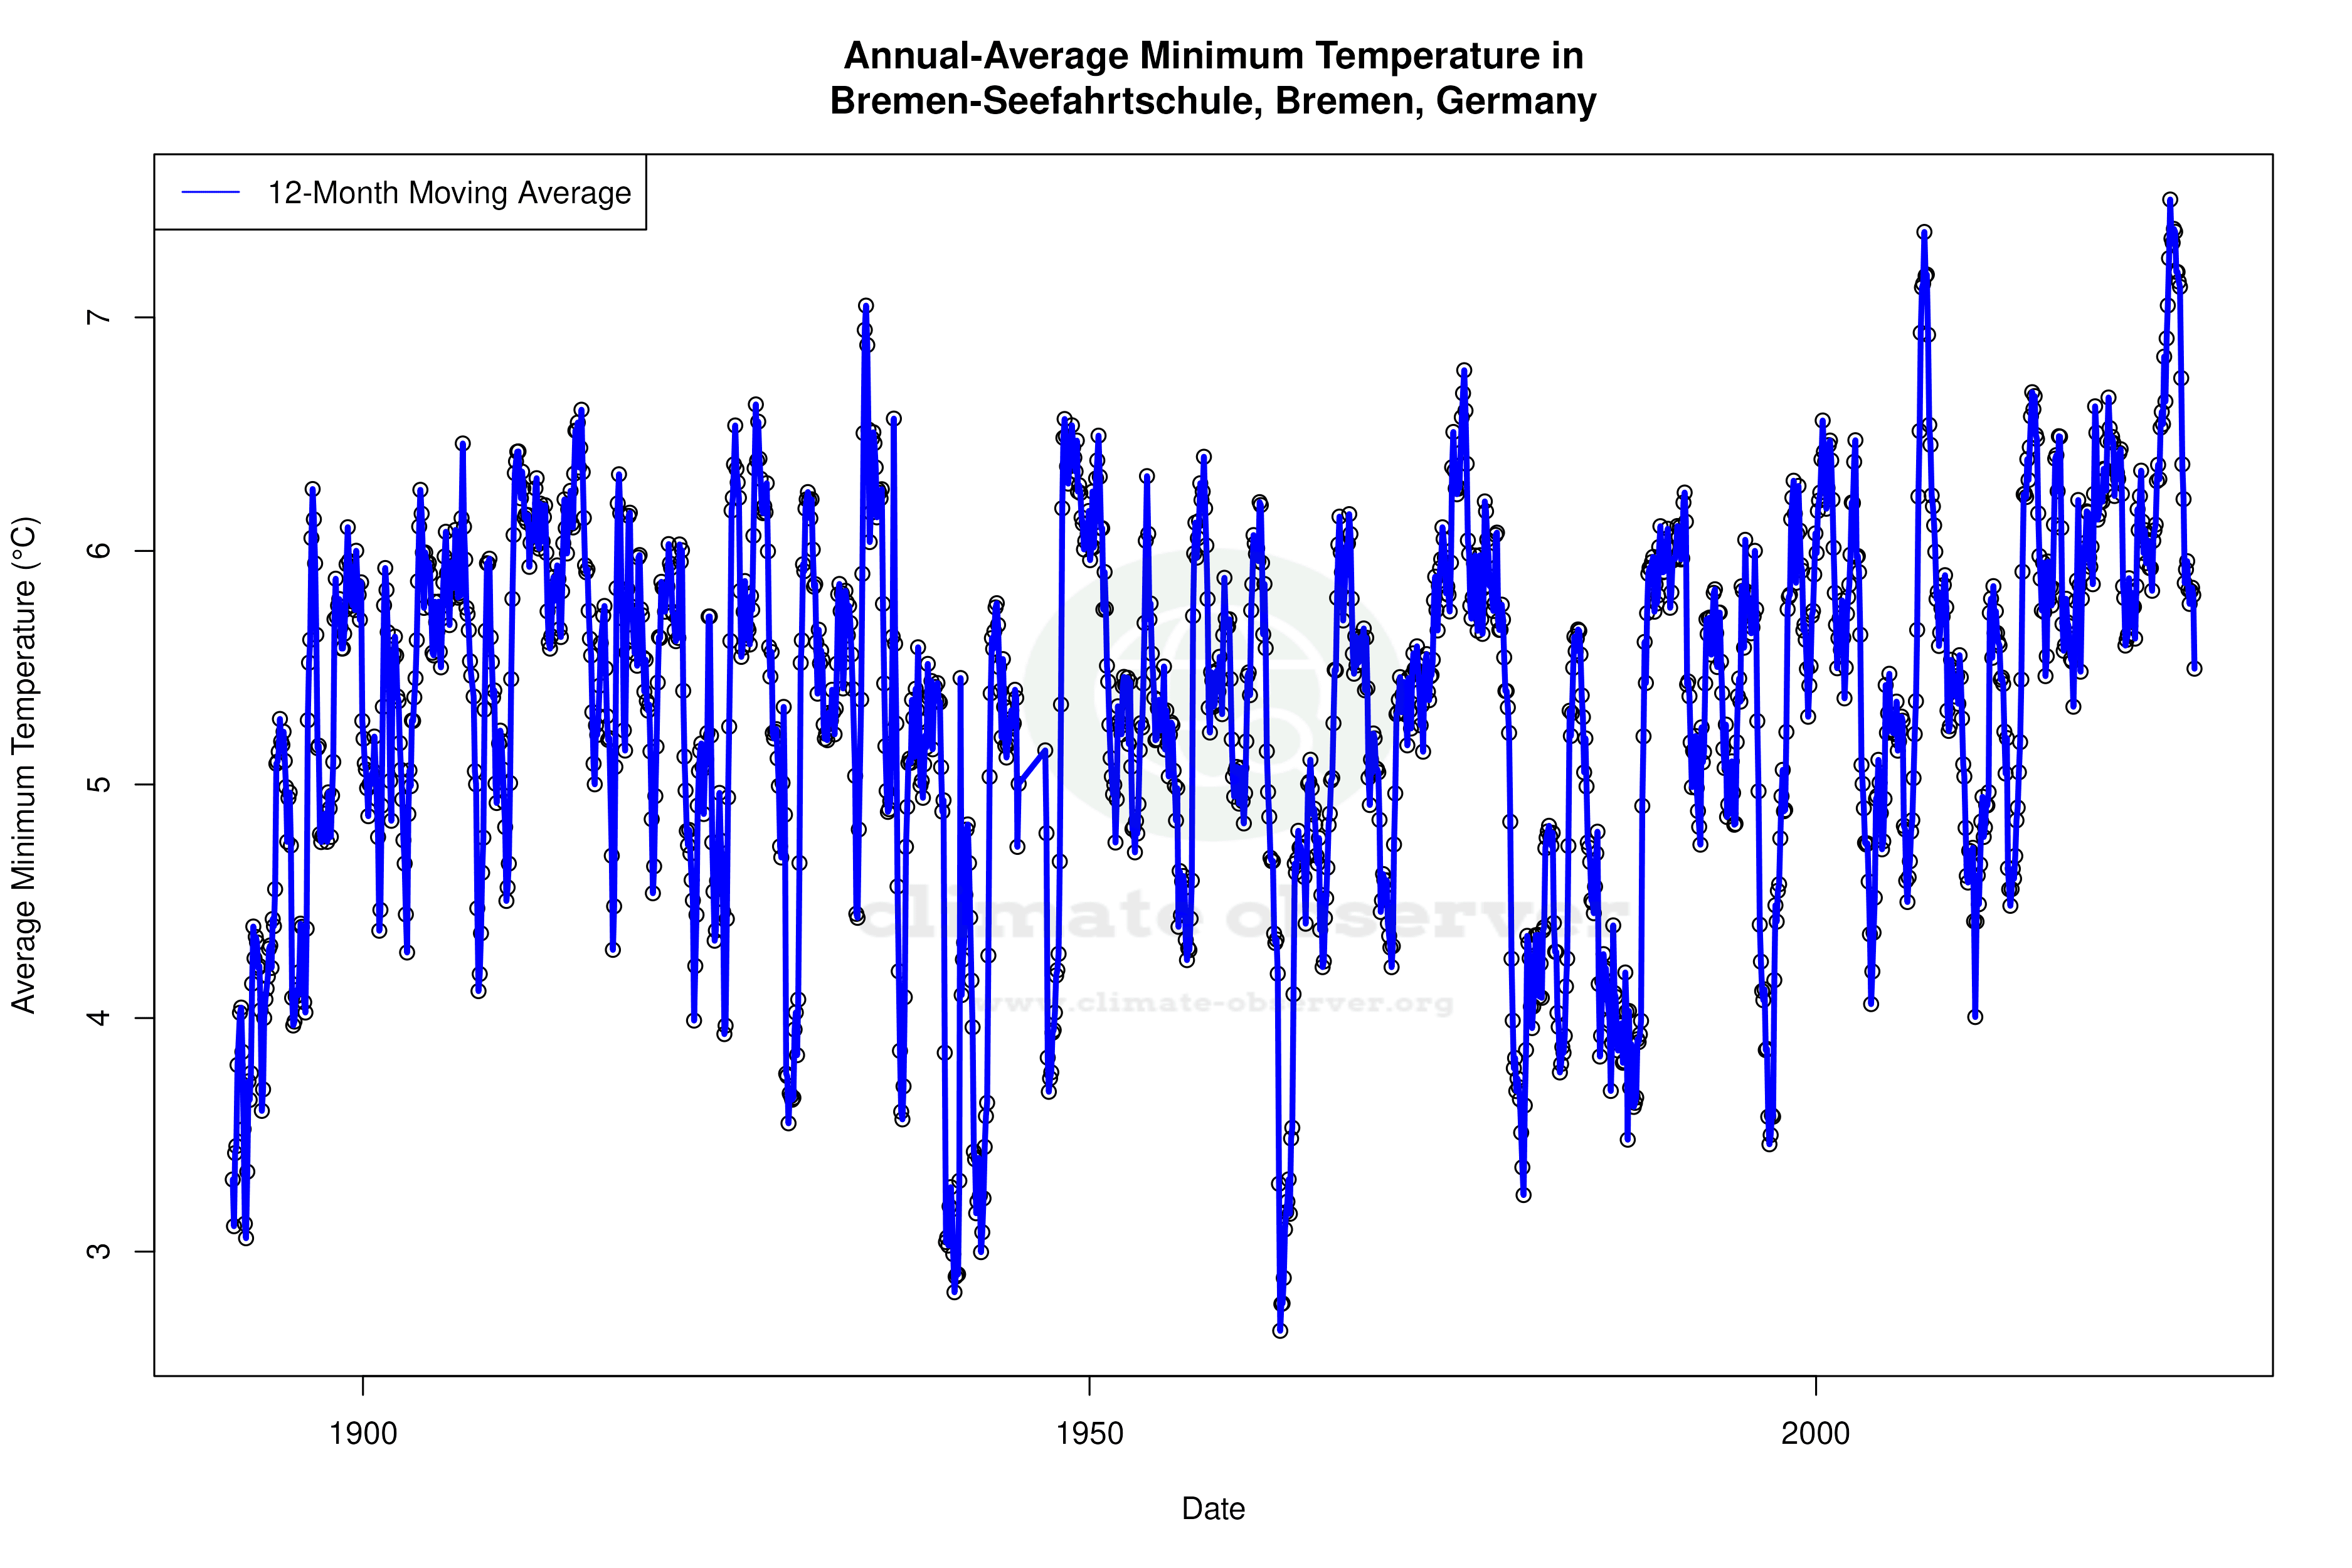
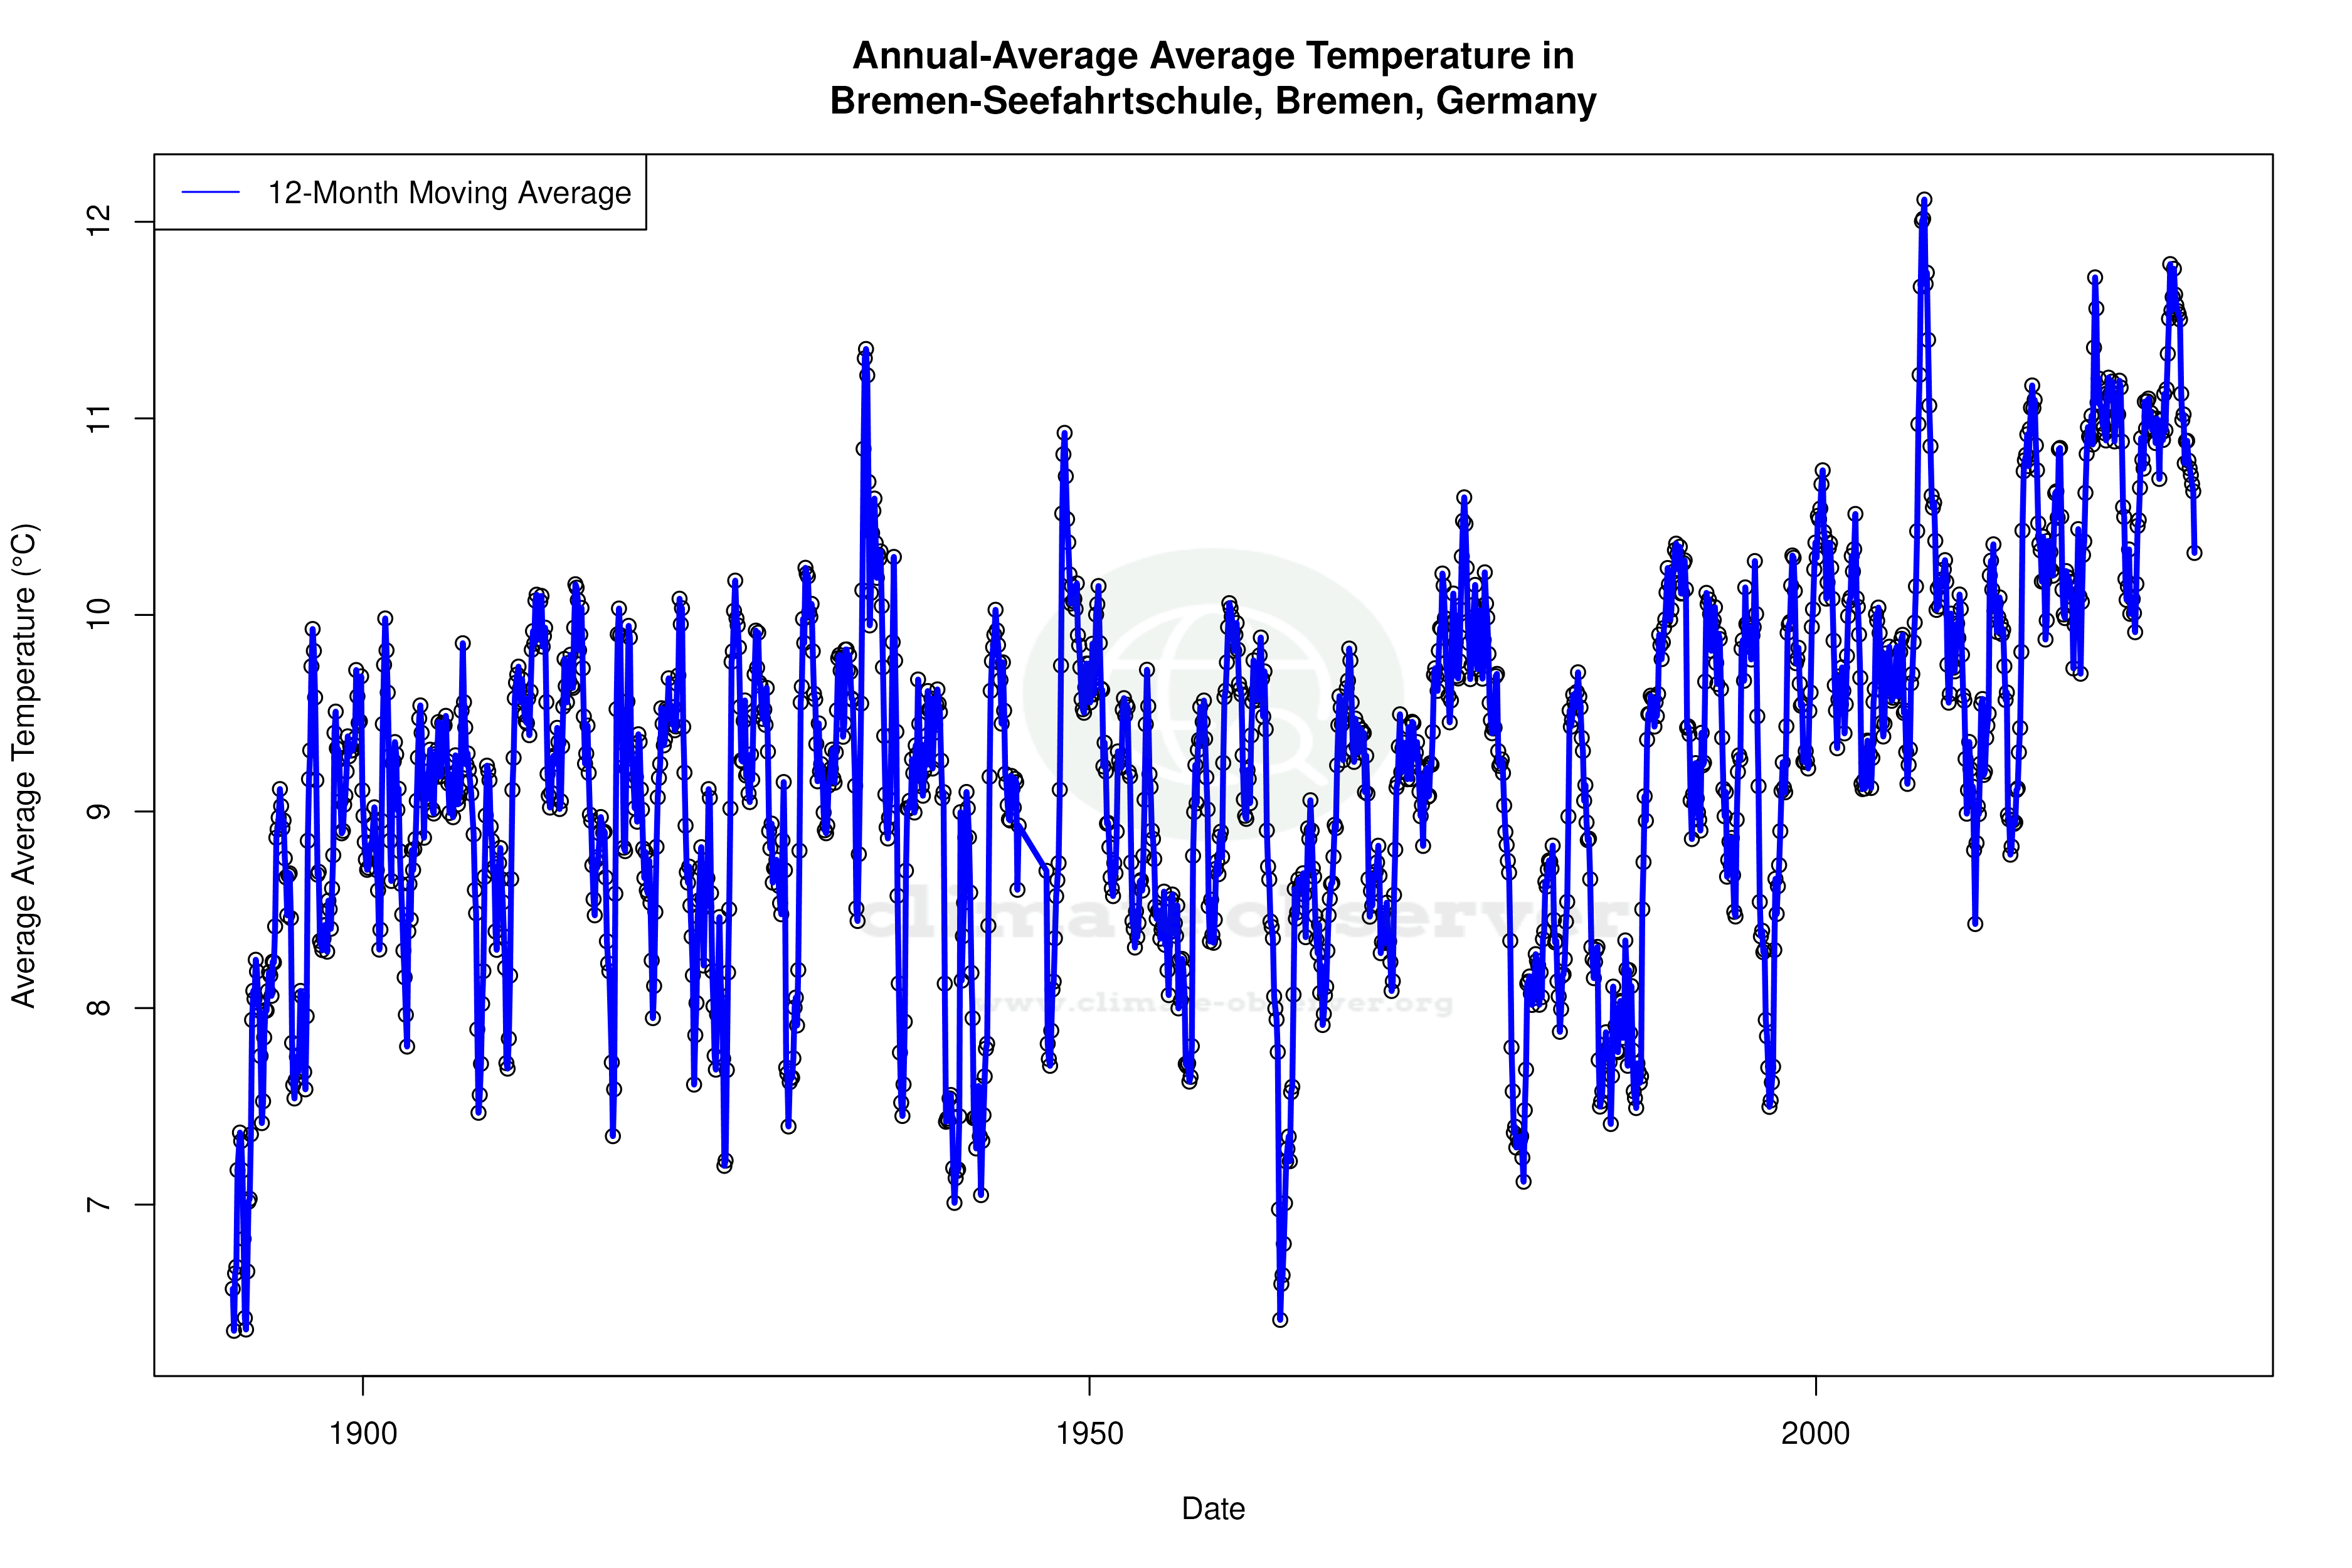
Over the past decade, Bremen-Seefahrtschule has experienced a significant warming trend. The average high temperatures have increased by 0.75°C (1.35°F), while the lows have risen by 0.56°C (1.01°F). This warming is more pronounced than the all-time trends, which show a more modest increase of 0.18°C (0.32°F) for highs and 0.03°C (0.05°F) for lows. This recent acceleration in warming could be attributed to regional climate changes and is a crucial consideration for local climate adaptation strategies.
Precipitation Patterns and Distribution
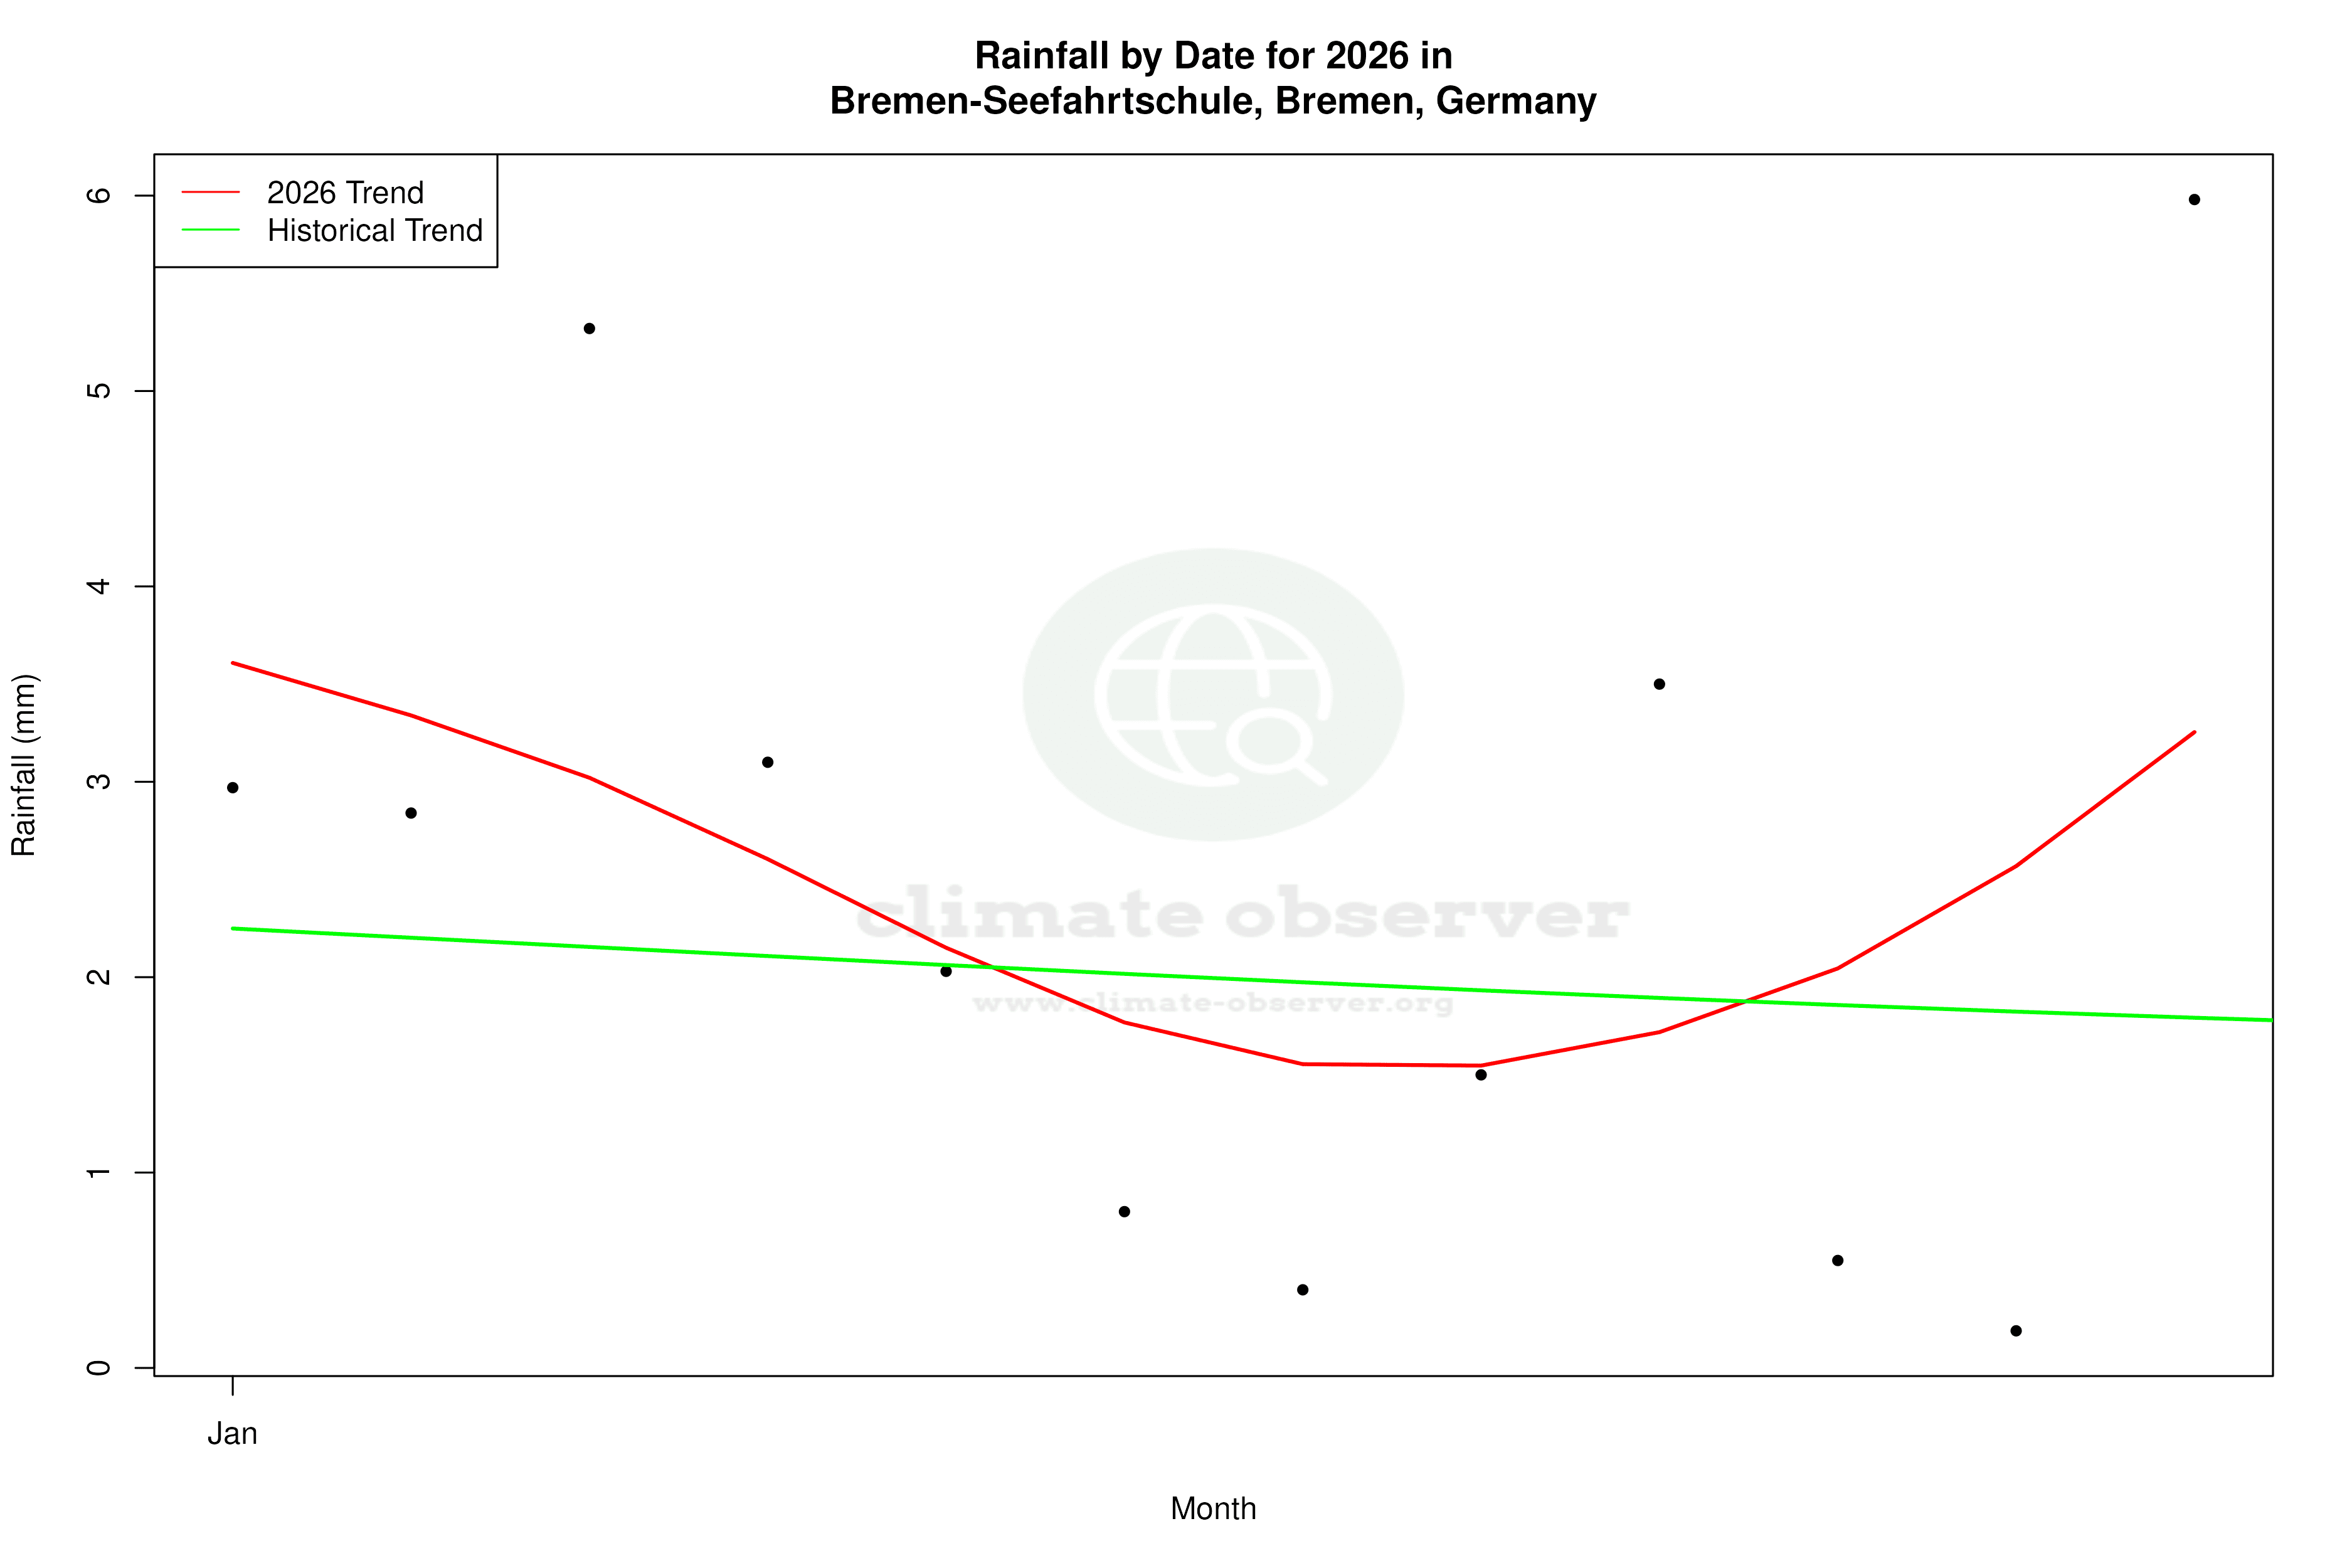
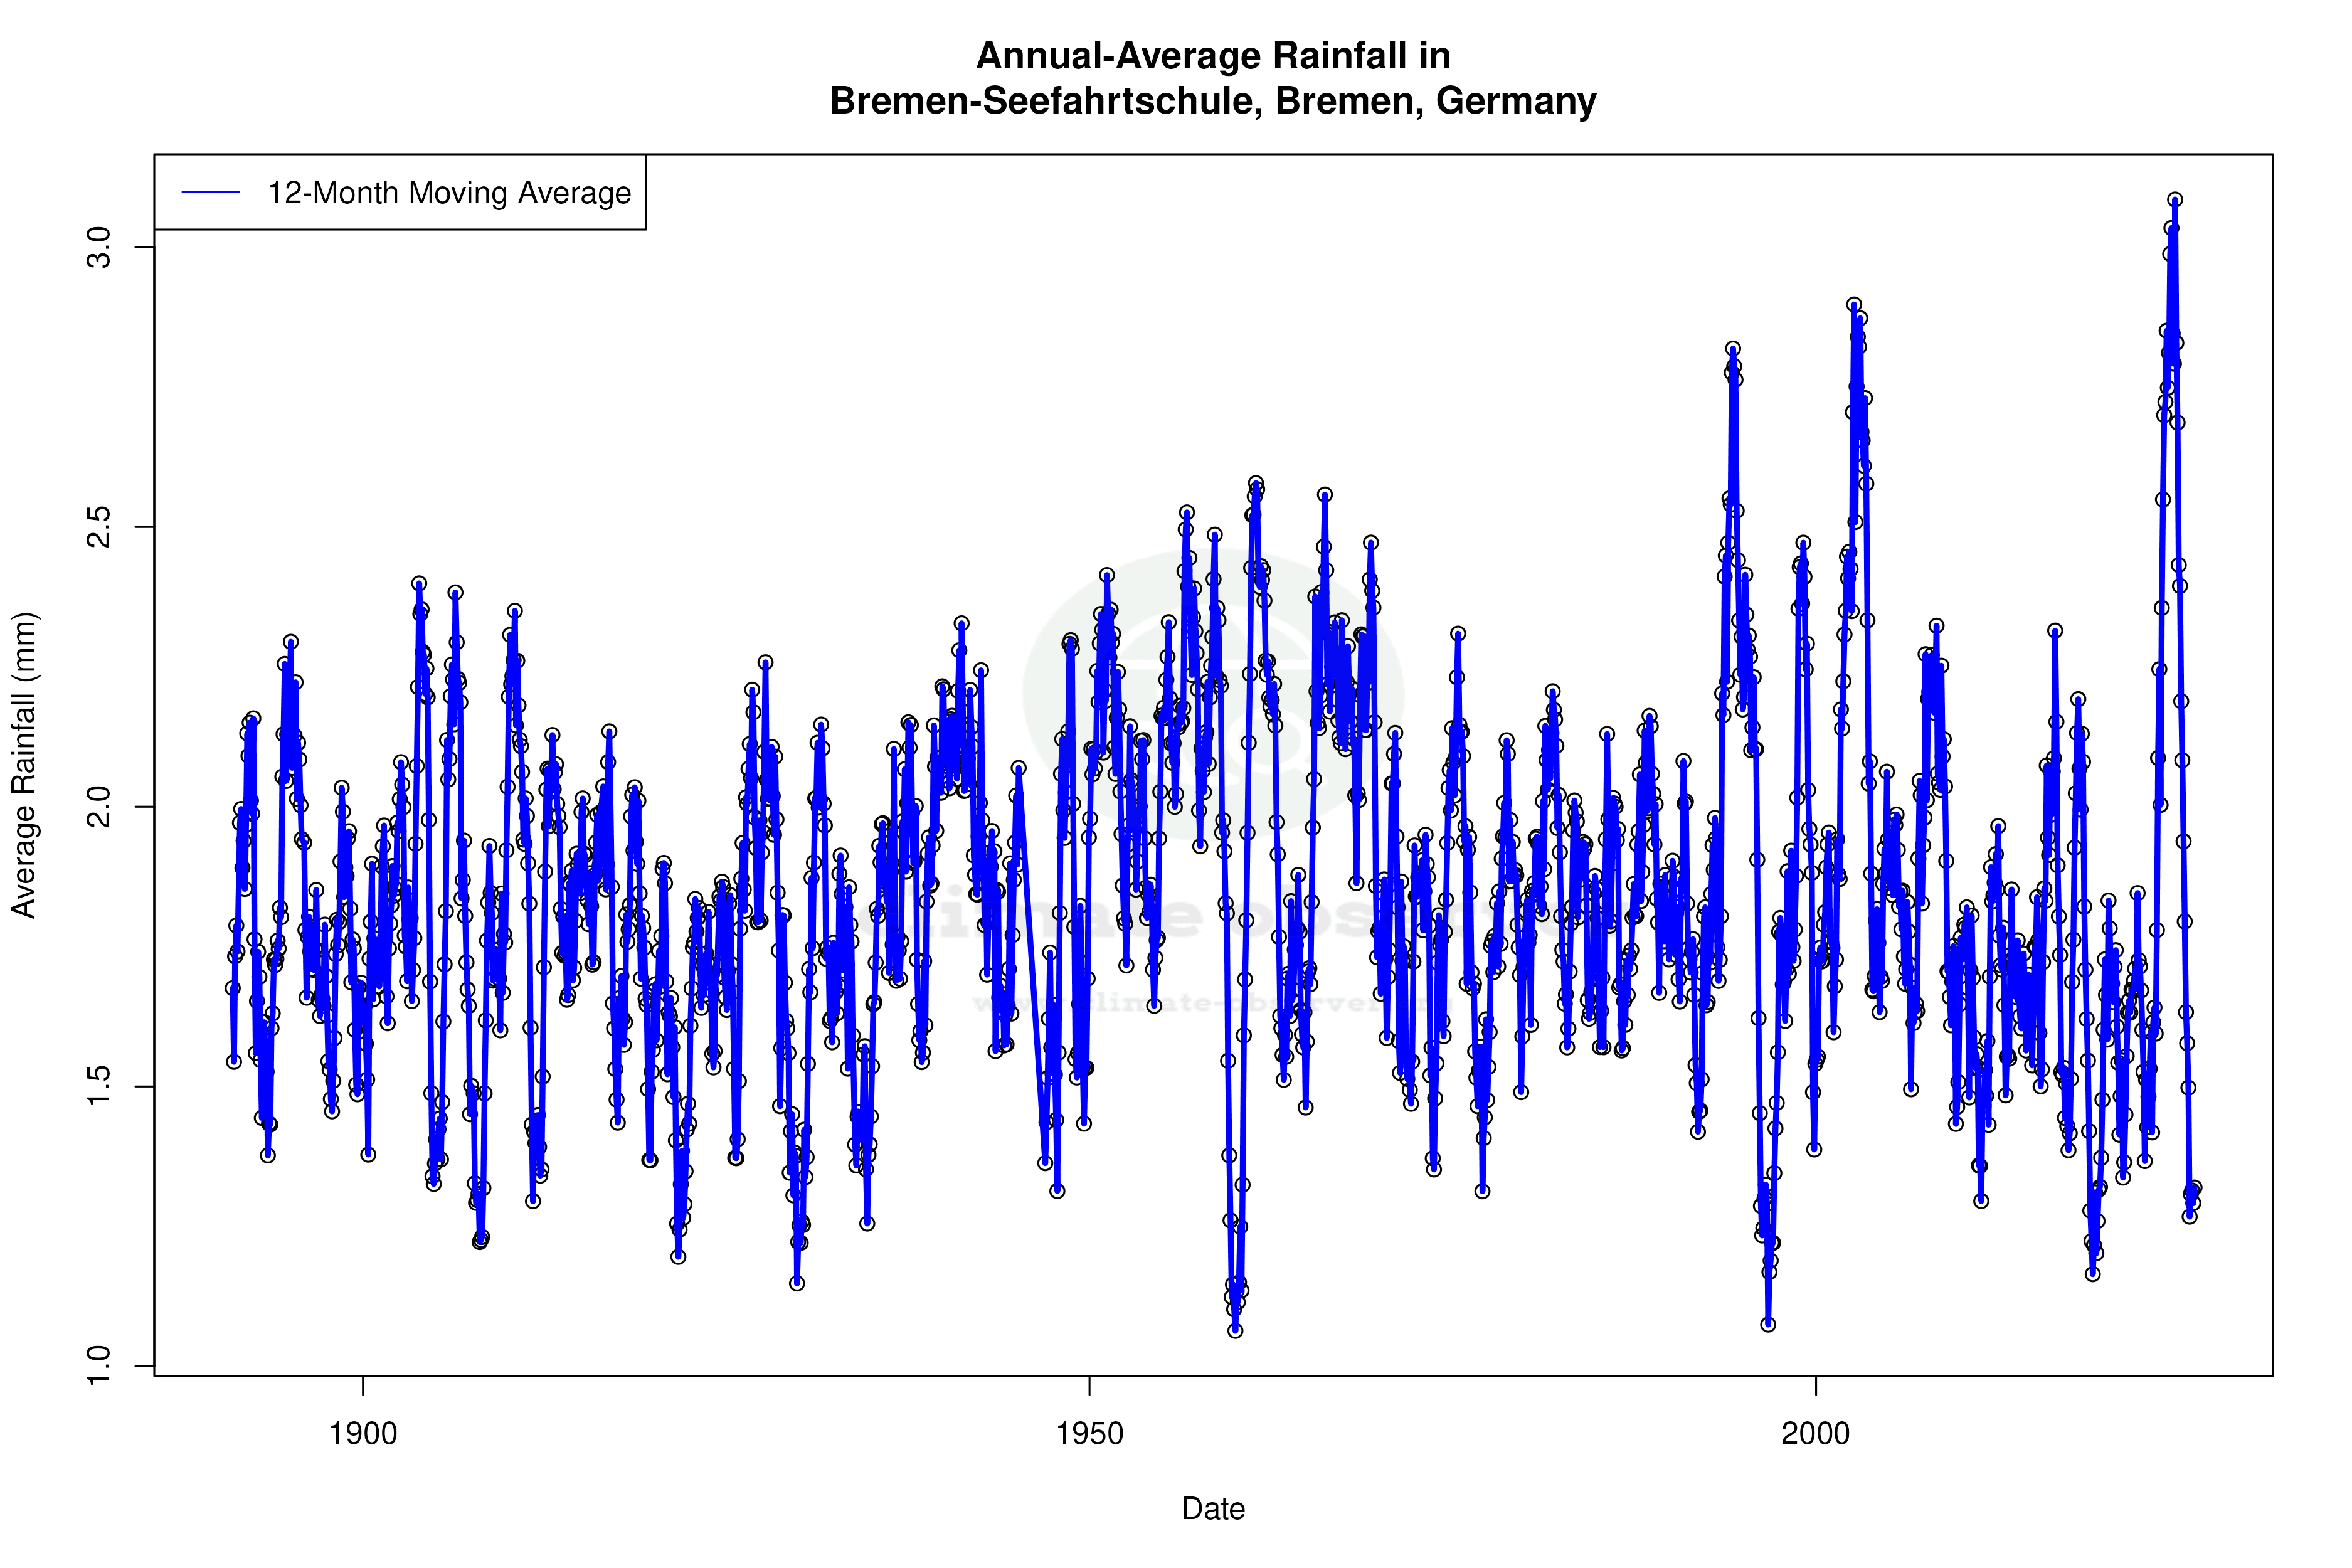
The Precipitation Concentration Index (PCI) at Bremen-Seefahrtschule has decreased from a baseline of 10.93 to a current value of 10.02. This indicates a trend towards a more even distribution of rainfall events, as a lower PCI suggests less concentration of precipitation in fewer events. While this change is not drastic, it points to a slight shift towards more predictable and evenly spread rainfall, which can have implications for agriculture and water management in the region.
Regional Climate Goals and Implications
Germany has been proactive in setting ambitious climate goals, aiming to reduce greenhouse gas emissions and enhance renewable energy use. The warming trends observed at Bremen-Seefahrtschule underscore the importance of these initiatives. As temperatures continue to rise, adaptation measures, such as improving infrastructure resilience and enhancing energy efficiency, become increasingly vital. The more stable precipitation patterns could offer some relief, but the overall warming trend remains a critical challenge.
Conclusion of Data Insights
The climate data from Bremen-Seefahrtschule highlights a clear warming trend, with significant implications for the region's climate resilience and adaptation strategies. The slight improvement in precipitation distribution offers a silver lining, but the overarching narrative is one of rising temperatures, consistent with broader regional and global climate trends.
Station Statistics
10-Year Trend
High: +0.53 °C/decade
Low: +0.46 °C/decade
Rain: +0.43 mm/decade
25-Year Trend
High: +0.68 °C/decade
Low: +0.49 °C/decade
Rain: -0.12 mm/decade
50-Year Trend
High: +0.53 °C/decade
Low: +0.31 °C/decade
Rain: -0.01 mm/decade
All-Time Trend
High: +0.18 °C/decade
Low: +0.03 °C/decade
Rain: +0.00 mm/decade
Percentage Above-Average Days
Last 12 Months: 58.9%
This Year: 54.5%
Precipitation Concentration Index (PCI) ℹ️
Last 12 Months: 10.1
Historical Average: 10.8
Percentile Rank of Last 12 Months ℹ️
High: 94th percentile
Low: 67th percentile
Rain: 7th percentile
Change in Variance ℹ️
High: -0.9%
Low: -11.7%
Intraday: +20.2%
Data Coverage
99.4%
First Year of Data
1890
Station Location
Historical Weather Records
| Max High | Avg High | Min High | Max Avg | Avg Avg | Min Avg | Max Low | Avg Low | Min Low | Max Precipitation | Avg Precipitation | Max Snow | Avg Snow | |
|---|---|---|---|---|---|---|---|---|---|---|---|---|---|
| Record | 37.6 °C | — | -14.3 °C | 29.9 °C | — | -17.3 °C | 23.8 °C | — | -23.6 °C | 78.5 mm | — | — | — |
| January | 16.1 °C | 3.5 °C | -14.3 °C | 12.9 °C | 1.3 °C | -16.8 °C | 11.0 °C | -1.2 °C | -21.8 °C | 41.2 mm | 1.7 mm | — | — |
| February | 18.5 °C | 4.6 °C | -12.9 °C | 13.2 °C | 1.8 °C | -17.3 °C | 12.0 °C | -1.1 °C | -23.6 °C | 33.2 mm | 1.5 mm | — | — |
| March | 23.6 °C | 8.3 °C | -5.5 °C | 15.9 °C | 4.5 °C | -11.9 °C | 11.0 °C | 0.9 °C | -17.7 °C | 30.7 mm | 1.4 mm | — | — |
| April | 30.2 °C | 12.9 °C | 0.2 °C | 21.4 °C | 8.3 °C | -2.6 °C | 14.2 °C | 3.6 °C | -7.6 °C | 36.6 mm | 1.5 mm | — | — |
| May | 34.4 °C | 17.7 °C | 4.8 °C | 25.6 °C | 12.8 °C | 2.5 °C | 18.8 °C | 7.5 °C | -3.5 °C | 45.4 mm | 1.8 mm | — | — |
| June | 35.4 °C | 20.7 °C | 9.7 °C | 29.0 °C | 15.9 °C | 7.8 °C | 23.8 °C | 10.7 °C | 0.5 °C | 52.6 mm | 2.1 mm | — | — |
| July | 37.4 °C | 22.3 °C | 12.2 °C | 29.9 °C | 17.5 °C | 10.1 °C | 22.0 °C | 12.7 °C | 3.0 °C | 58.0 mm | 2.5 mm | — | — |
| August | 37.6 °C | 22.0 °C | 13.0 °C | 28.0 °C | 17.2 °C | 9.6 °C | 20.9 °C | 12.4 °C | 3.4 °C | 78.5 mm | 2.3 mm | — | — |
| September | 33.4 °C | 18.6 °C | 9.0 °C | 24.5 °C | 14.0 °C | 6.0 °C | 18.1 °C | 9.7 °C | -1.2 °C | 62.8 mm | 1.9 mm | — | — |
| October | 28.6 °C | 13.4 °C | 1.2 °C | 19.8 °C | 9.7 °C | -1.6 °C | 16.9 °C | 6.2 °C | -7.8 °C | 51.4 mm | 1.8 mm | — | — |
| November | 20.1 °C | 7.8 °C | -9.4 °C | 16.8 °C | 5.2 °C | -10.8 °C | 14.8 °C | 2.5 °C | -14.1 °C | 30.7 mm | 1.8 mm | — | — |
| December | 16.2 °C | 4.6 °C | -11.9 °C | 13.3 °C | 2.5 °C | -14.7 °C | 11.7 °C | 0.1 °C | -17.5 °C | 36.7 mm | 1.8 mm | — | — |
Data Visualisations
Remove WatermarksCurrent Year Climate Trends vs Historical
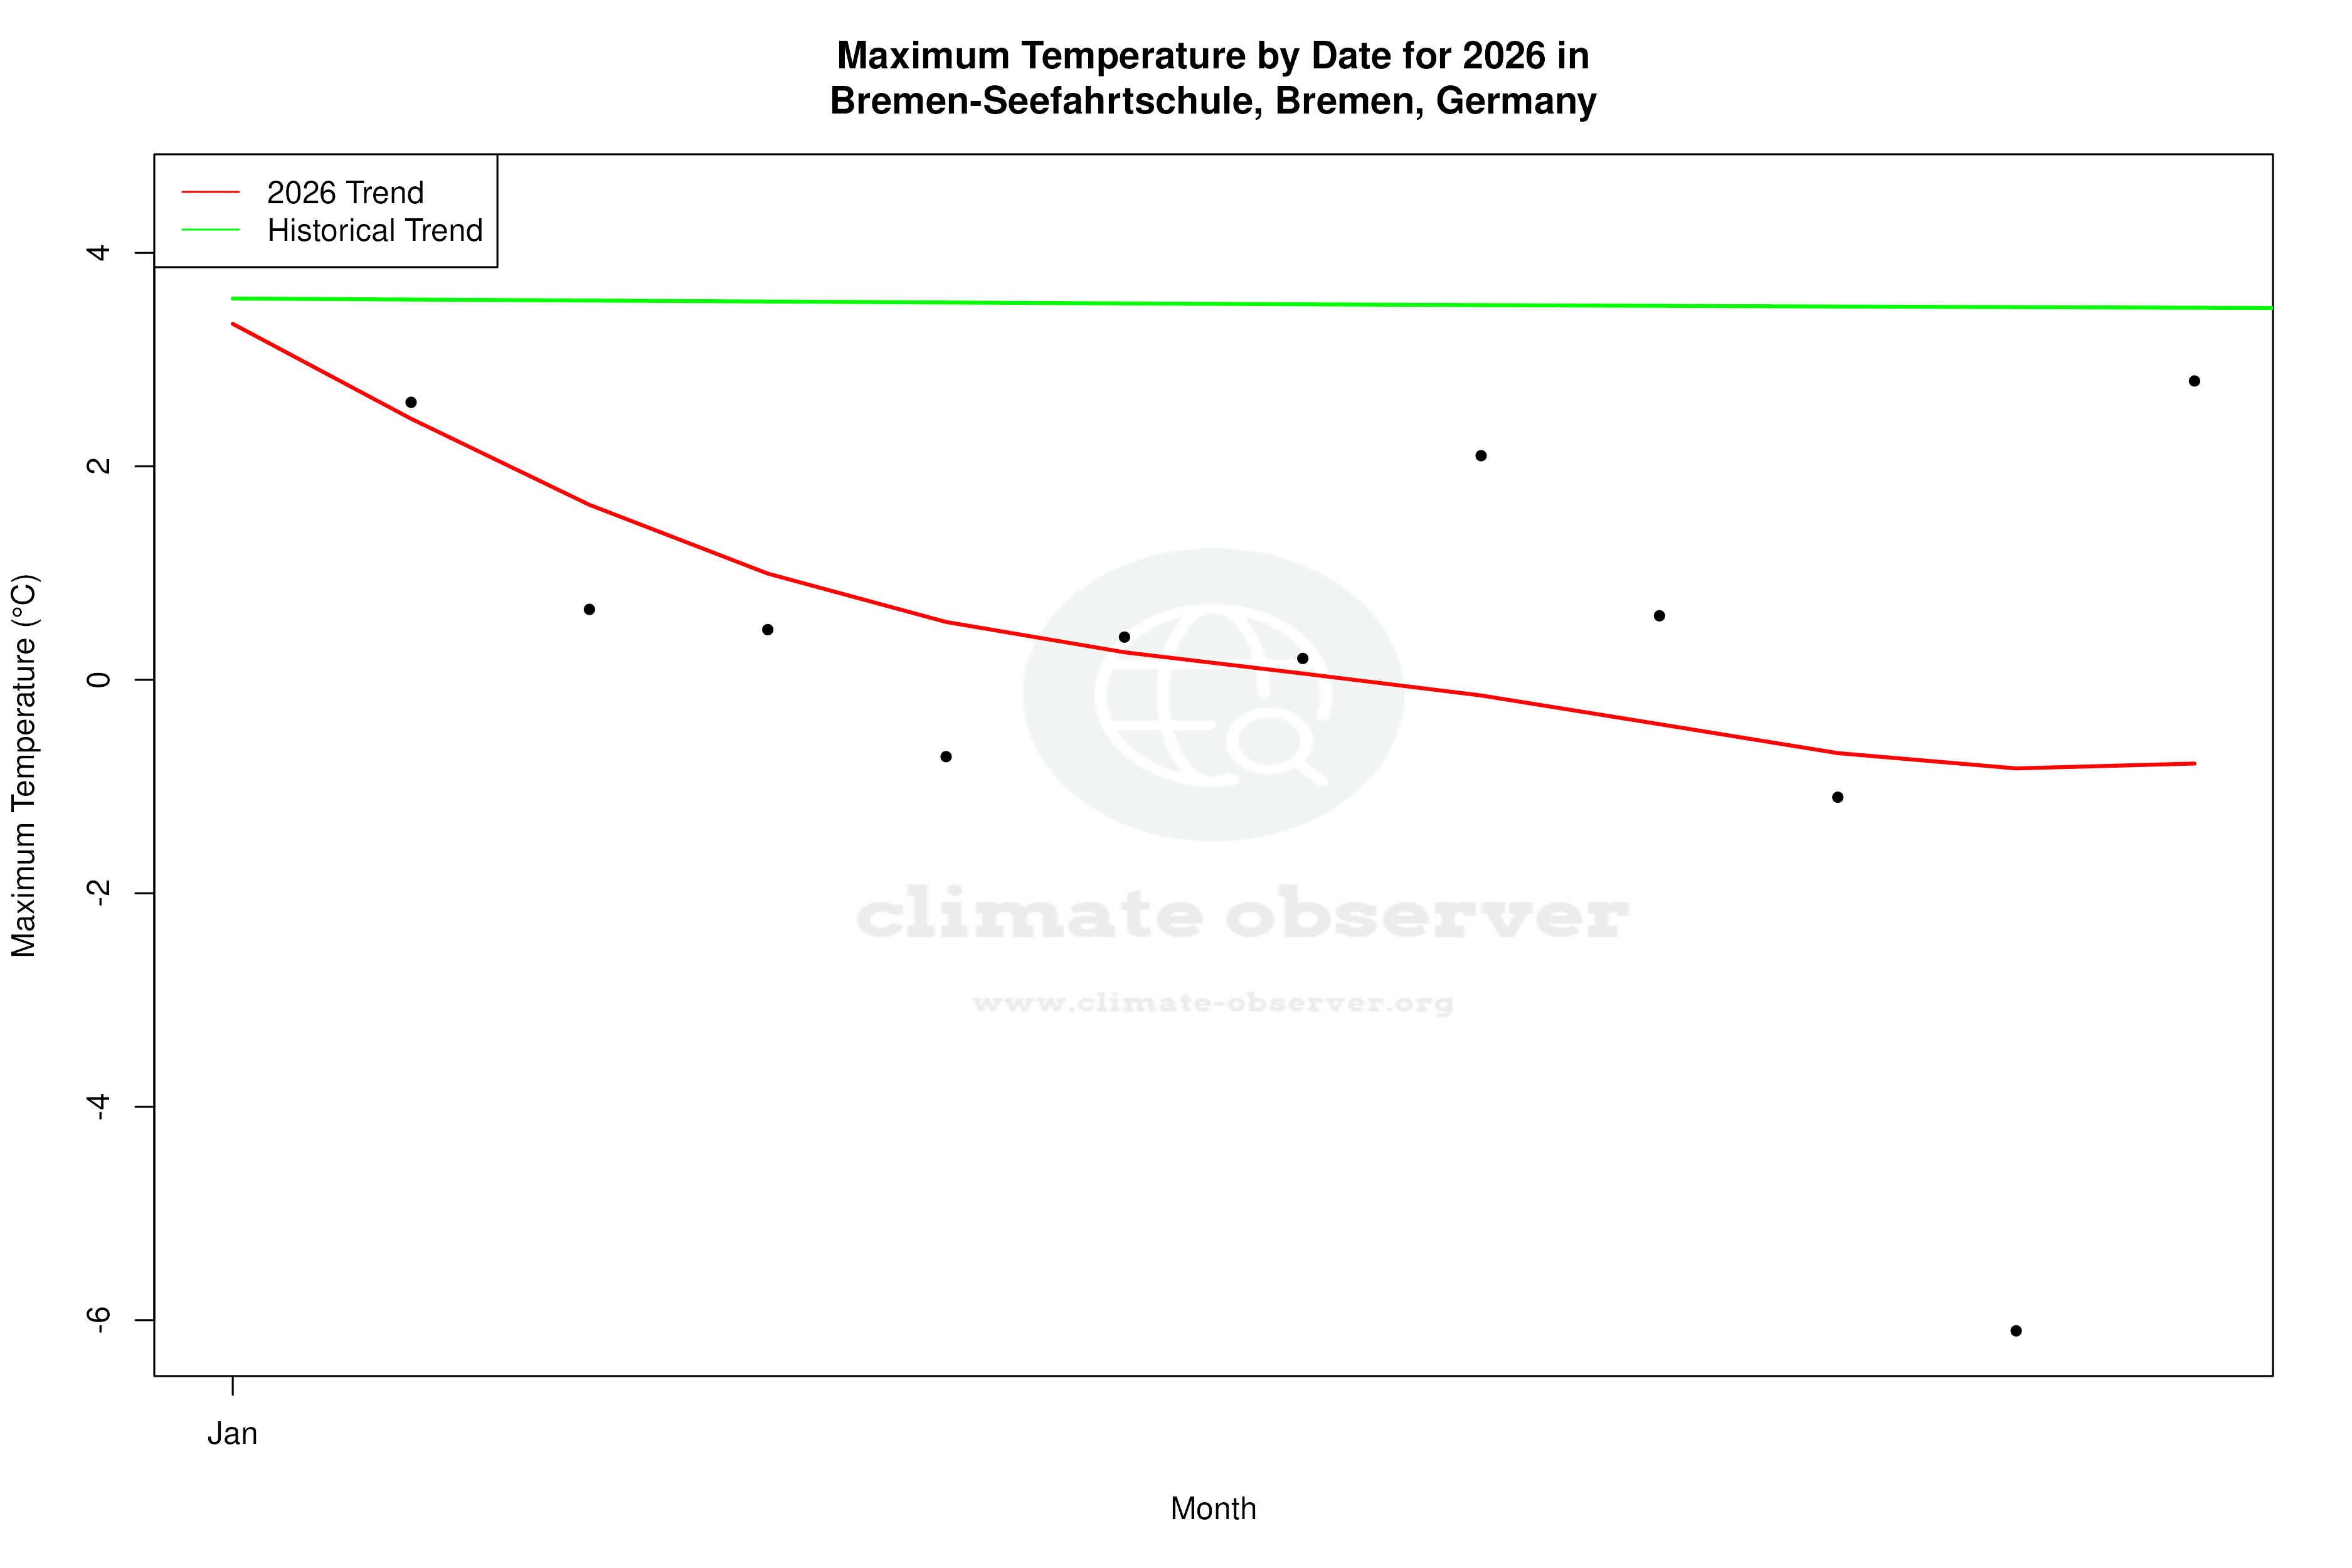


Max Temperature this Year | 1 of 6
Climate 12-Month Moving Averages
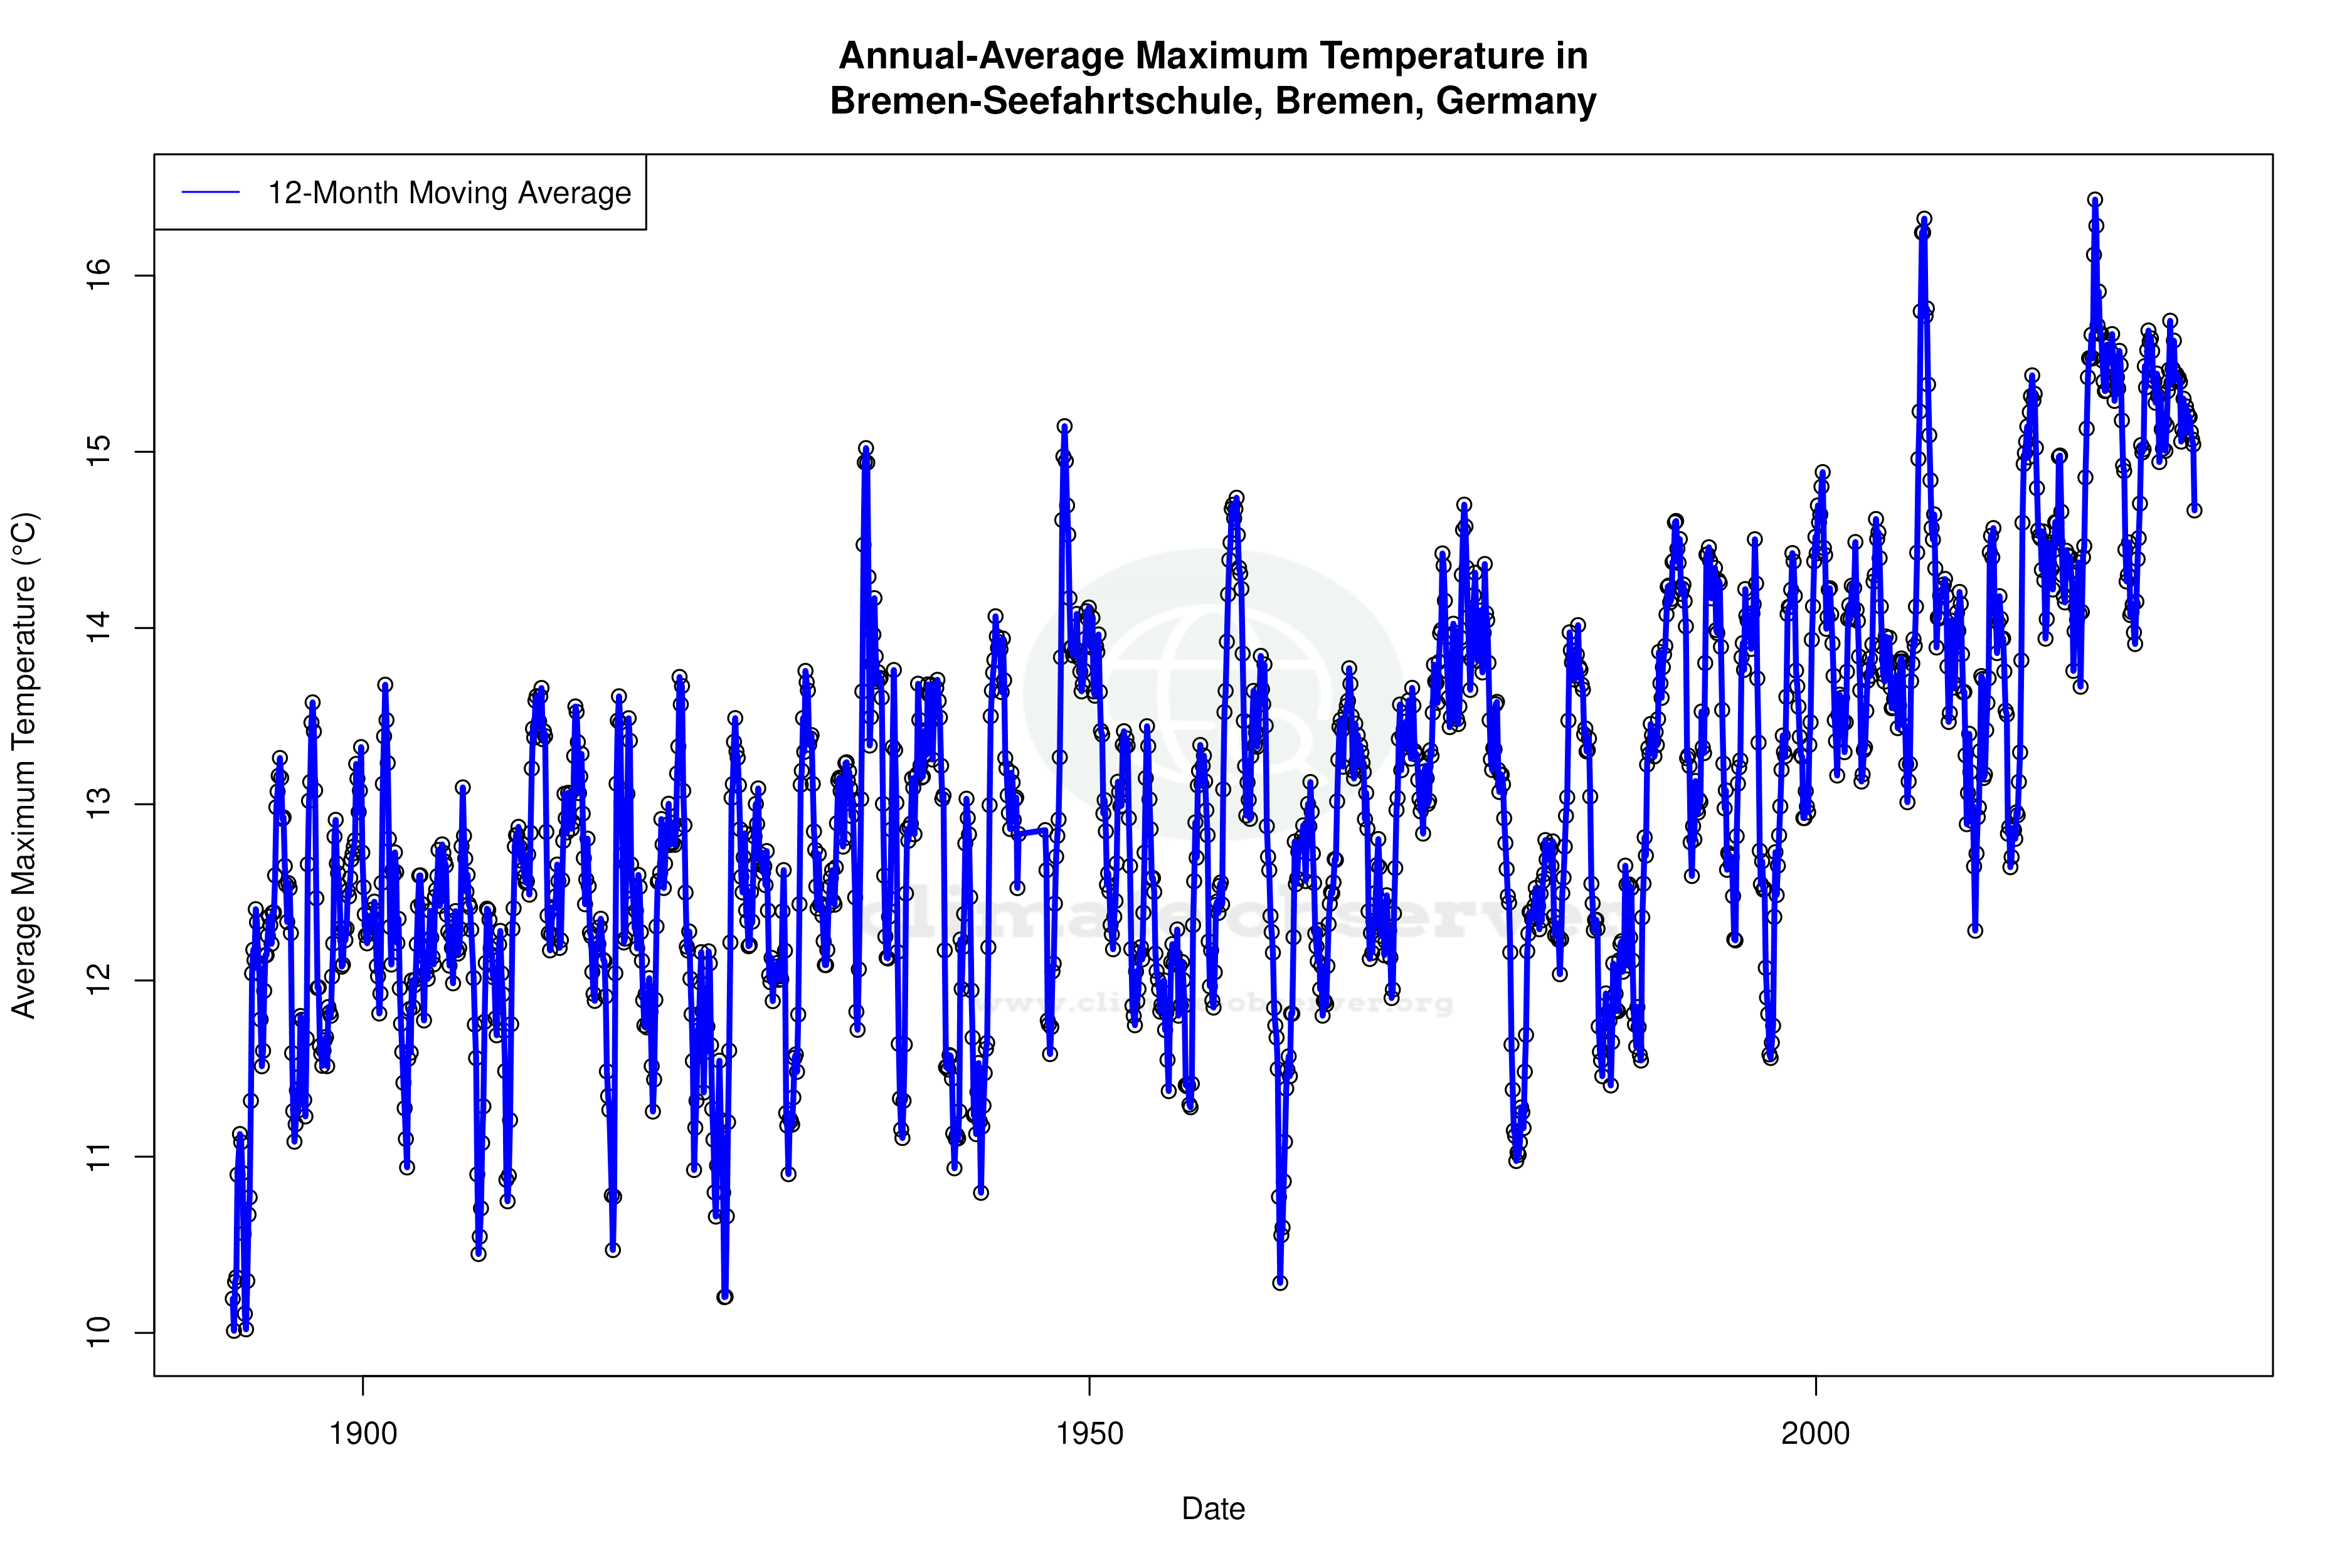


Max Temperature 12-Month MA | 1 of 6
Daily Data Points and Averages Throughout the Year


Average Max Temperature Throughout Year | 1 of 5
