Climate for Station: Bamberg, Bavaria, Germany
Loading live weather...
Climate Analysis & Overview
Bamberg, situated in the heart of Bavaria, is experiencing a notable warming trend over the past decade, particularly in its nocturnal temperatures. While the all-time data suggests a modest warming, the recent trends indicate a more pronounced change. Precipitation patterns have become slightly more evenly distributed, reflecting a subtle shift in local climate dynamics.
Bavarian Climate Context
Bamberg, located at 49.88°N, 10.92°E, enjoys a temperate oceanic climate according to the Köppen classification. This climate is characterised by moderate temperature variations and consistent precipitation throughout the year. The city's proximity to the Main River and surrounding low-lying hills influences its weather patterns, providing a natural buffer against extreme temperature fluctuations. However, recent data suggests that Bamberg is not immune to the broader climatic changes affecting Germany.
Temperature Trends: A Decade of Change
Over the past ten years, Bamberg has experienced a significant warming trend. The average high temperatures have increased by 0.85°C (1.53°F), while the lows have risen by 0.91°C (1.64°F). These changes are more pronounced than the all-time trends, which show a modest warming of 0.13°C (0.23°F) for highs and 0.04°C (0.07°F) for lows. This acceleration in temperature rise over the last decade is consistent with regional observations across Germany, where efforts are underway to mitigate climate change impacts.
Precipitation Patterns: A Subtle Shift
The Precipitation Concentration Index (PCI) for Bamberg has seen a slight decrease from a baseline of 11.07 to the current 10.01. This indicates that precipitation is becoming more evenly distributed throughout the year, with fewer intense rainfall events. Such a change, while marginal, suggests a shift towards more stable weather patterns, which could have implications for local agriculture and water management.
Extreme Temperatures: Historical Records
Bamberg's historical temperature records reveal a maximum of 38.3°C (100.9°F) and a minimum of -29.7°C (-21.5°F). These extremes highlight the city's susceptibility to both heatwaves and cold snaps, albeit less frequently due to its temperate climate. The recent warming trends, however, may lead to more frequent occurrences of high-temperature events, necessitating adaptive measures.
Regional Climate Goals and Implications
Germany's commitment to reducing greenhouse gas emissions and transitioning to renewable energy sources is part of a broader strategy to combat climate change. Bamberg's warming trends underscore the importance of these efforts. The city's climate data aligns with the national narrative of rising temperatures and evolving precipitation patterns, reinforcing the need for continued vigilance and adaptation strategies.
Station Statistics
10-Year Trend
High: +0.63 °C/decade
Low: +1.06 °C/decade
Rain: +0.17 mm/decade
25-Year Trend
High: +0.73 °C/decade
Low: +0.07 °C/decade
Rain: -0.04 mm/decade
50-Year Trend
High: +0.63 °C/decade
Low: +0.06 °C/decade
Rain: +0.00 mm/decade
All-Time Trend
High: +0.13 °C/decade
Low: +0.04 °C/decade
Rain: +0.00 mm/decade
Percentage Above-Average Days
Last 12 Months: 54.2%
This Year: 62.6%
Precipitation Concentration Index (PCI) ℹ️
Last 12 Months: 10.2
Historical Average: 11.0
Percentile Rank of Last 12 Months ℹ️
High: 94th percentile
Low: 63rd percentile
Rain: 34th percentile
Change in Variance ℹ️
High: -0.8%
Low: -13.7%
Intraday: +33.6%
Data Coverage
88.1%
First Year of Data
1879
Station Location
Historical Weather Records
| Max High | Avg High | Min High | Max Avg | Avg Avg | Min Avg | Max Low | Avg Low | Min Low | Max Precipitation | Avg Precipitation | Max Snow | Avg Snow | |
|---|---|---|---|---|---|---|---|---|---|---|---|---|---|
| Record | 38.3 °C | — | -17.0 °C | 30.4 °C | — | -20.7 °C | 23.1 °C | — | -29.7 °C | 75.3 mm | — | — | — |
| January | 15.8 °C | 2.3 °C | -17.0 °C | 12.3 °C | -0.1 °C | -20.7 °C | 10.1 °C | -3.7 °C | -29.7 °C | 43.5 mm | 1.5 mm | — | — |
| February | 19.9 °C | 4.5 °C | -16.4 °C | 12.3 °C | 1.0 °C | -19.8 °C | 9.8 °C | -3.0 °C | -26.4 °C | 26.0 mm | 1.3 mm | — | — |
| March | 24.4 °C | 9.4 °C | -5.1 °C | 16.2 °C | 4.7 °C | -10.6 °C | 11.1 °C | -0.4 °C | -19.6 °C | 54.0 mm | 1.3 mm | — | — |
| April | 31.8 °C | 14.3 °C | -0.7 °C | 21.0 °C | 9.0 °C | -1.4 °C | 13.8 °C | 2.9 °C | -9.7 °C | 34.7 mm | 1.4 mm | — | — |
| May | 33.3 °C | 19.2 °C | 3.9 °C | 24.7 °C | 13.7 °C | 2.4 °C | 17.9 °C | 7.2 °C | -4.1 °C | 54.2 mm | 1.9 mm | — | — |
| June | 36.2 °C | 22.5 °C | 9.5 °C | 30.4 °C | 17.2 °C | 7.8 °C | 23.1 °C | 10.5 °C | -1.0 °C | 75.3 mm | 2.3 mm | — | — |
| July | 38.2 °C | 24.1 °C | 11.5 °C | 29.2 °C | 18.7 °C | 10.0 °C | 21.0 °C | 12.2 °C | 1.4 °C | 55.6 mm | 2.4 mm | — | — |
| August | 38.3 °C | 23.6 °C | 11.2 °C | 29.2 °C | 18.1 °C | 9.5 °C | 21.9 °C | 11.7 °C | 0.7 °C | 69.5 mm | 2.1 mm | — | — |
| September | 33.3 °C | 19.8 °C | 8.0 °C | 25.2 °C | 14.1 °C | 3.8 °C | 18.1 °C | 8.6 °C | -2.5 °C | 53.9 mm | 1.7 mm | — | — |
| October | 27.6 °C | 13.7 °C | 0.5 °C | 20.4 °C | 9.3 °C | -1.2 °C | 15.8 °C | 4.5 °C | -7.5 °C | 44.9 mm | 1.6 mm | — | — |
| November | 21.9 °C | 7.0 °C | -5.8 °C | 15.9 °C | 4.3 °C | -9.3 °C | 12.5 °C | 0.9 °C | -18.0 °C | 39.8 mm | 1.6 mm | — | — |
| December | 17.7 °C | 3.2 °C | -16.4 °C | 13.4 °C | 1.2 °C | -19.4 °C | 11.1 °C | -2.1 °C | -23.0 °C | 54.1 mm | 1.7 mm | — | — |
Data Visualisations
Remove WatermarksCurrent Year Climate Trends vs Historical

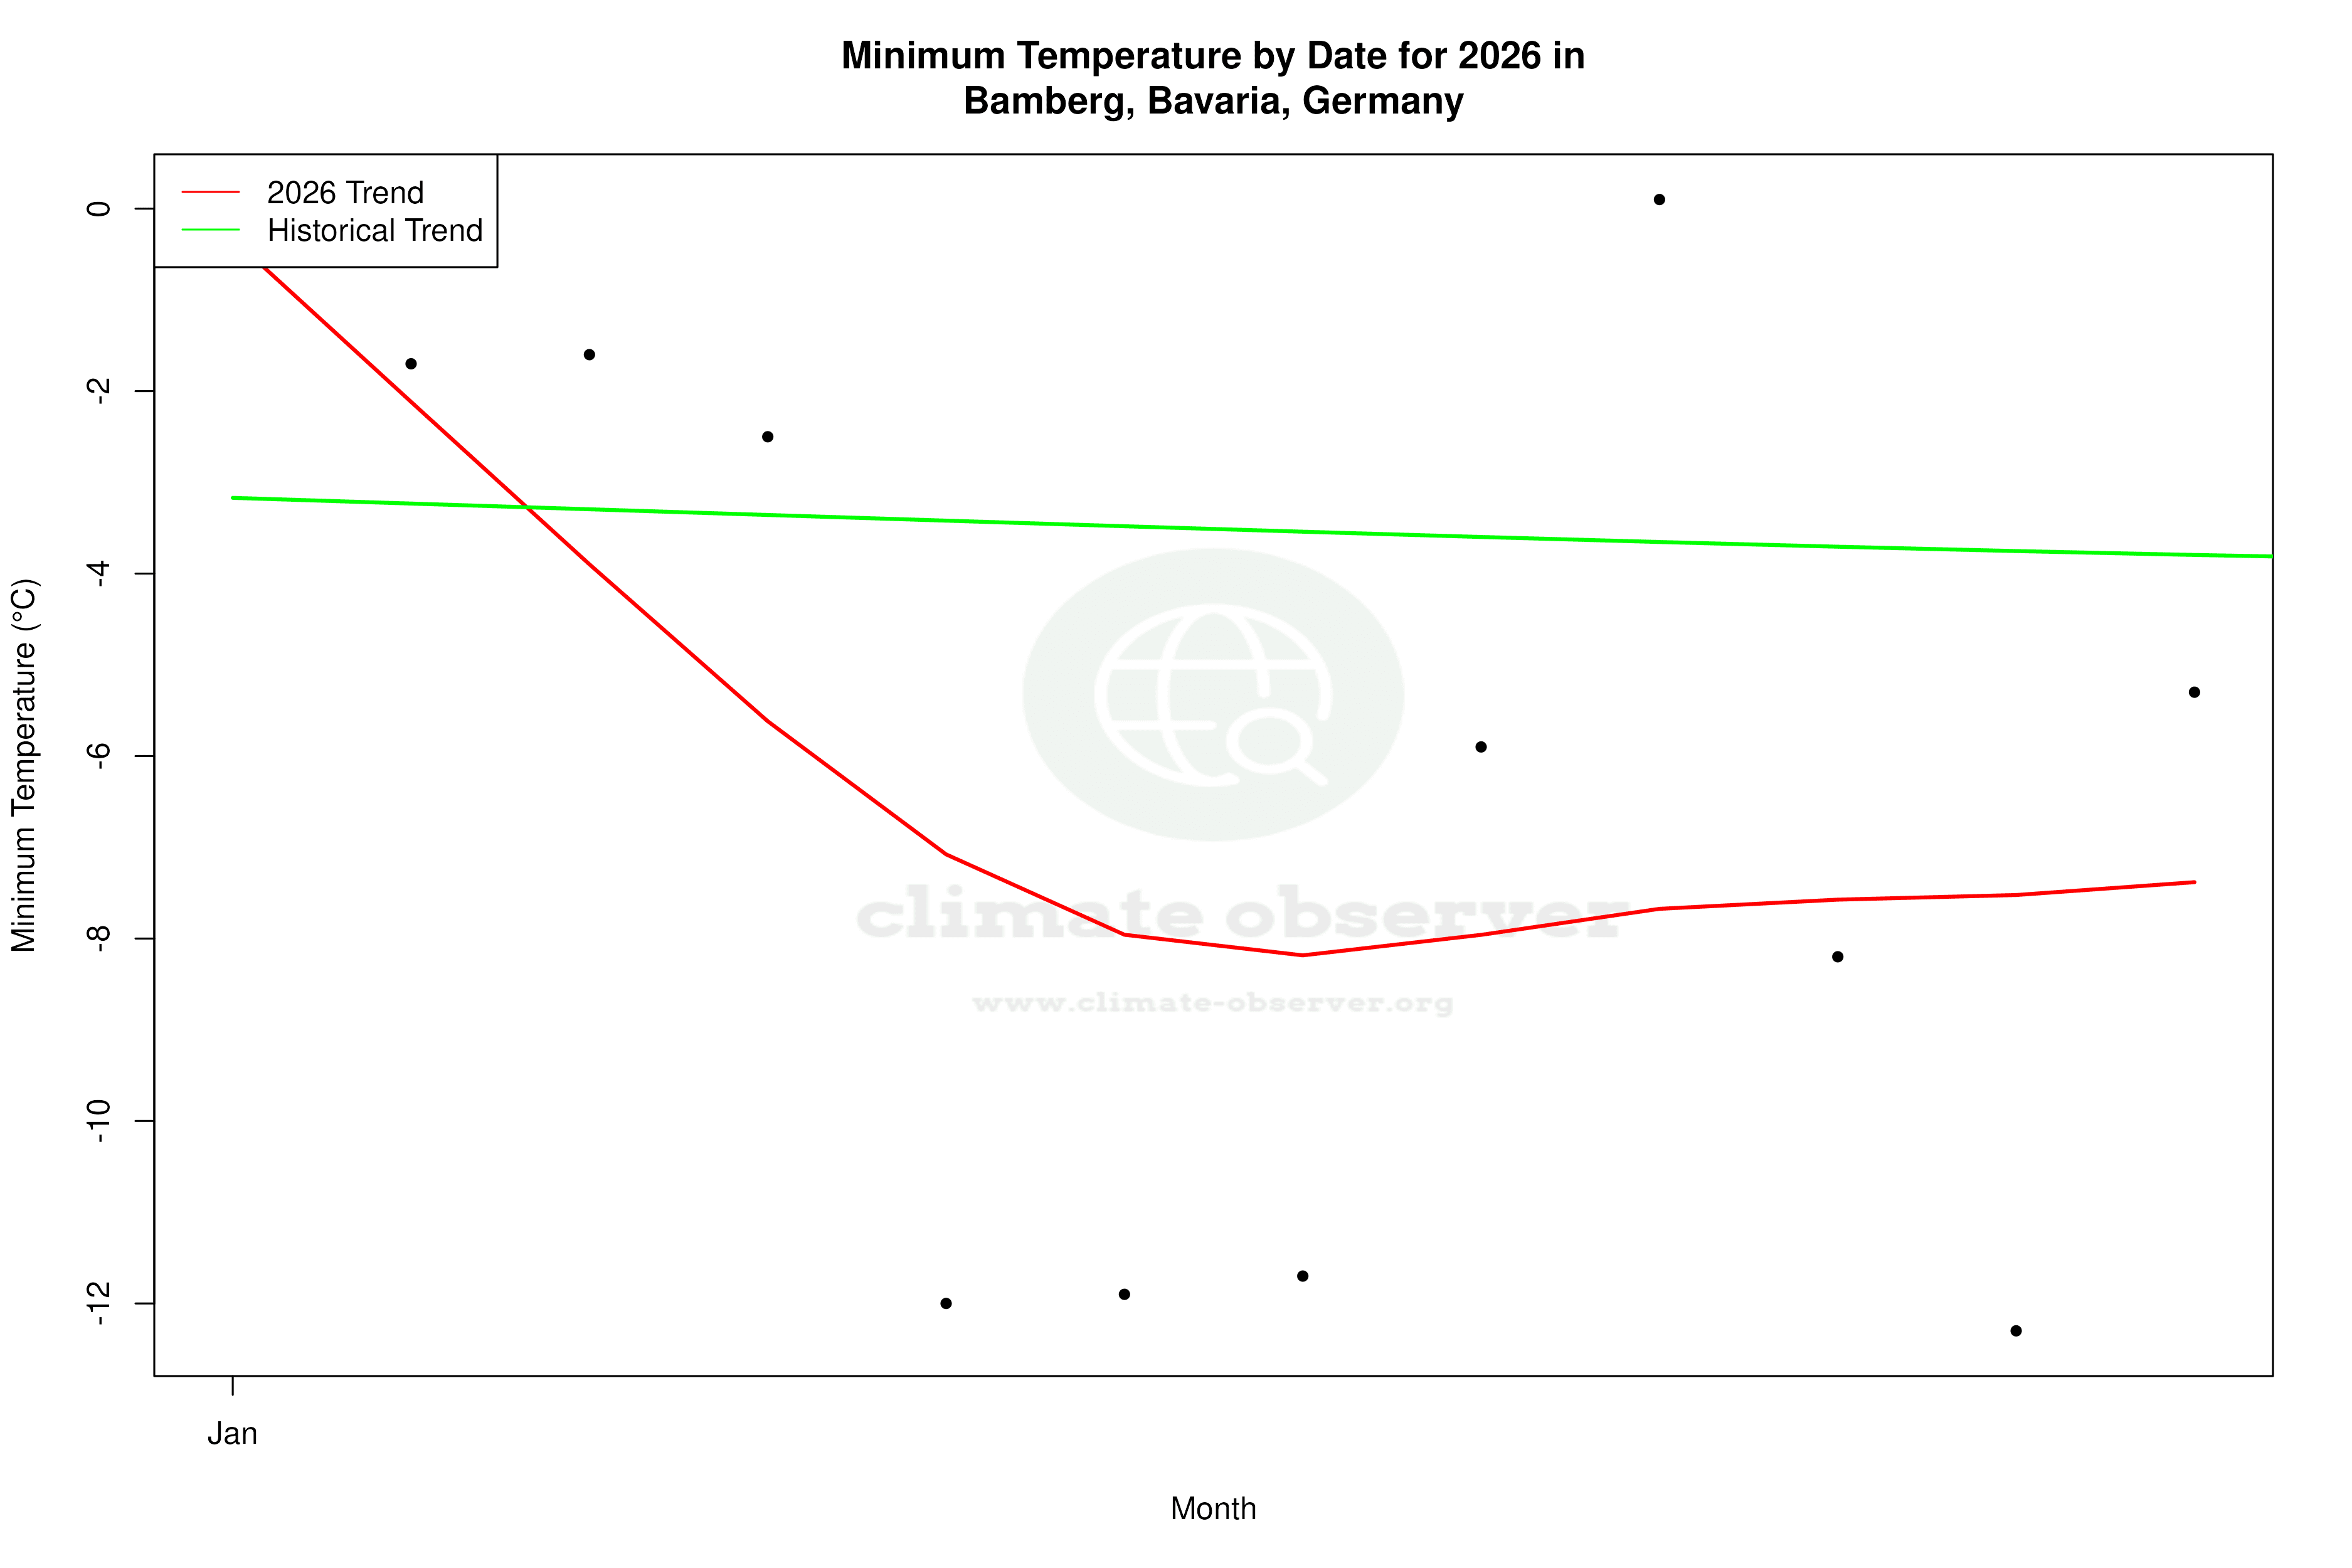


Max Temperature this Year | 1 of 6
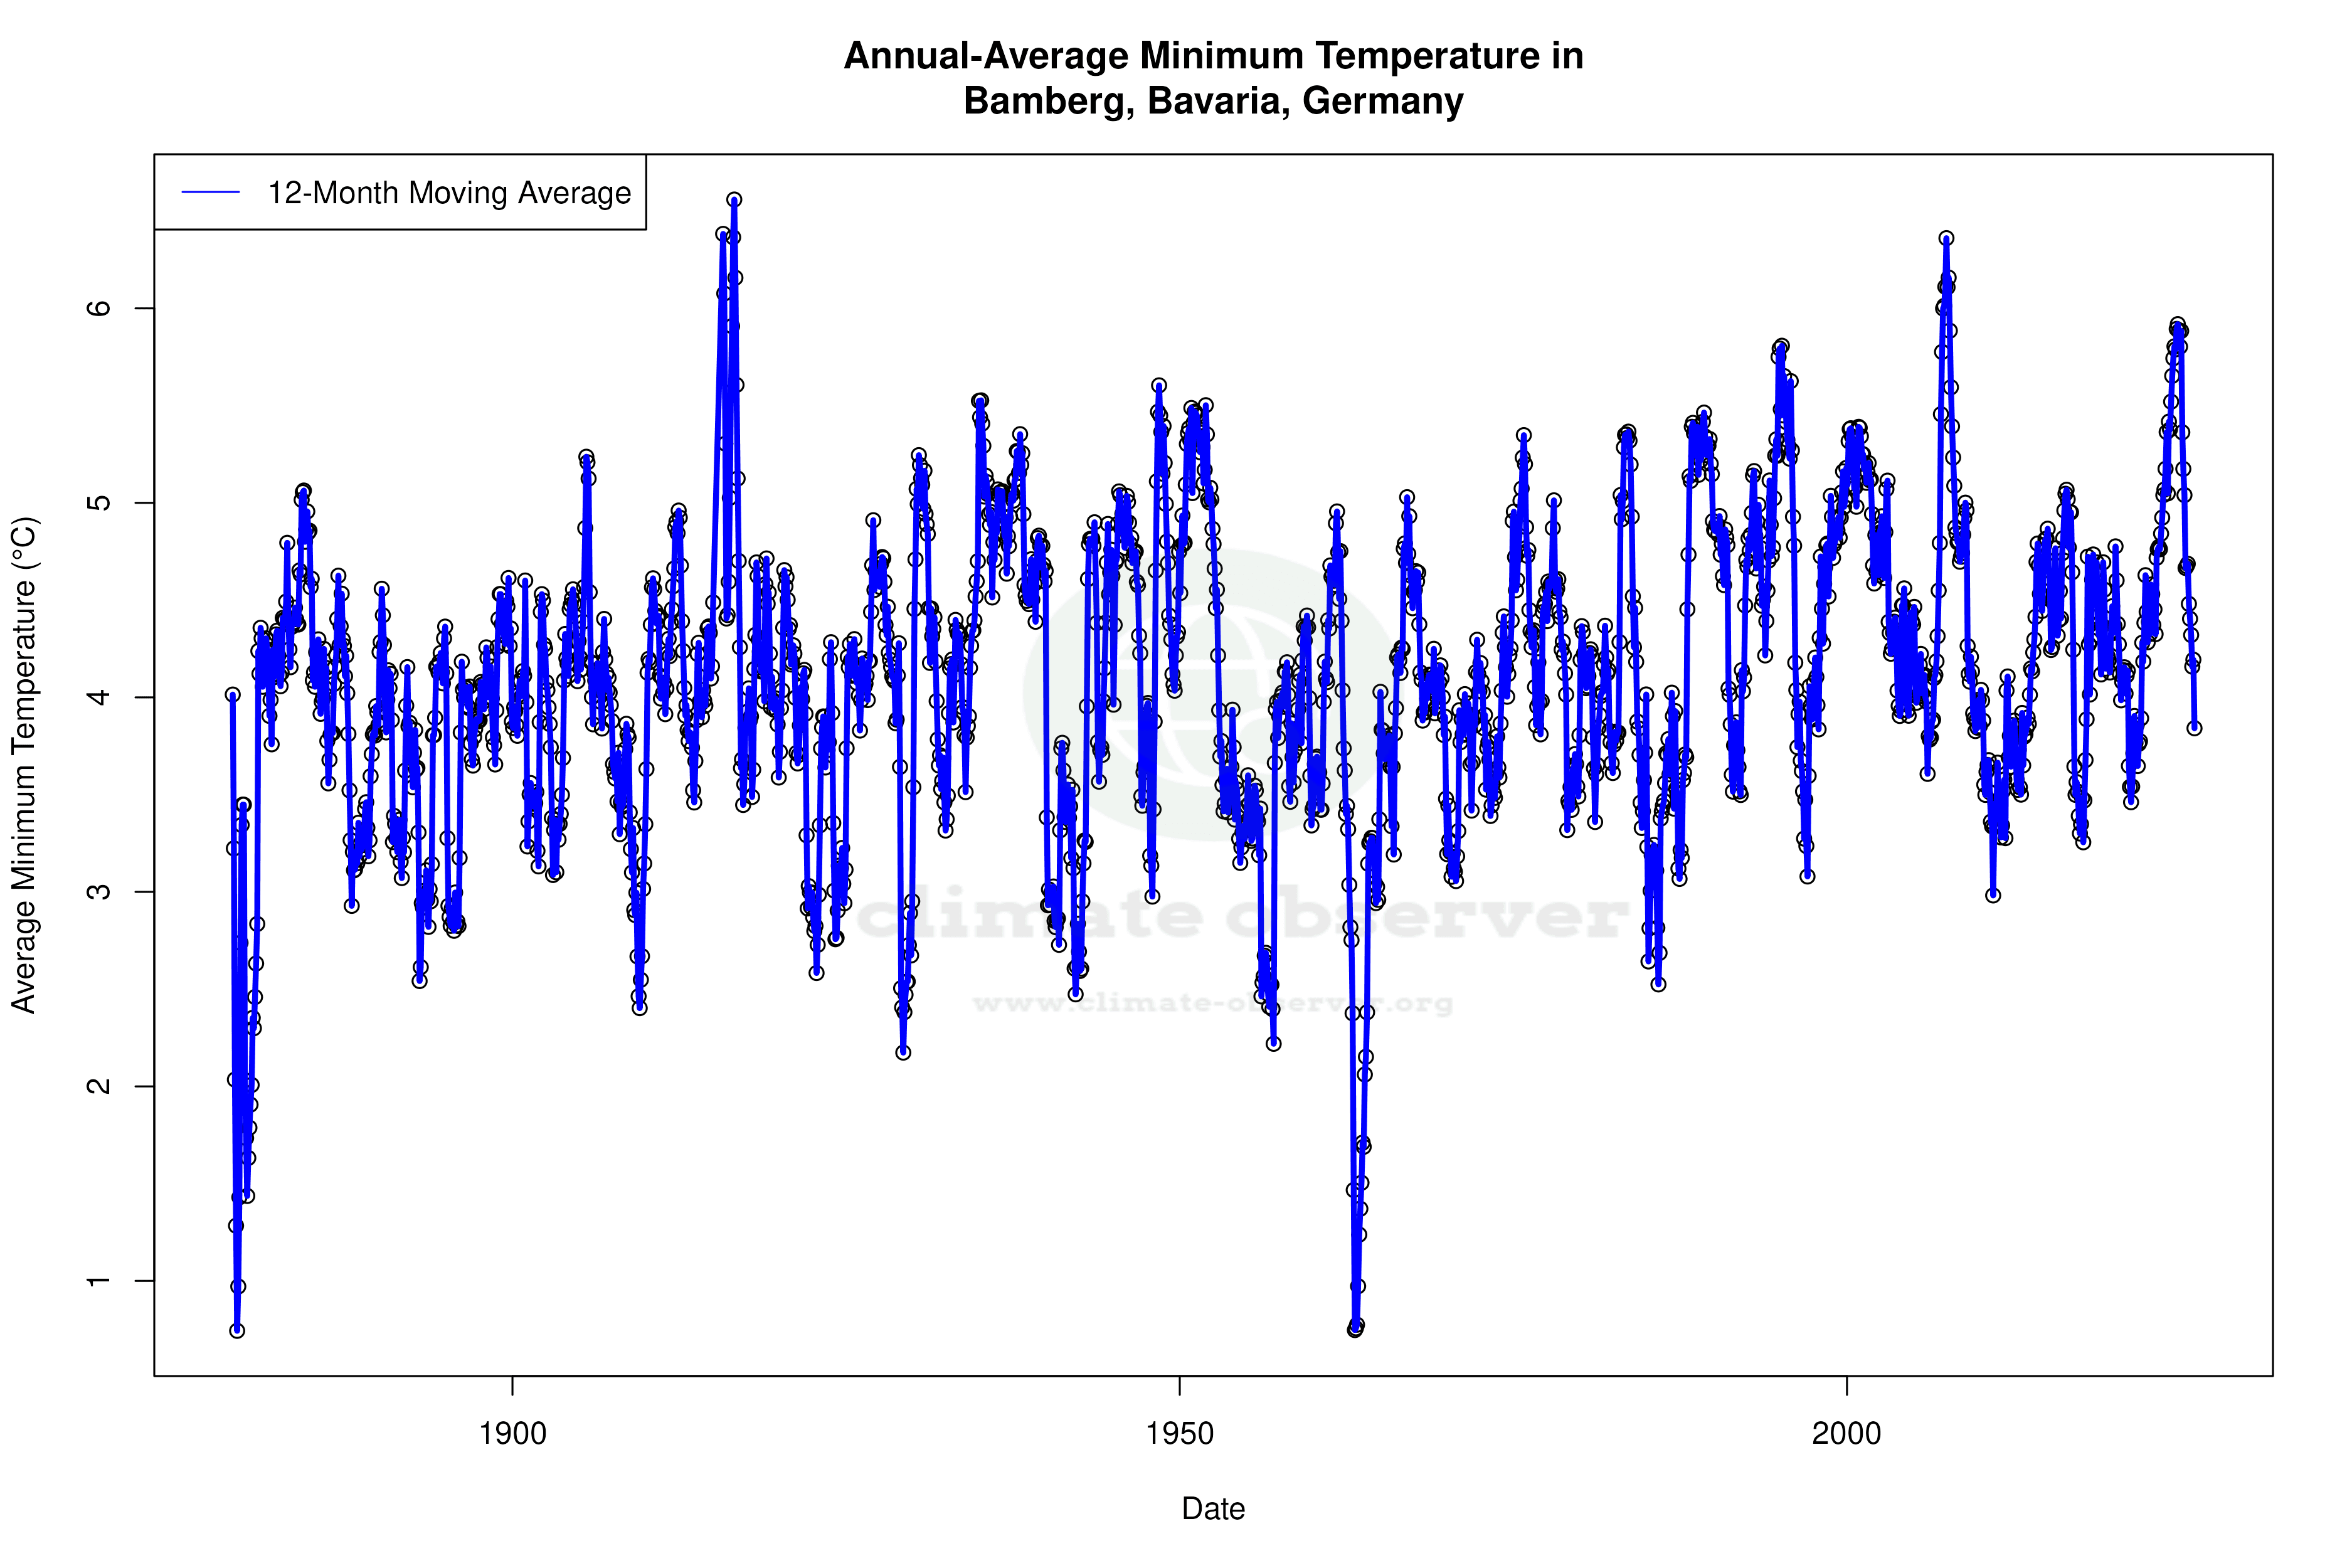
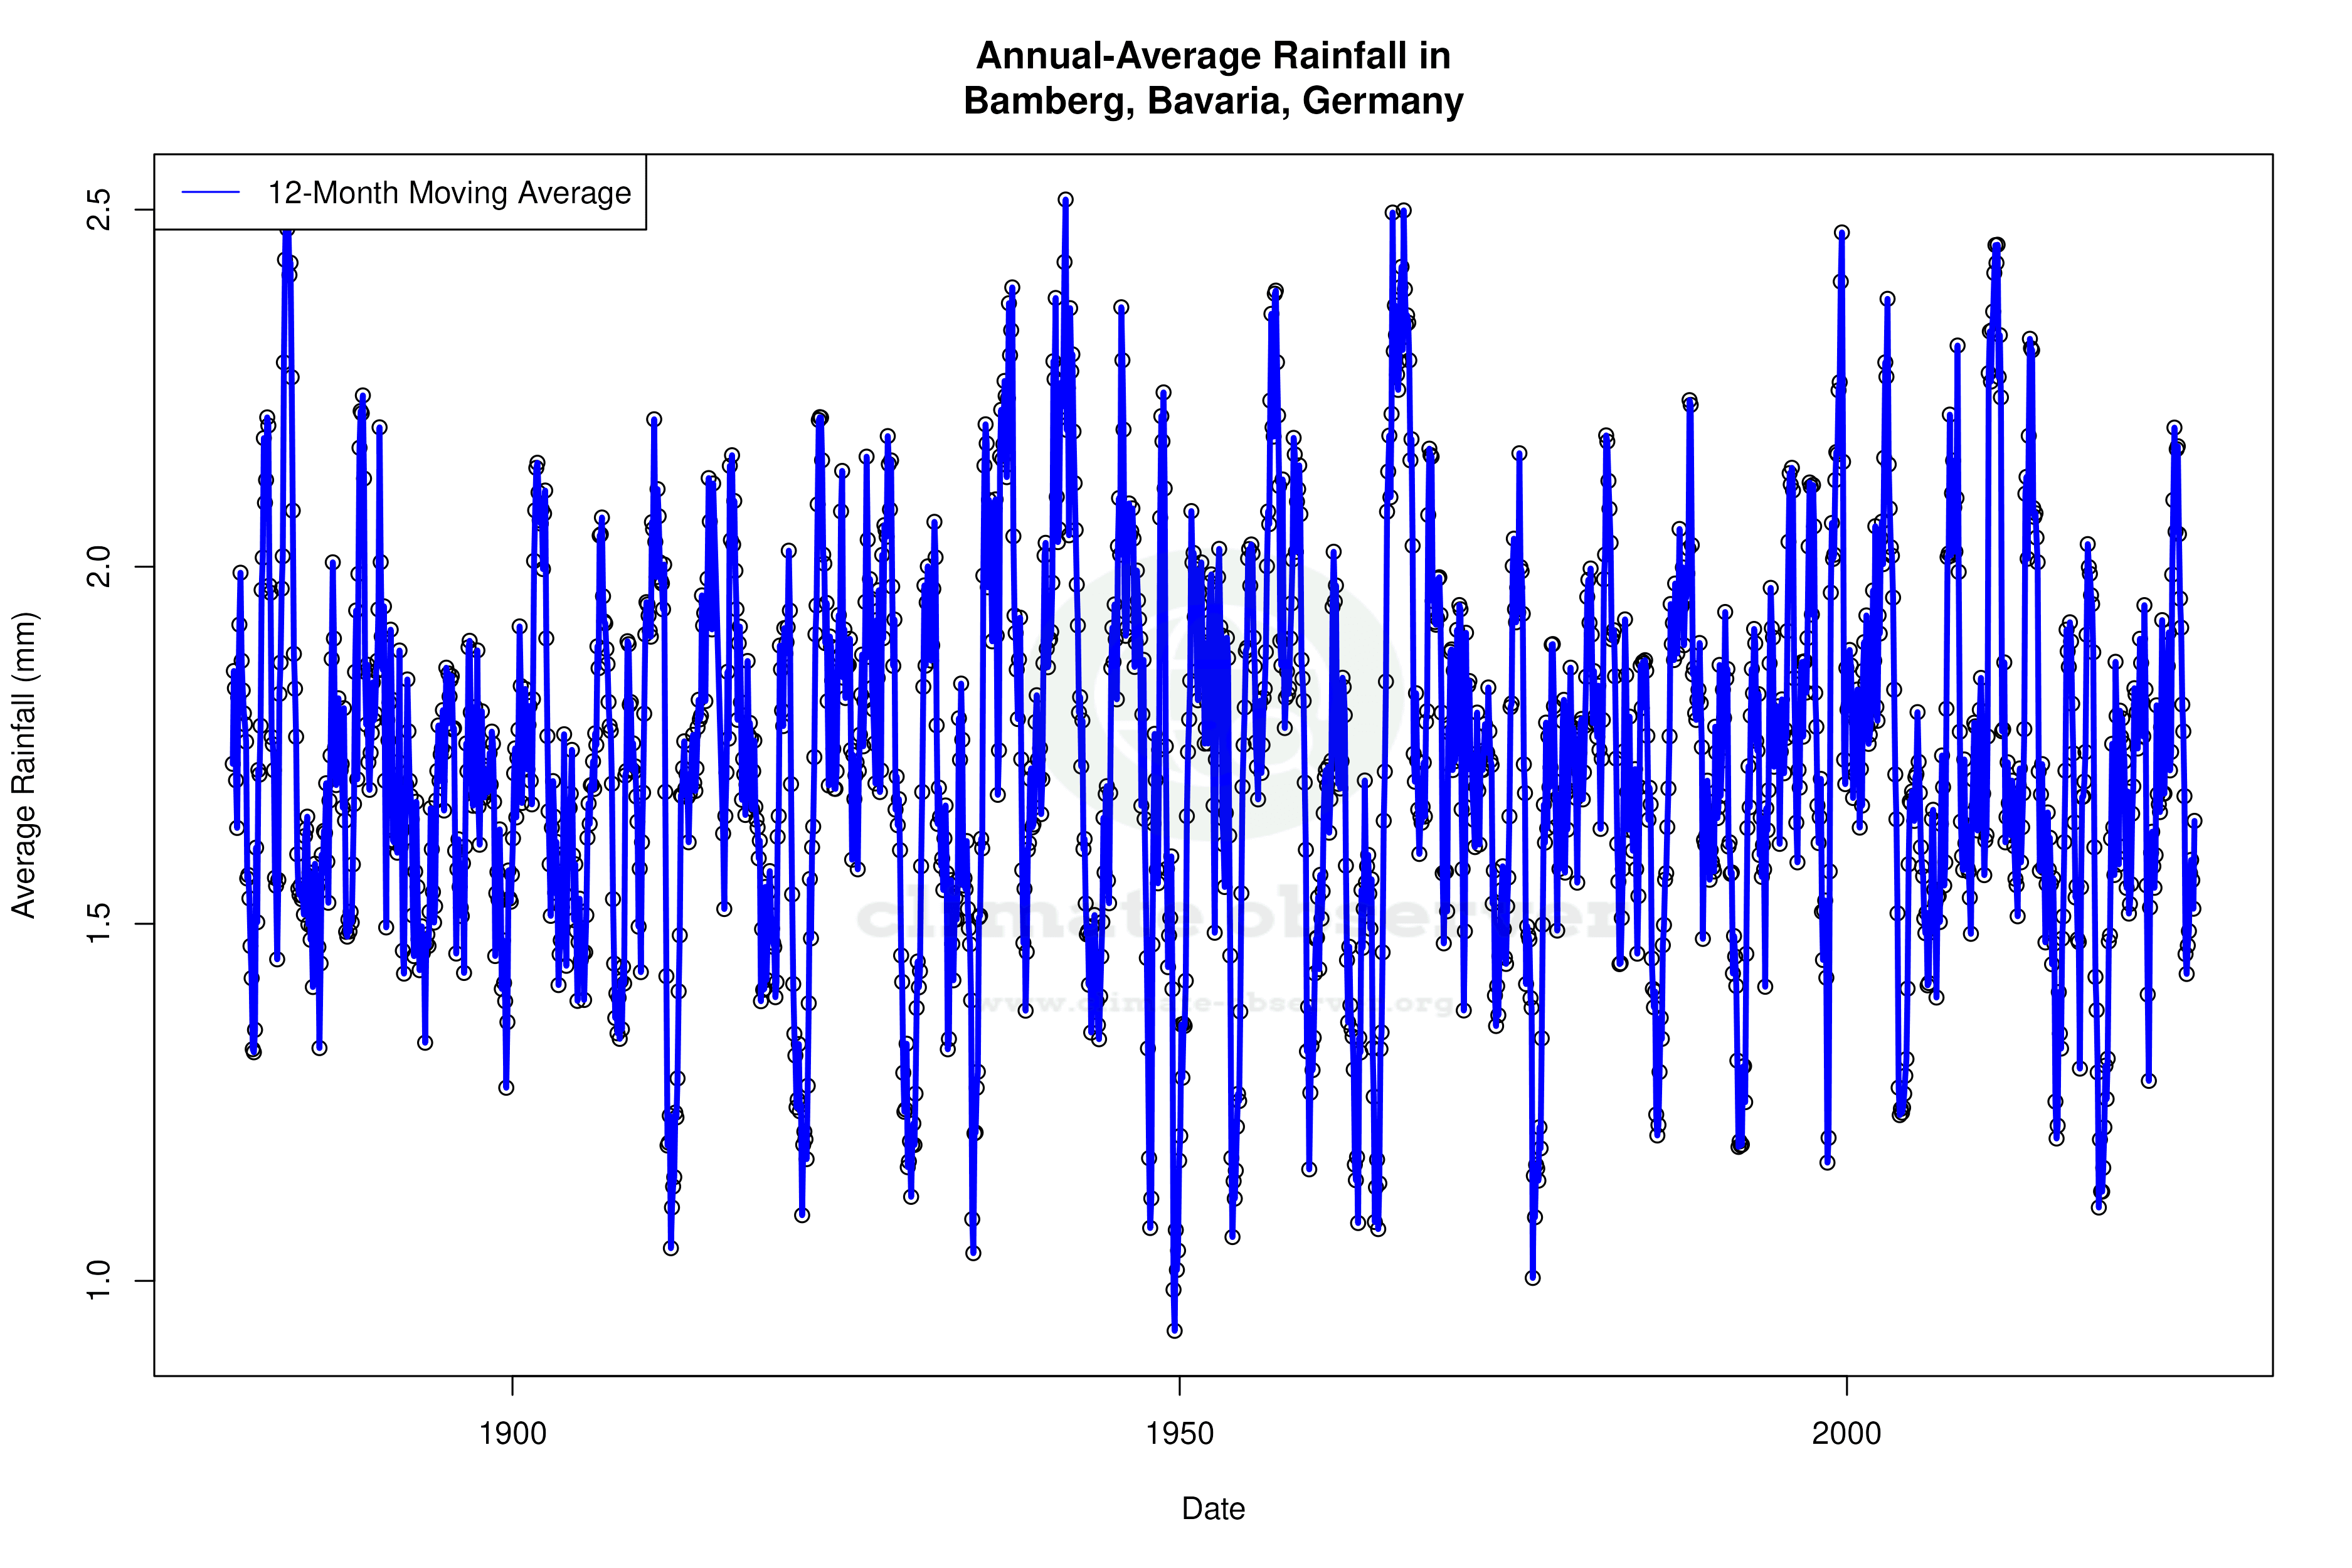
Climate 12-Month Moving Averages
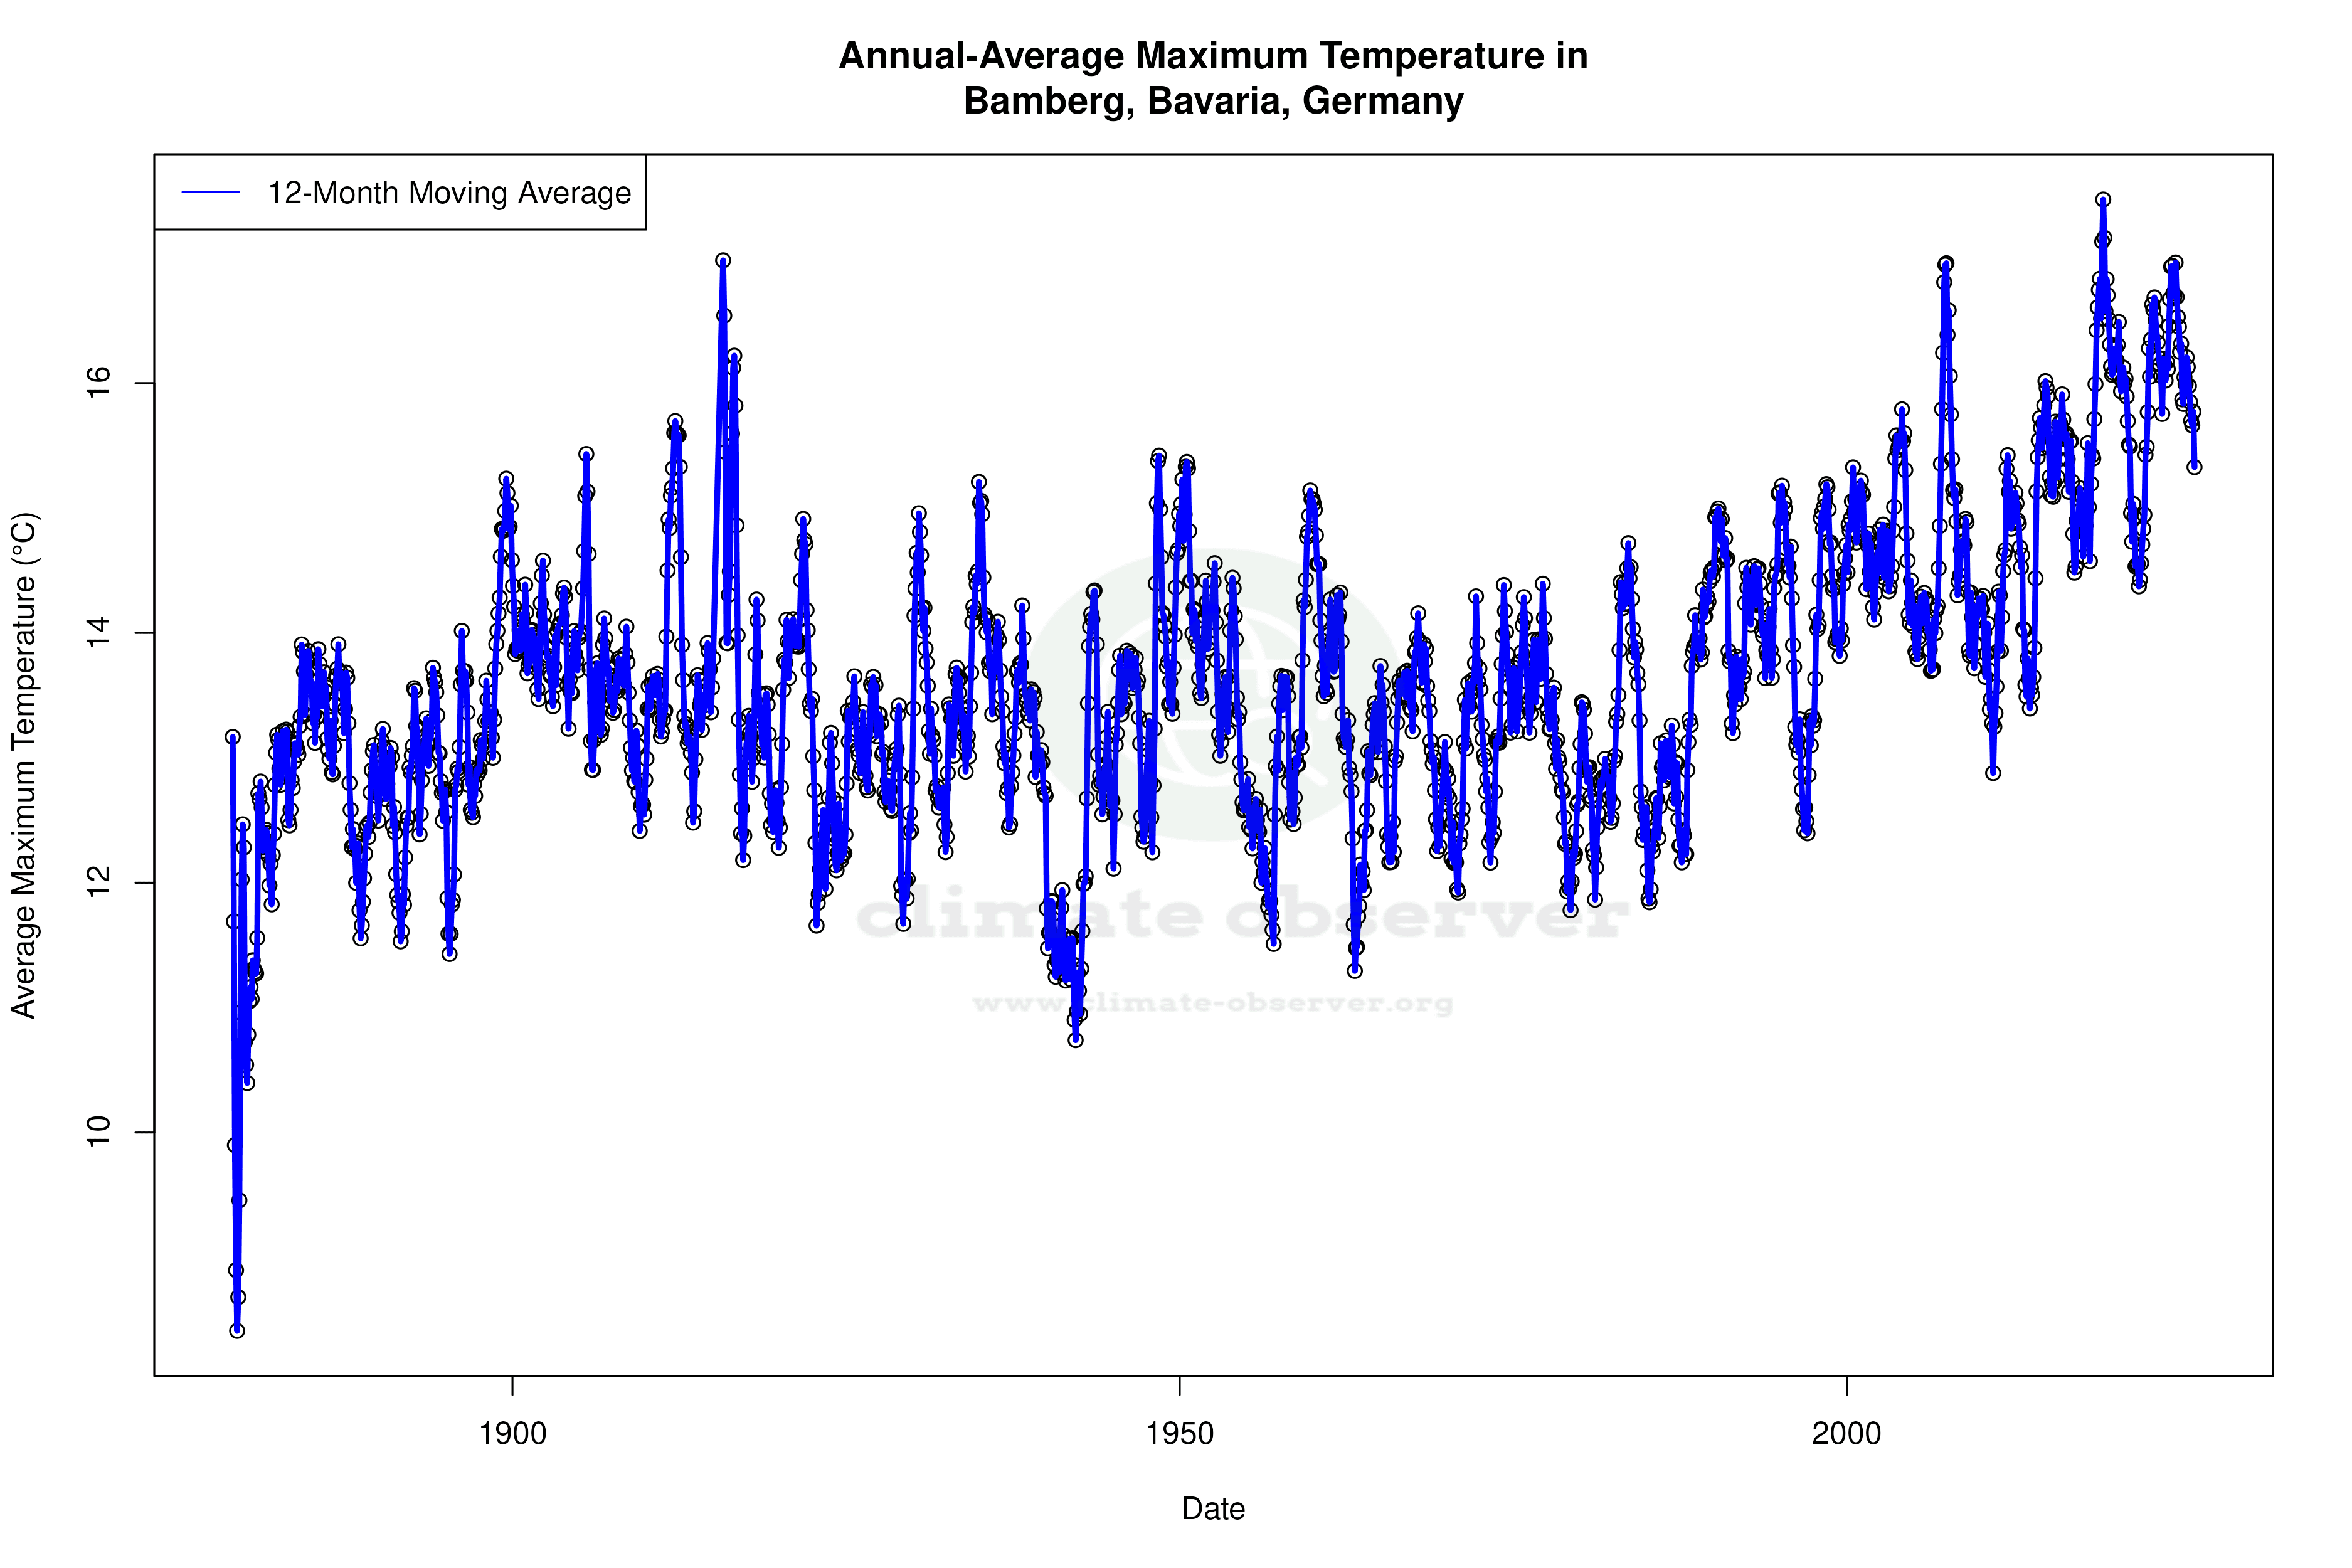


Max Temperature 12-Month MA | 1 of 6
Daily Data Points and Averages Throughout the Year


Average Max Temperature Throughout Year | 1 of 5
