Climate for Station: Munchen-Nymphenburg, Bavaria, Germany
Loading live weather...
Climate Analysis & Overview
The climate profile for München-Nymphenburg reveals a warming trend with a notable increase in temperatures over both the long and short term. Precipitation is becoming slightly more evenly distributed, reflecting a broader shift in regional weather patterns. These changes align with Germany's climate goals of reducing extreme weather impacts.
Warming Trends in München-Nymphenburg
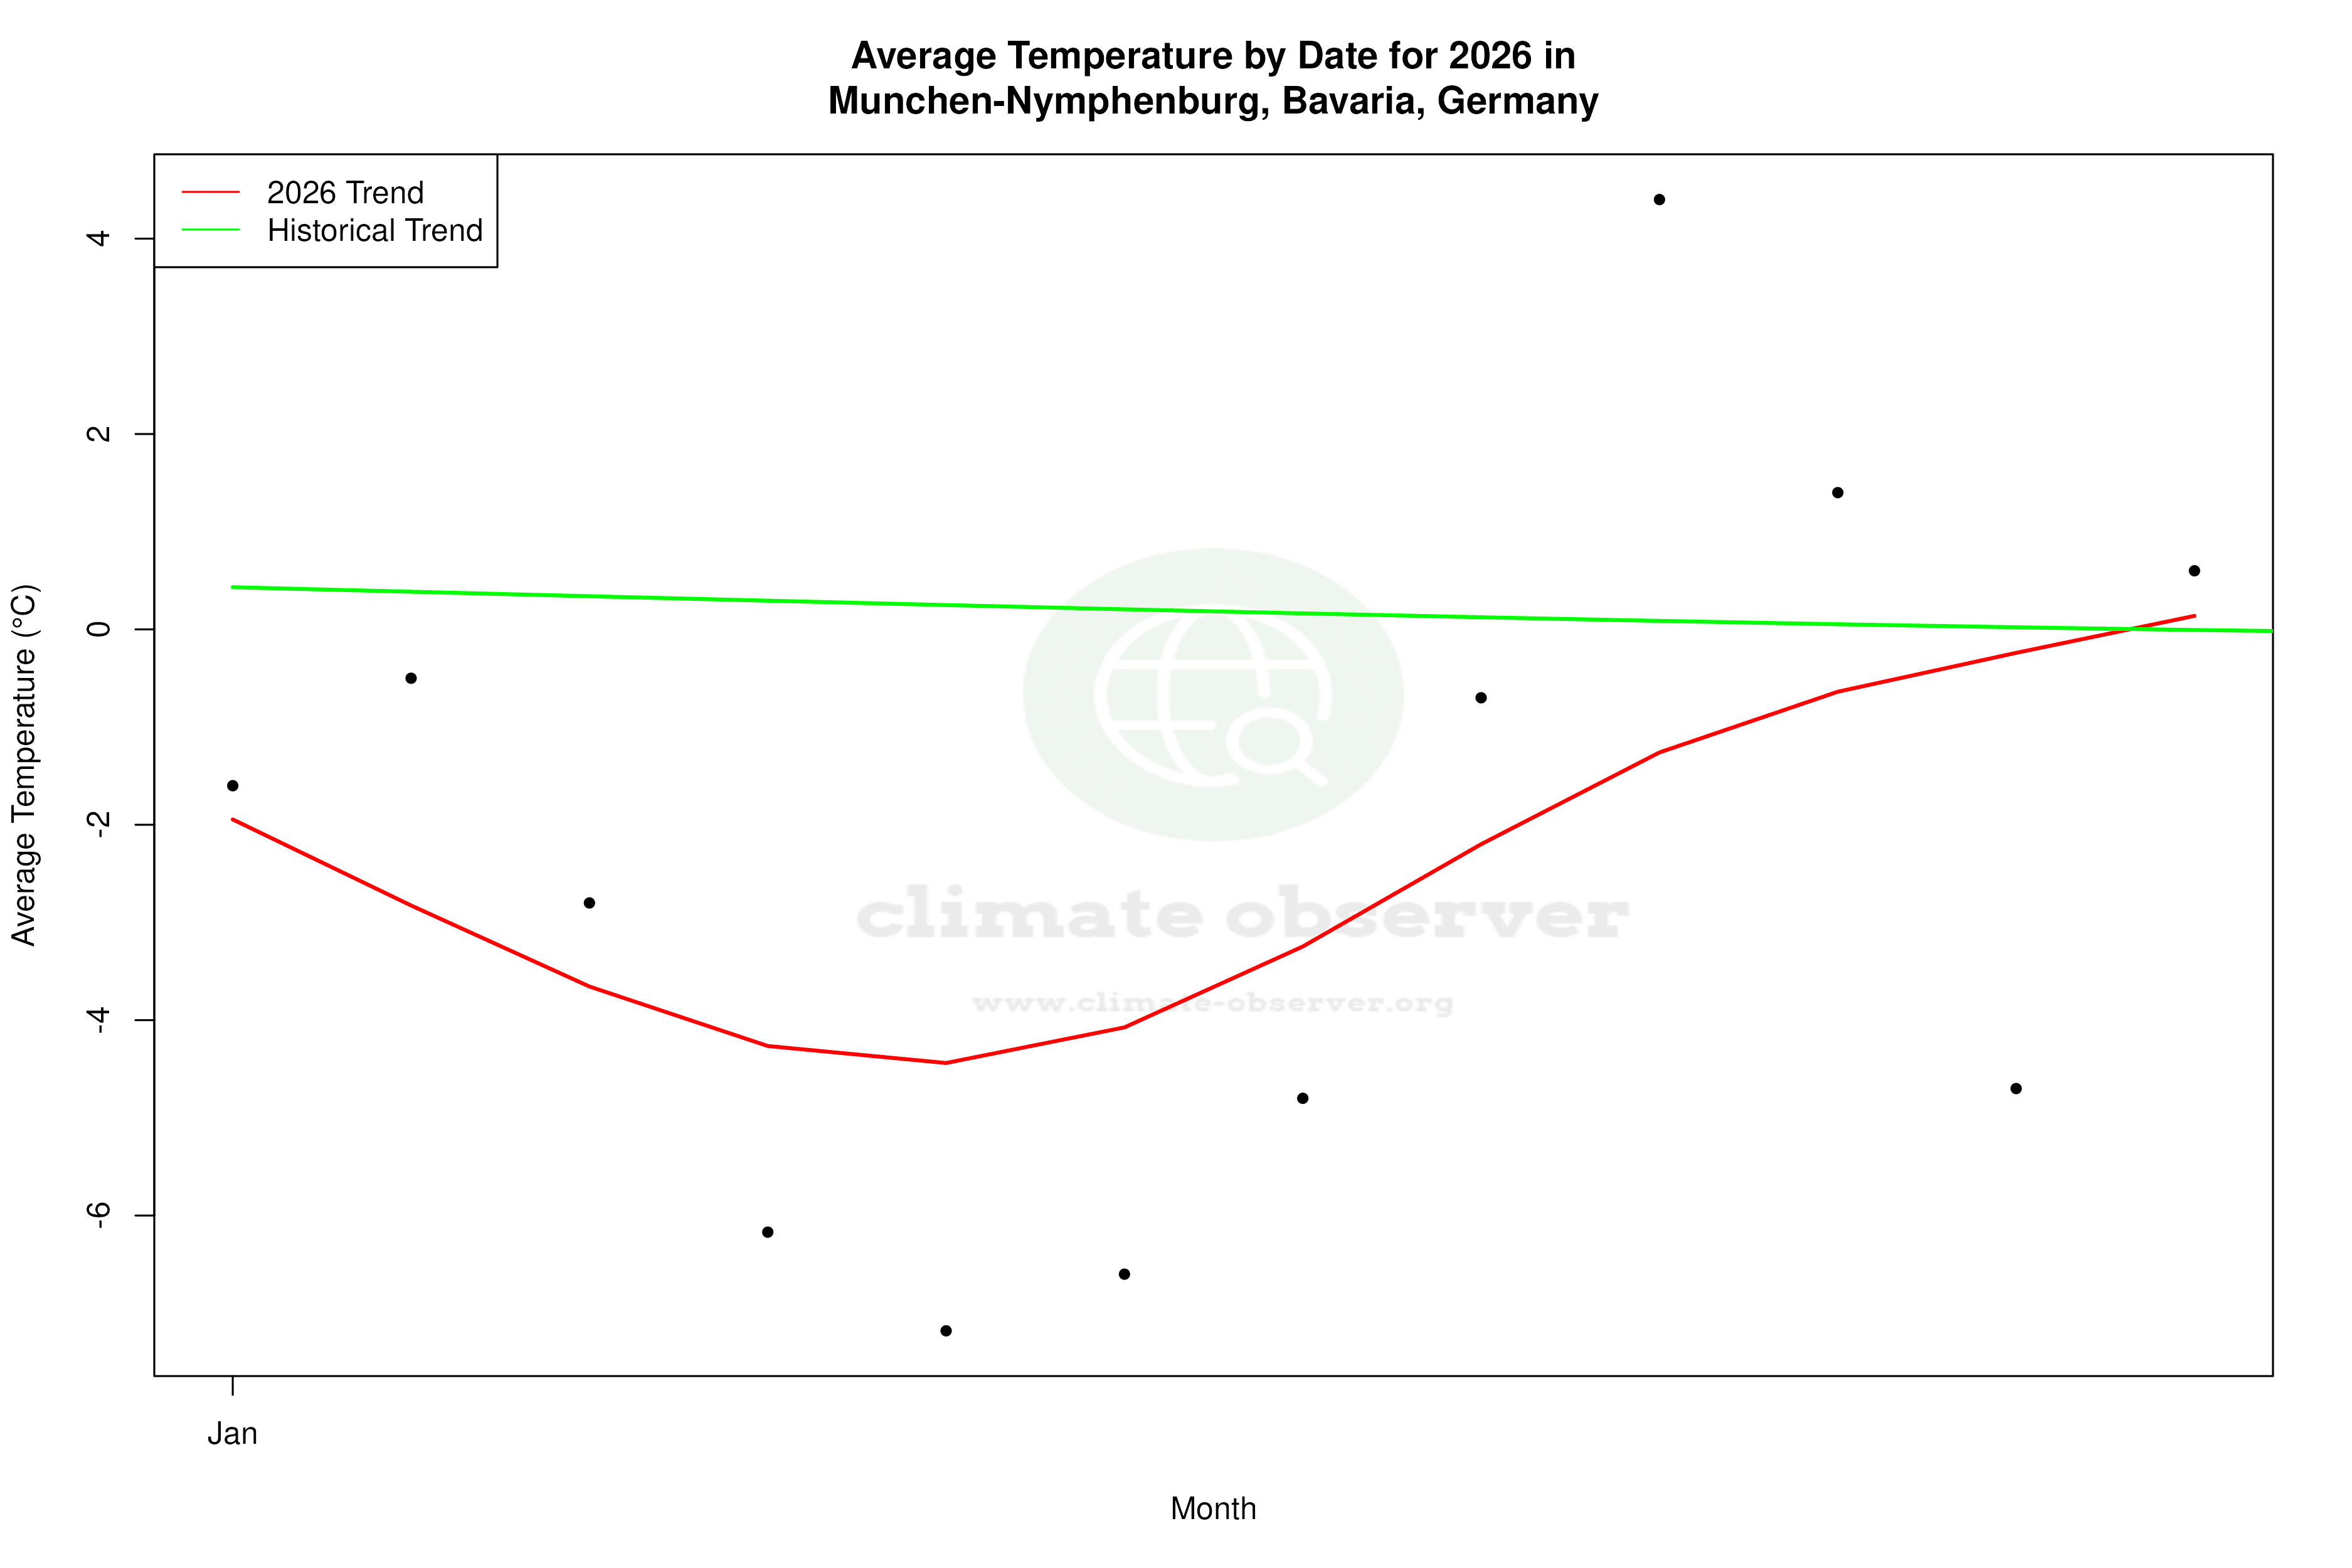
München-Nymphenburg, nestled in the temperate climate zone of Bavaria, Germany, is classified under the Köppen climate system as Cfb, indicating a temperate oceanic climate with warm summers and no dry season. Over the past decade, the region has experienced a noticeable warming trend. High temperatures have increased by 0.64°C (1.15°F), while low temperatures have risen by 0.54°C (0.97°F). This short-term trend is more pronounced than the all-time trend, where highs have risen by 0.18°C (0.32°F) and lows by 0.16°C (0.28°F). These figures suggest a consistent warming pattern, which is crucial for understanding local climate dynamics and planning for future climate resilience.
Precipitation Patterns: A Subtle Shift
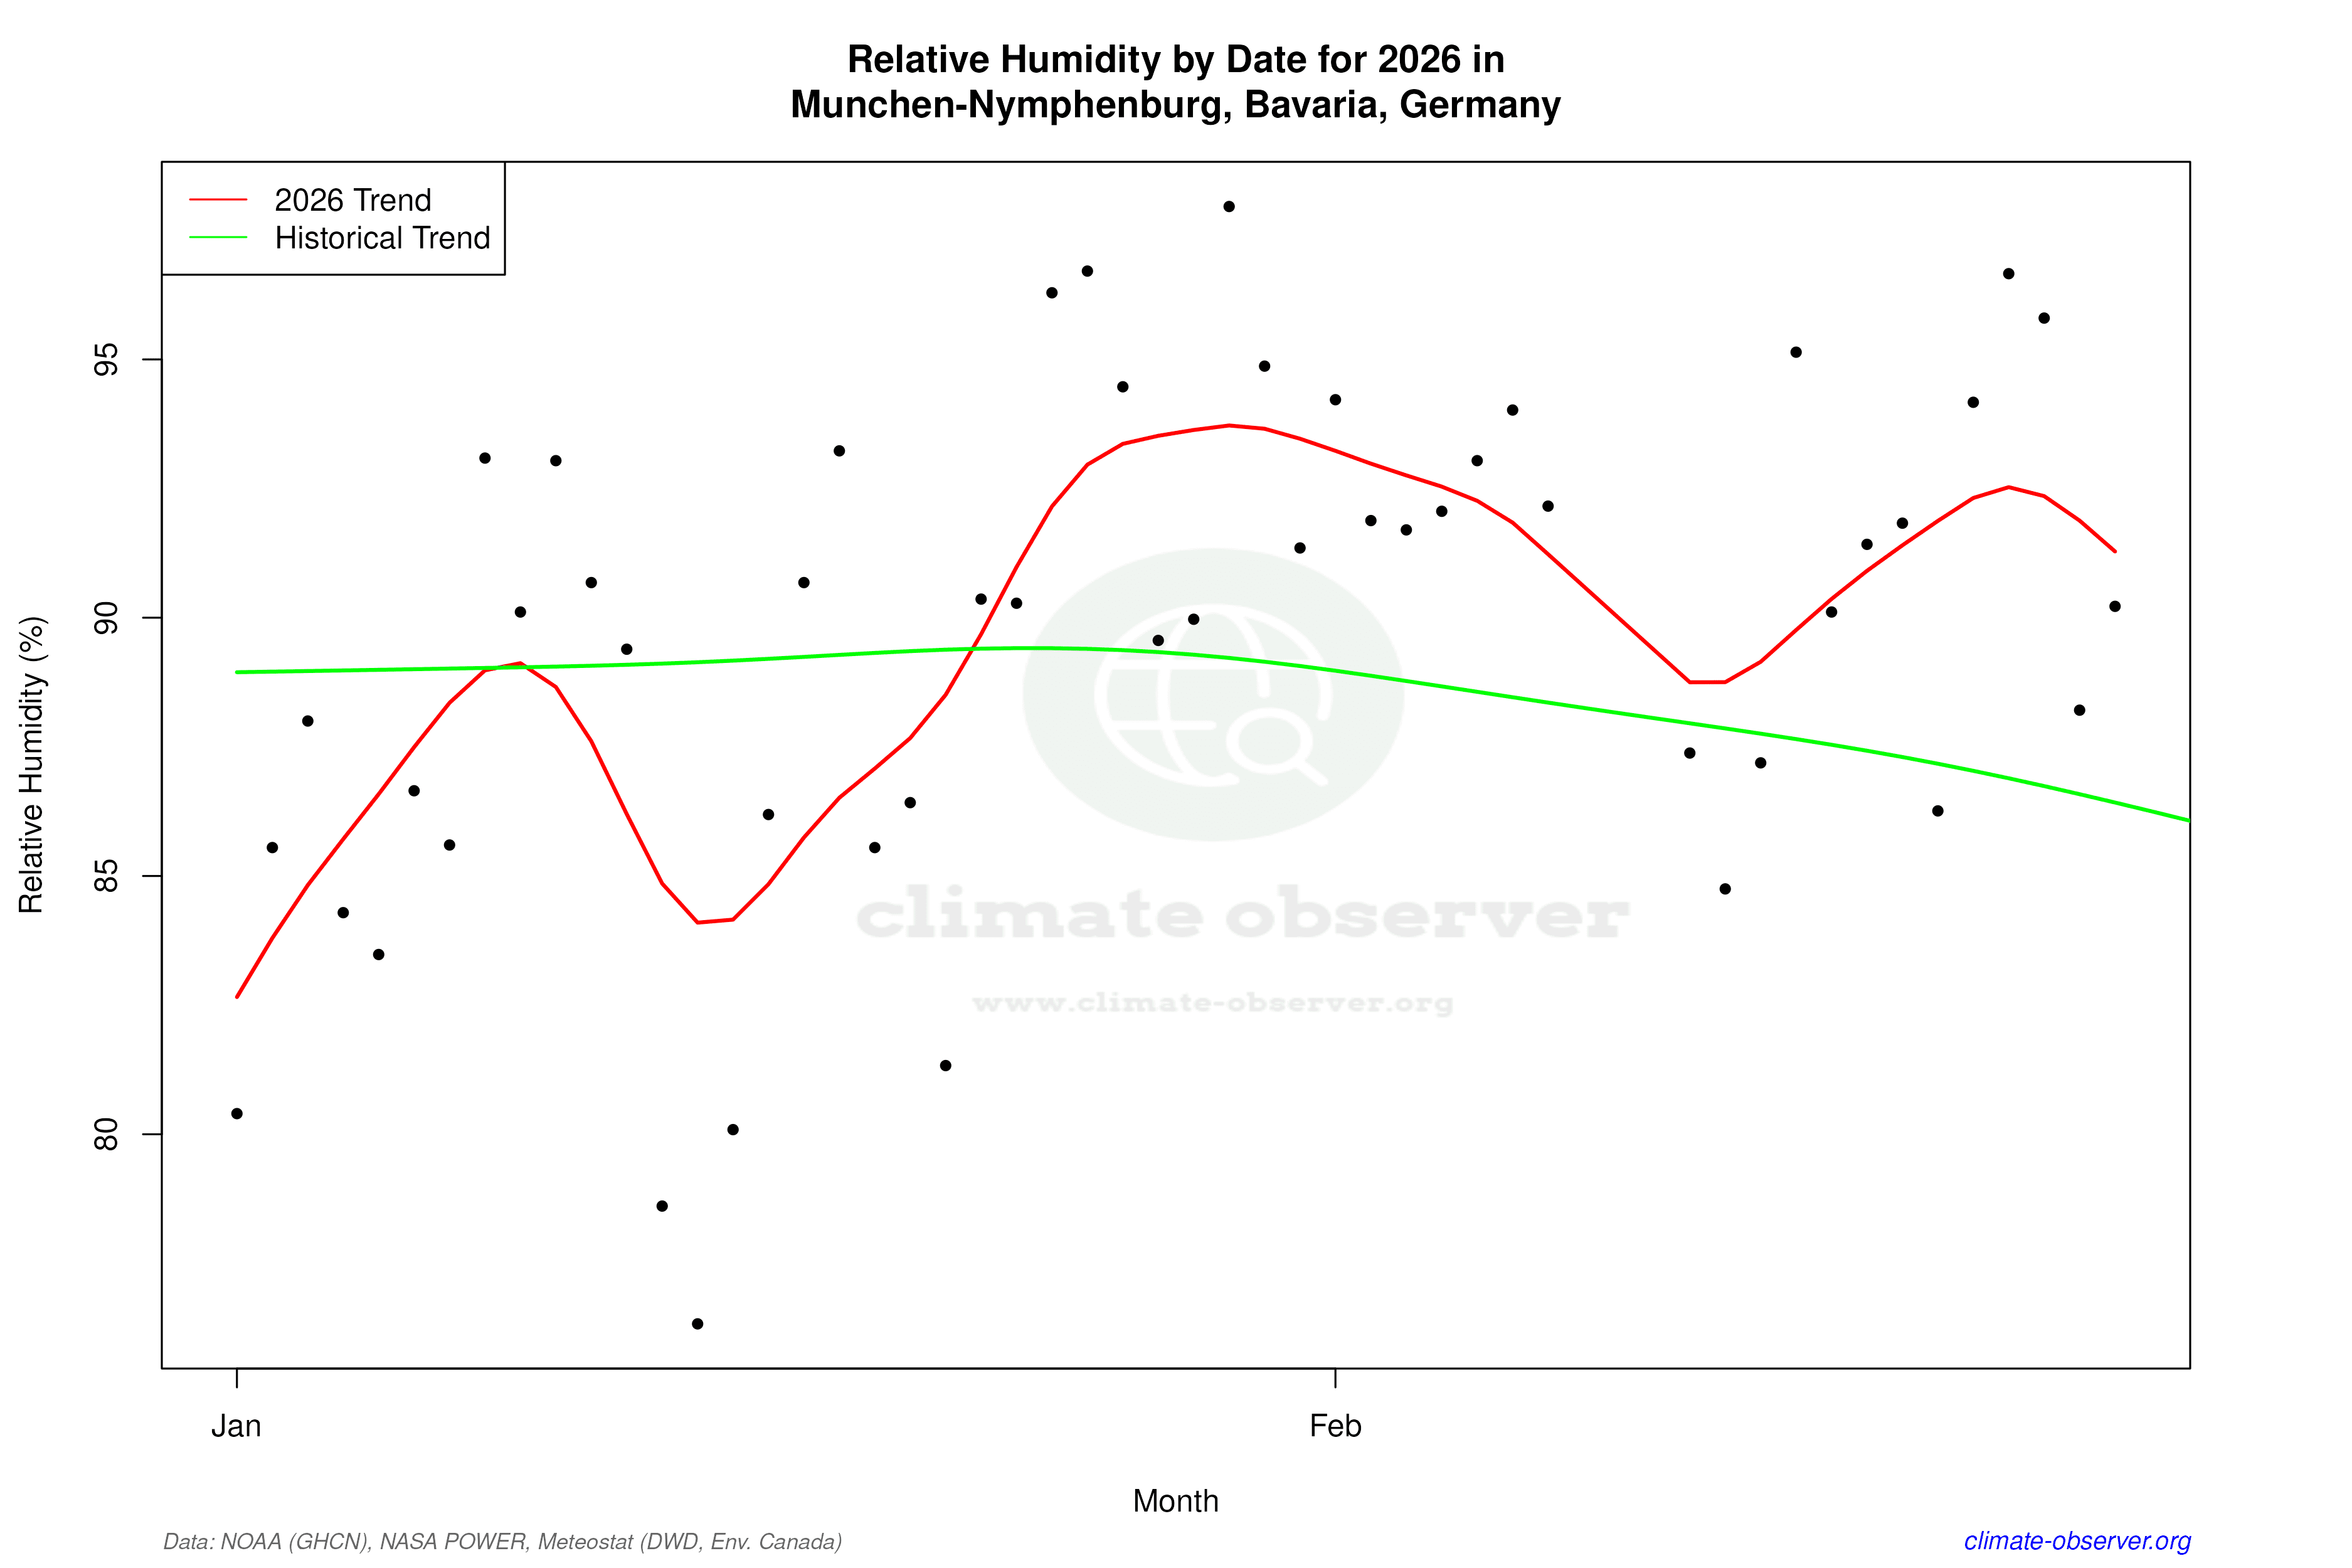
The Precipitation Concentration Index (PCI) provides insight into how rainfall is distributed throughout the year. A decrease in PCI from a baseline of 11.33 to the current 10.76 indicates that precipitation in München-Nymphenburg is becoming slightly more evenly distributed. This subtle shift suggests a reduction in the intensity of rain events, potentially leading to fewer instances of flooding—a positive development in line with Germany's regional climate adaptation strategies.
Temperature Extremes: Records and Realities
München-Nymphenburg has experienced significant temperature extremes, with historical records showing a maximum of 37.0°C (98.6°F) and a minimum of -29.0°C (-20.2°F). These extremes highlight the potential for significant weather variability, which can impact local agriculture, infrastructure, and daily life. Understanding these extremes is vital for developing robust strategies to mitigate the impacts of climate variability.
Geographical Influences on Climate
The region's geography plays a crucial role in its climate characteristics. Situated near the Alps, München-Nymphenburg benefits from the moderating effects of these mountains, which can buffer temperature extremes and influence precipitation patterns. This geographic context, combined with the observed warming trends, underscores the importance of considering both natural and anthropogenic factors in climate assessments.
Aligning with Regional Climate Goals
Germany's commitment to reducing greenhouse gas emissions and adapting to climate change is reflected in the observed trends in München-Nymphenburg. The warming patterns and more evenly distributed precipitation align with national efforts to mitigate the effects of climate change, such as reducing the frequency and severity of extreme weather events. These local observations contribute to the broader understanding of climate dynamics in Bavaria and beyond.
Station Statistics
10-Year Trend
High: +0.09 °C/decade
Low: +0.20 °C/decade
Rain: -0.01 mm/decade
25-Year Trend
High: +0.70 °C/decade
Low: +0.44 °C/decade
Rain: +0.02 mm/decade
50-Year Trend
High: +0.71 °C/decade
Low: +0.67 °C/decade
Rain: -0.02 mm/decade
All-Time Trend
High: +0.18 °C/decade
Low: +0.15 °C/decade
Rain: +0.01 mm/decade
Percentage Above-Average Days
Last 12 Months: 56.7%
This Year: 62.4%
Precipitation Concentration Index (PCI) ℹ️
Last 12 Months: 9.4
Historical Average: 11.2
Percentile Rank of Last 12 Months ℹ️
High: 90th percentile
Low: 91st percentile
Rain: 14th percentile
Change in Variance ℹ️
High: -3.1%
Low: -15.0%
Intraday: -2.2%
Data Coverage
88.8%
First Year of Data
1879
Station Location
Historical Weather Records
| Max High | Avg High | Min High | Max Avg | Avg Avg | Min Avg | Max Low | Avg Low | Min Low | Max Precipitation | Avg Precipitation | Max Snow | Avg Snow | |
|---|---|---|---|---|---|---|---|---|---|---|---|---|---|
| Record | 37.0 °C | — | -18.8 °C | 29.8 °C | — | -20.0 °C | 22.1 °C | — | -29.0 °C | 155.2 mm | — | — | — |
| January | 18.5 °C | 2.2 °C | -17.7 °C | 13.6 °C | 0.1 °C | -18.7 °C | 10.6 °C | -4.1 °C | -29.0 °C | 50.9 mm | 1.6 mm | — | — |
| February | 21.0 °C | 4.2 °C | -18.2 °C | 13.9 °C | 1.2 °C | -20.0 °C | 10.3 °C | -3.3 °C | -28.0 °C | 41.2 mm | 1.5 mm | — | — |
| March | 24.0 °C | 8.9 °C | -10.0 °C | 17.7 °C | 5.0 °C | -11.7 °C | 12.5 °C | -0.1 °C | -20.3 °C | 53.6 mm | 1.7 mm | — | — |
| April | 32.2 °C | 13.4 °C | -1.7 °C | 23.3 °C | 9.1 °C | -2.1 °C | 14.4 °C | 3.4 °C | -10.0 °C | 60.1 mm | 2.3 mm | — | — |
| May | 32.2 °C | 18.2 °C | 2.6 °C | 24.9 °C | 13.5 °C | 0.6 °C | 18.1 °C | 7.6 °C | -5.5 °C | 155.2 mm | 3.3 mm | — | — |
| June | 35.2 °C | 21.5 °C | 7.4 °C | 29.7 °C | 17.2 °C | 4.5 °C | 22.1 °C | 11.0 °C | -0.1 °C | 91.5 mm | 4.1 mm | — | — |
| July | 36.9 °C | 23.4 °C | 9.2 °C | 29.8 °C | 18.9 °C | 8.5 °C | 21.5 °C | 12.9 °C | 3.7 °C | 92.4 mm | 4.0 mm | — | — |
| August | 37.0 °C | 22.9 °C | 10.5 °C | 29.2 °C | 18.4 °C | 8.7 °C | 22.0 °C | 12.4 °C | 3.2 °C | 101.6 mm | 3.7 mm | — | — |
| September | 32.0 °C | 19.1 °C | 5.0 °C | 24.0 °C | 14.8 °C | 3.3 °C | 19.6 °C | 9.2 °C | -2.5 °C | 111.5 mm | 2.8 mm | — | — |
| October | 28.2 °C | 13.4 °C | -0.7 °C | 21.3 °C | 9.7 °C | -1.7 °C | 16.5 °C | 4.8 °C | -8.2 °C | 40.3 mm | 2.0 mm | — | — |
| November | 24.1 °C | 6.9 °C | -9.1 °C | 17.4 °C | 4.4 °C | -7.2 °C | 15.4 °C | 0.6 °C | -14.0 °C | 43.4 mm | 1.8 mm | — | — |
| December | 20.0 °C | 3.1 °C | -18.8 °C | 14.9 °C | 1.0 °C | -17.4 °C | 11.0 °C | -2.7 °C | -24.0 °C | 70.9 mm | 1.8 mm | — | — |
Data Visualisations
Remove WatermarksCurrent Year Climate Trends vs Historical

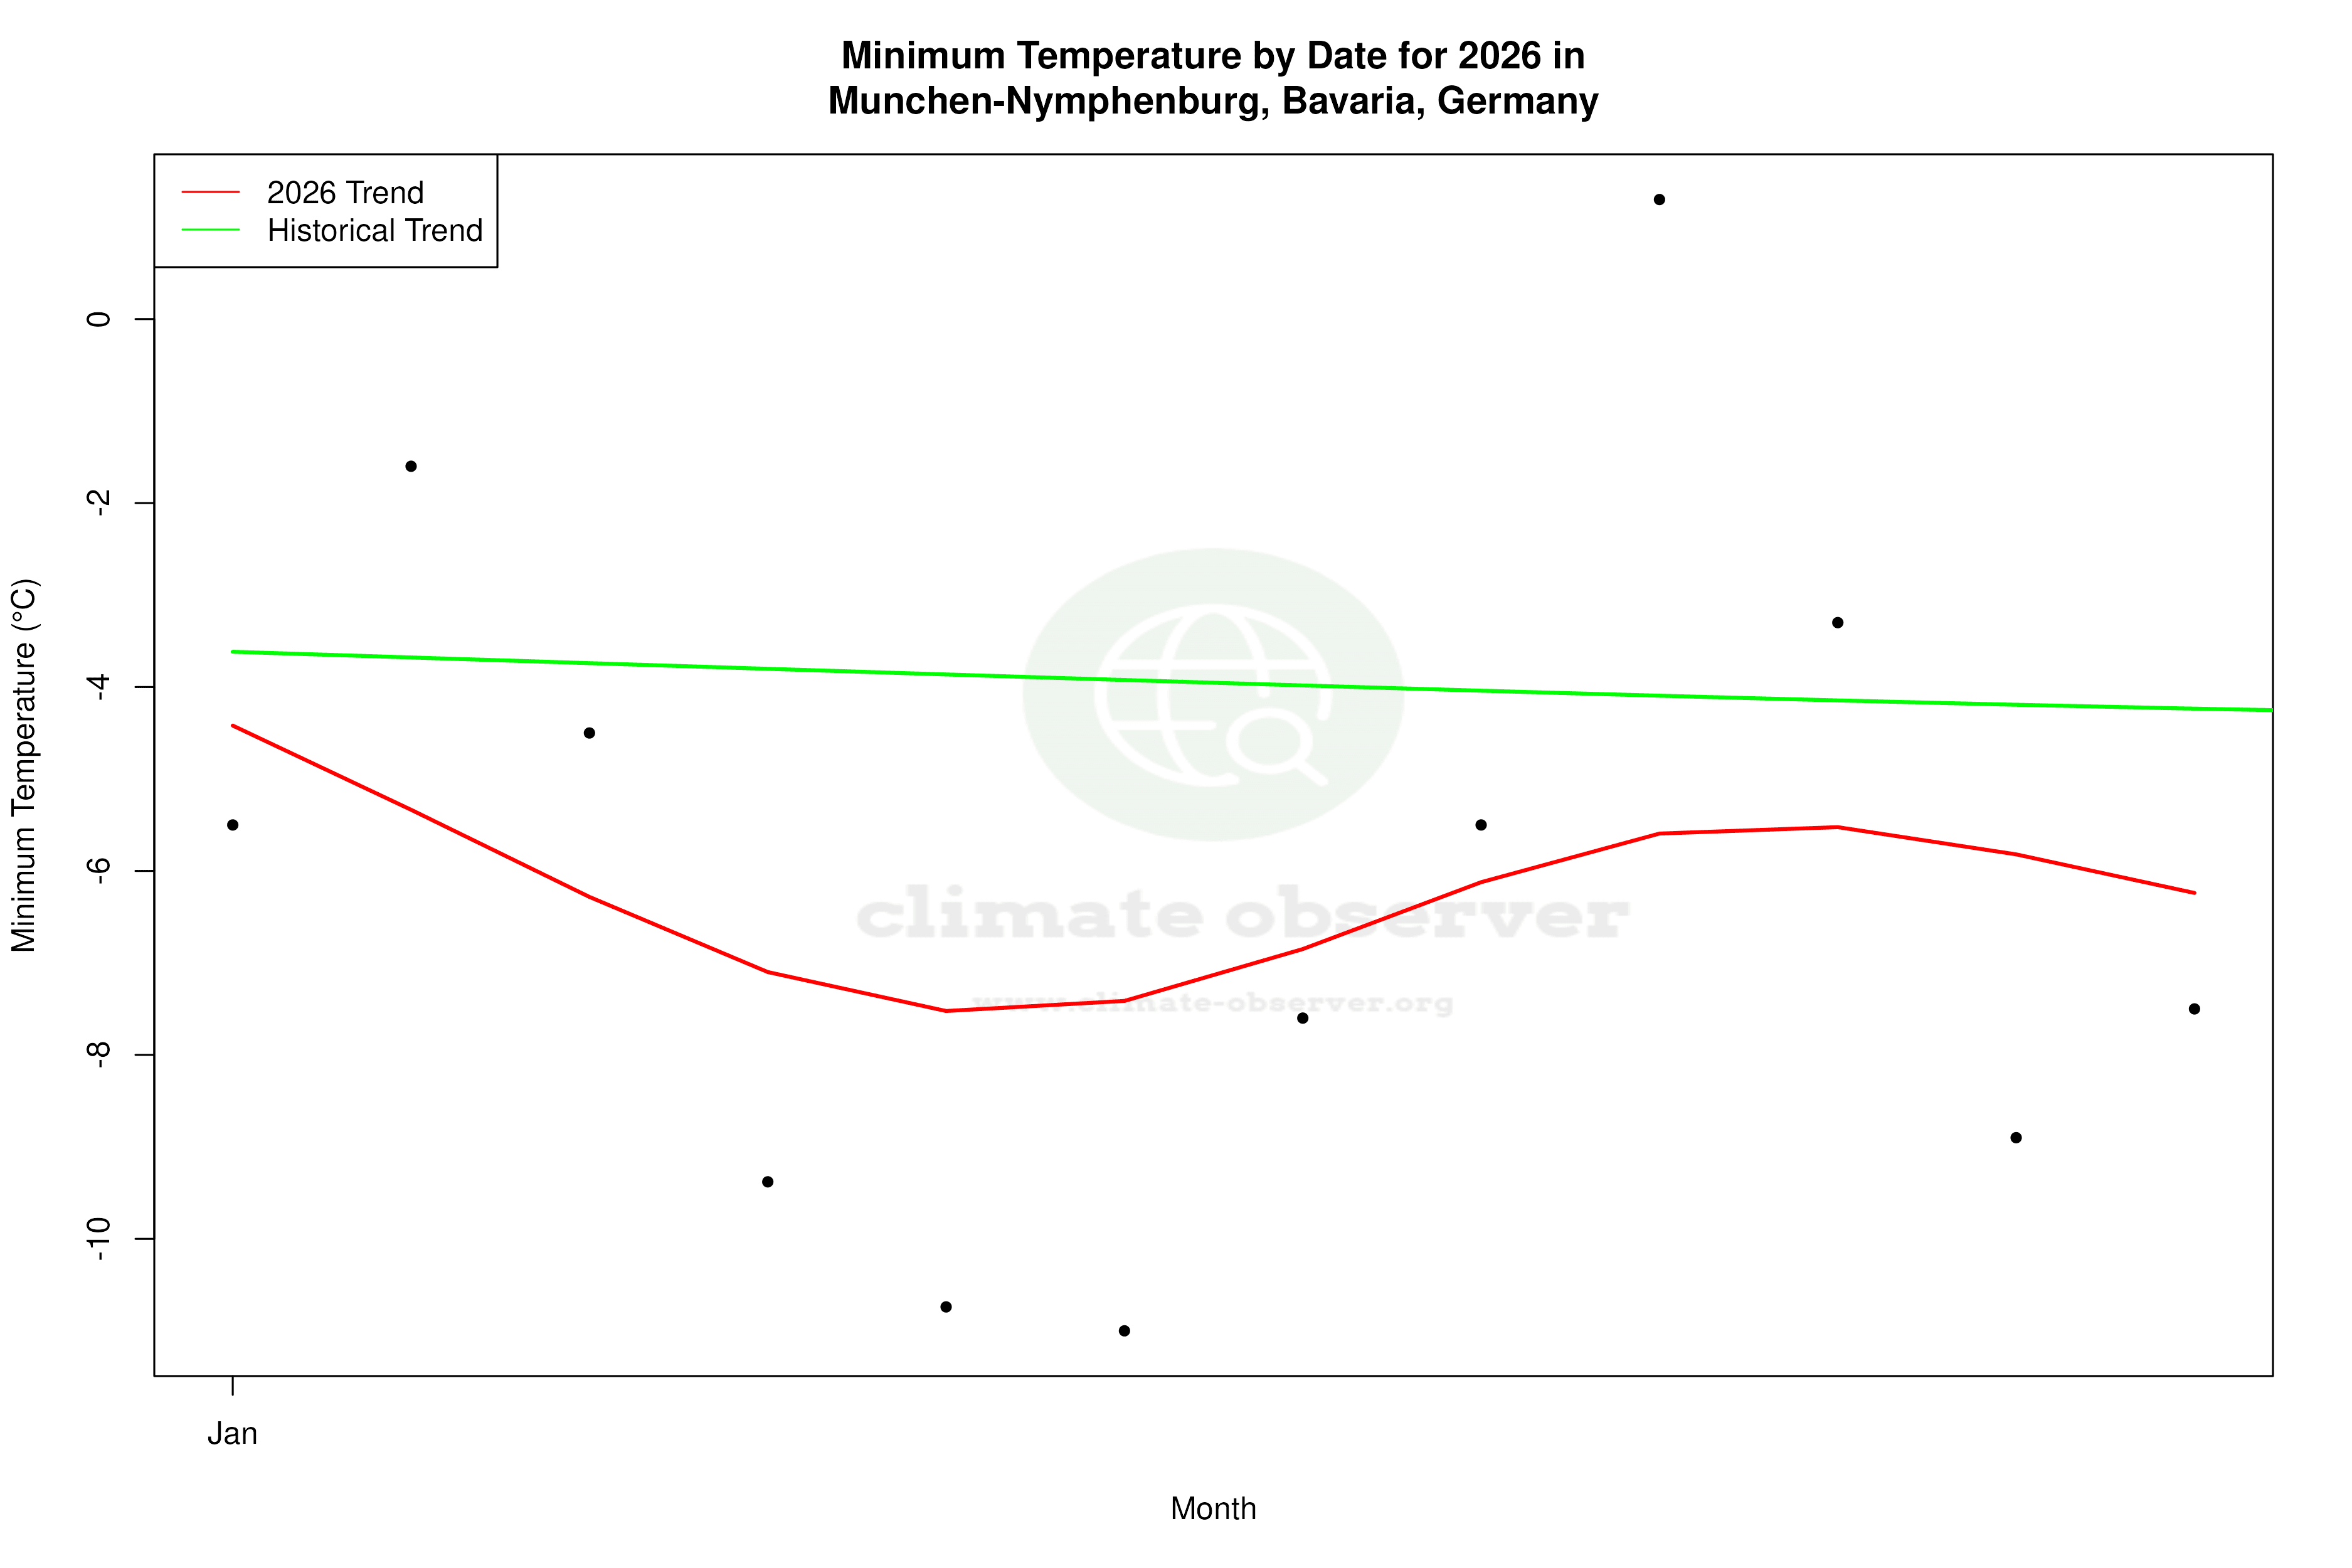


Max Temperature this Year | 1 of 6
Climate 12-Month Moving Averages

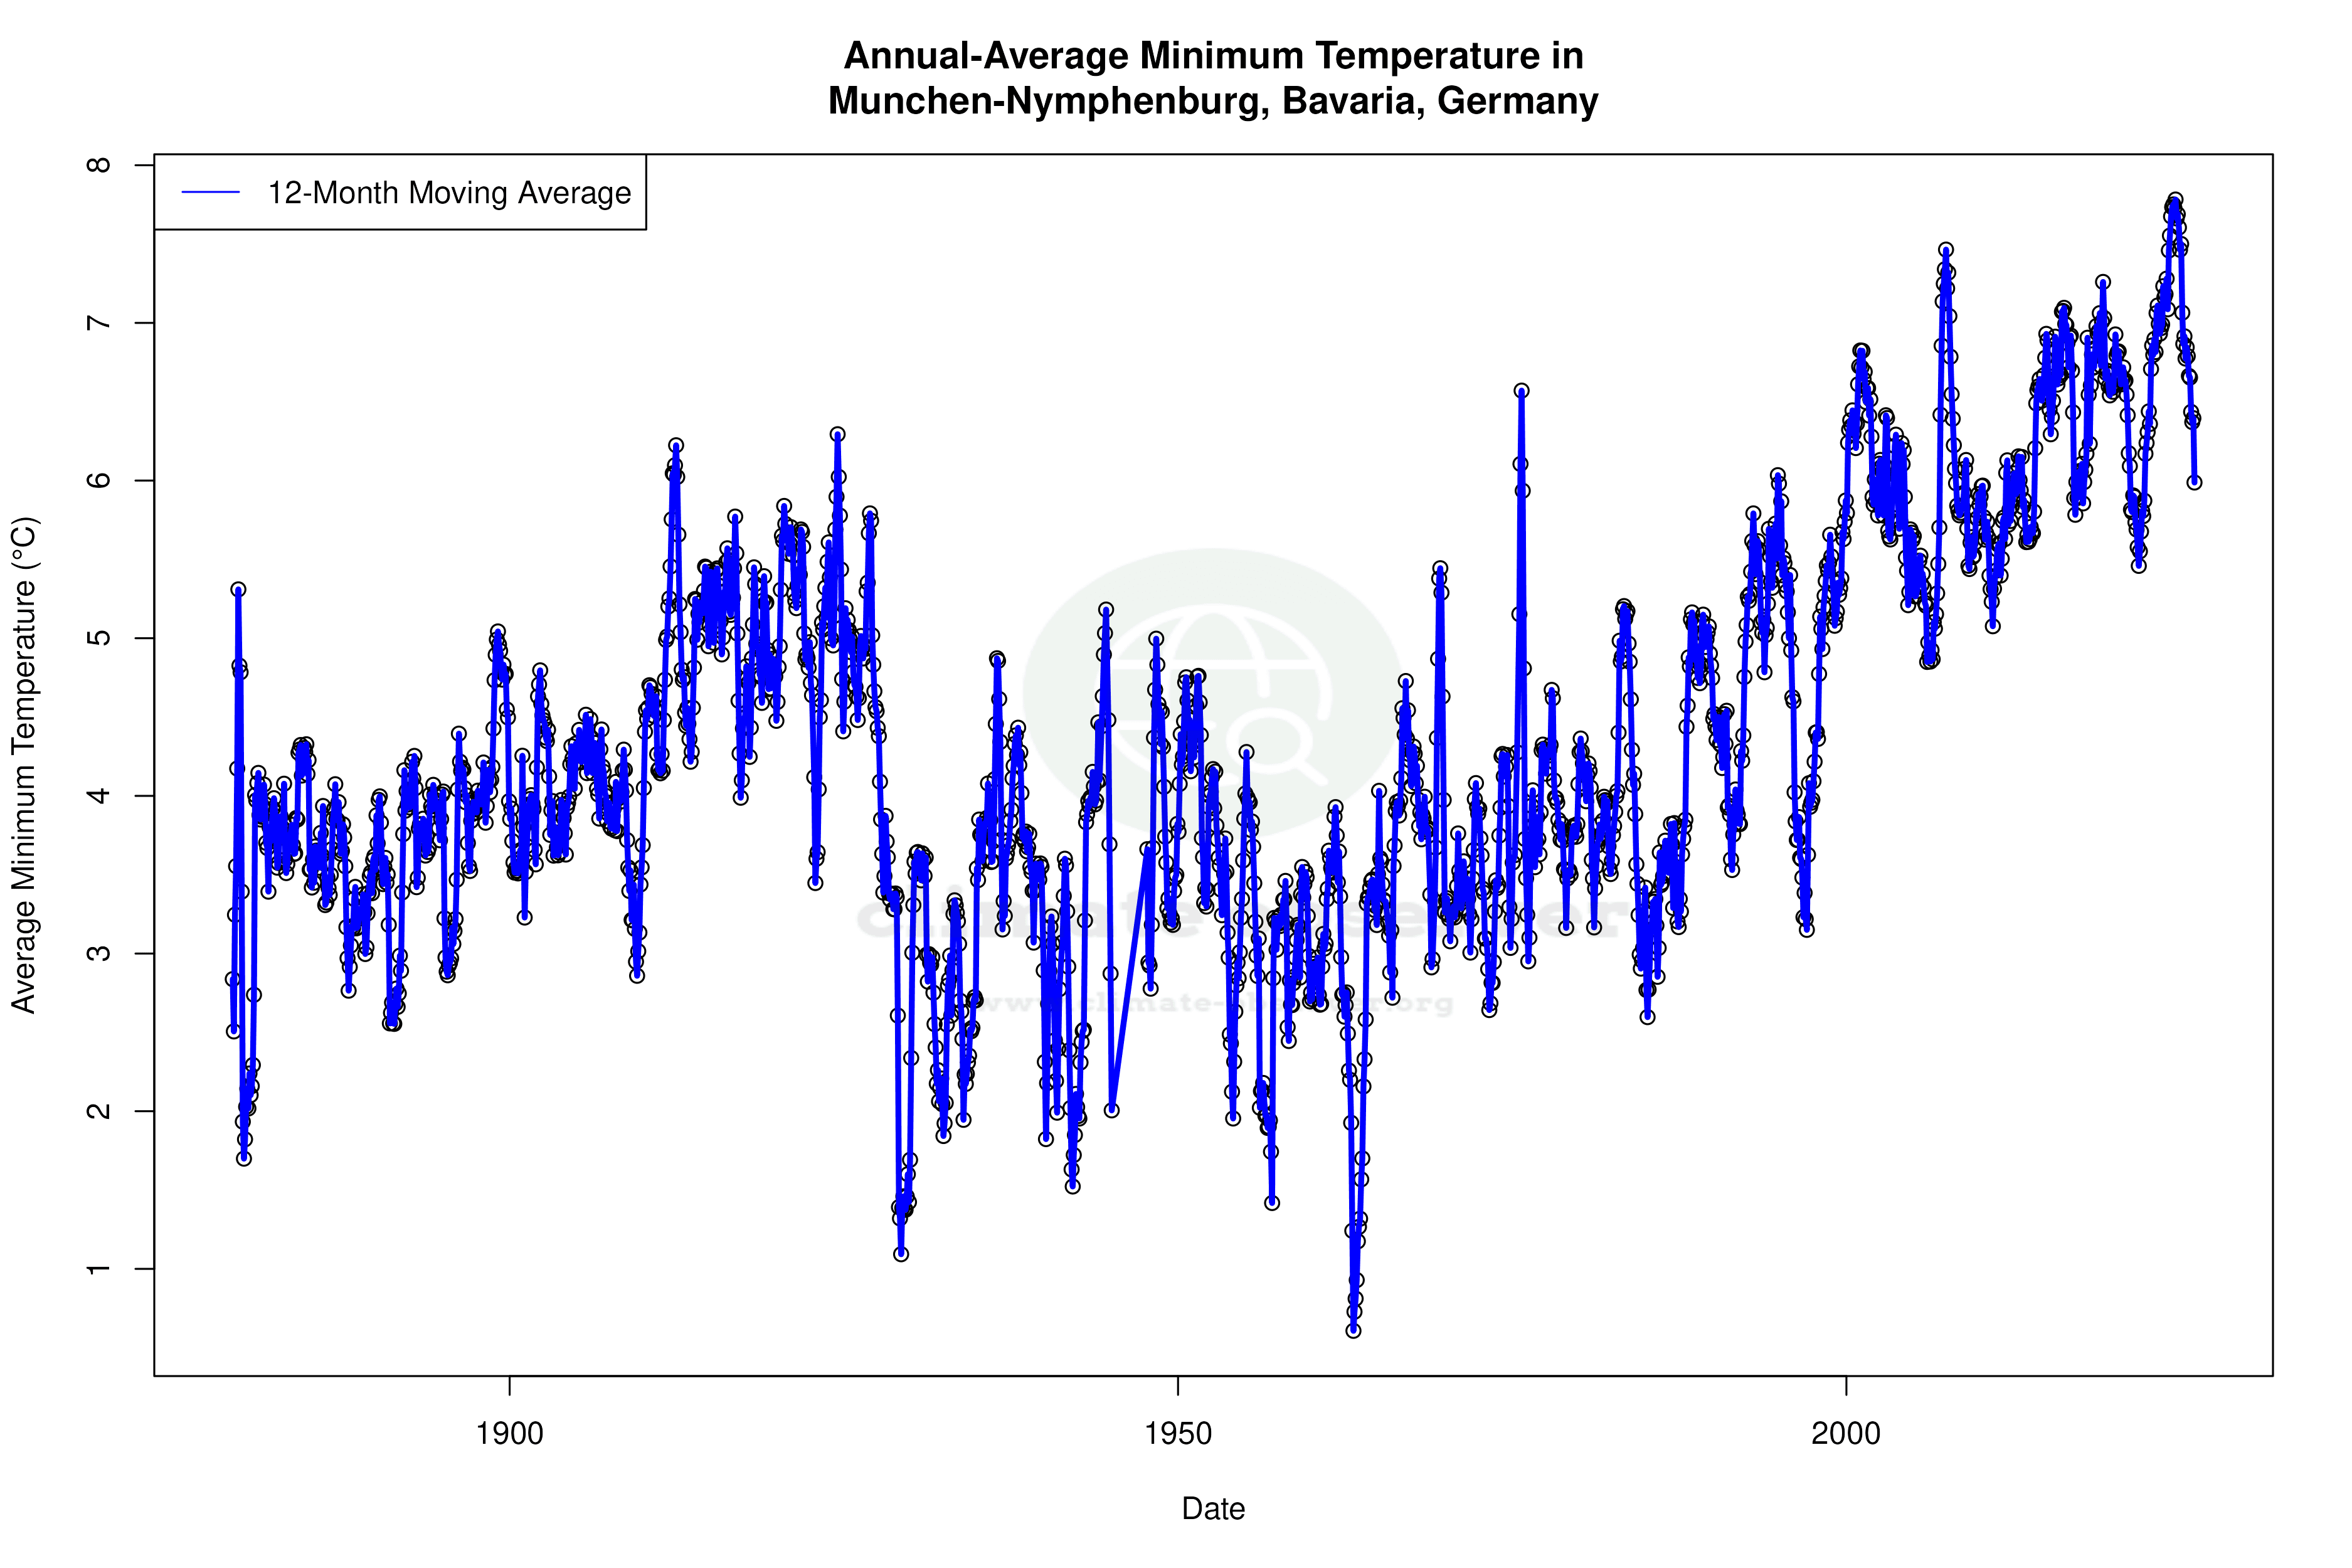
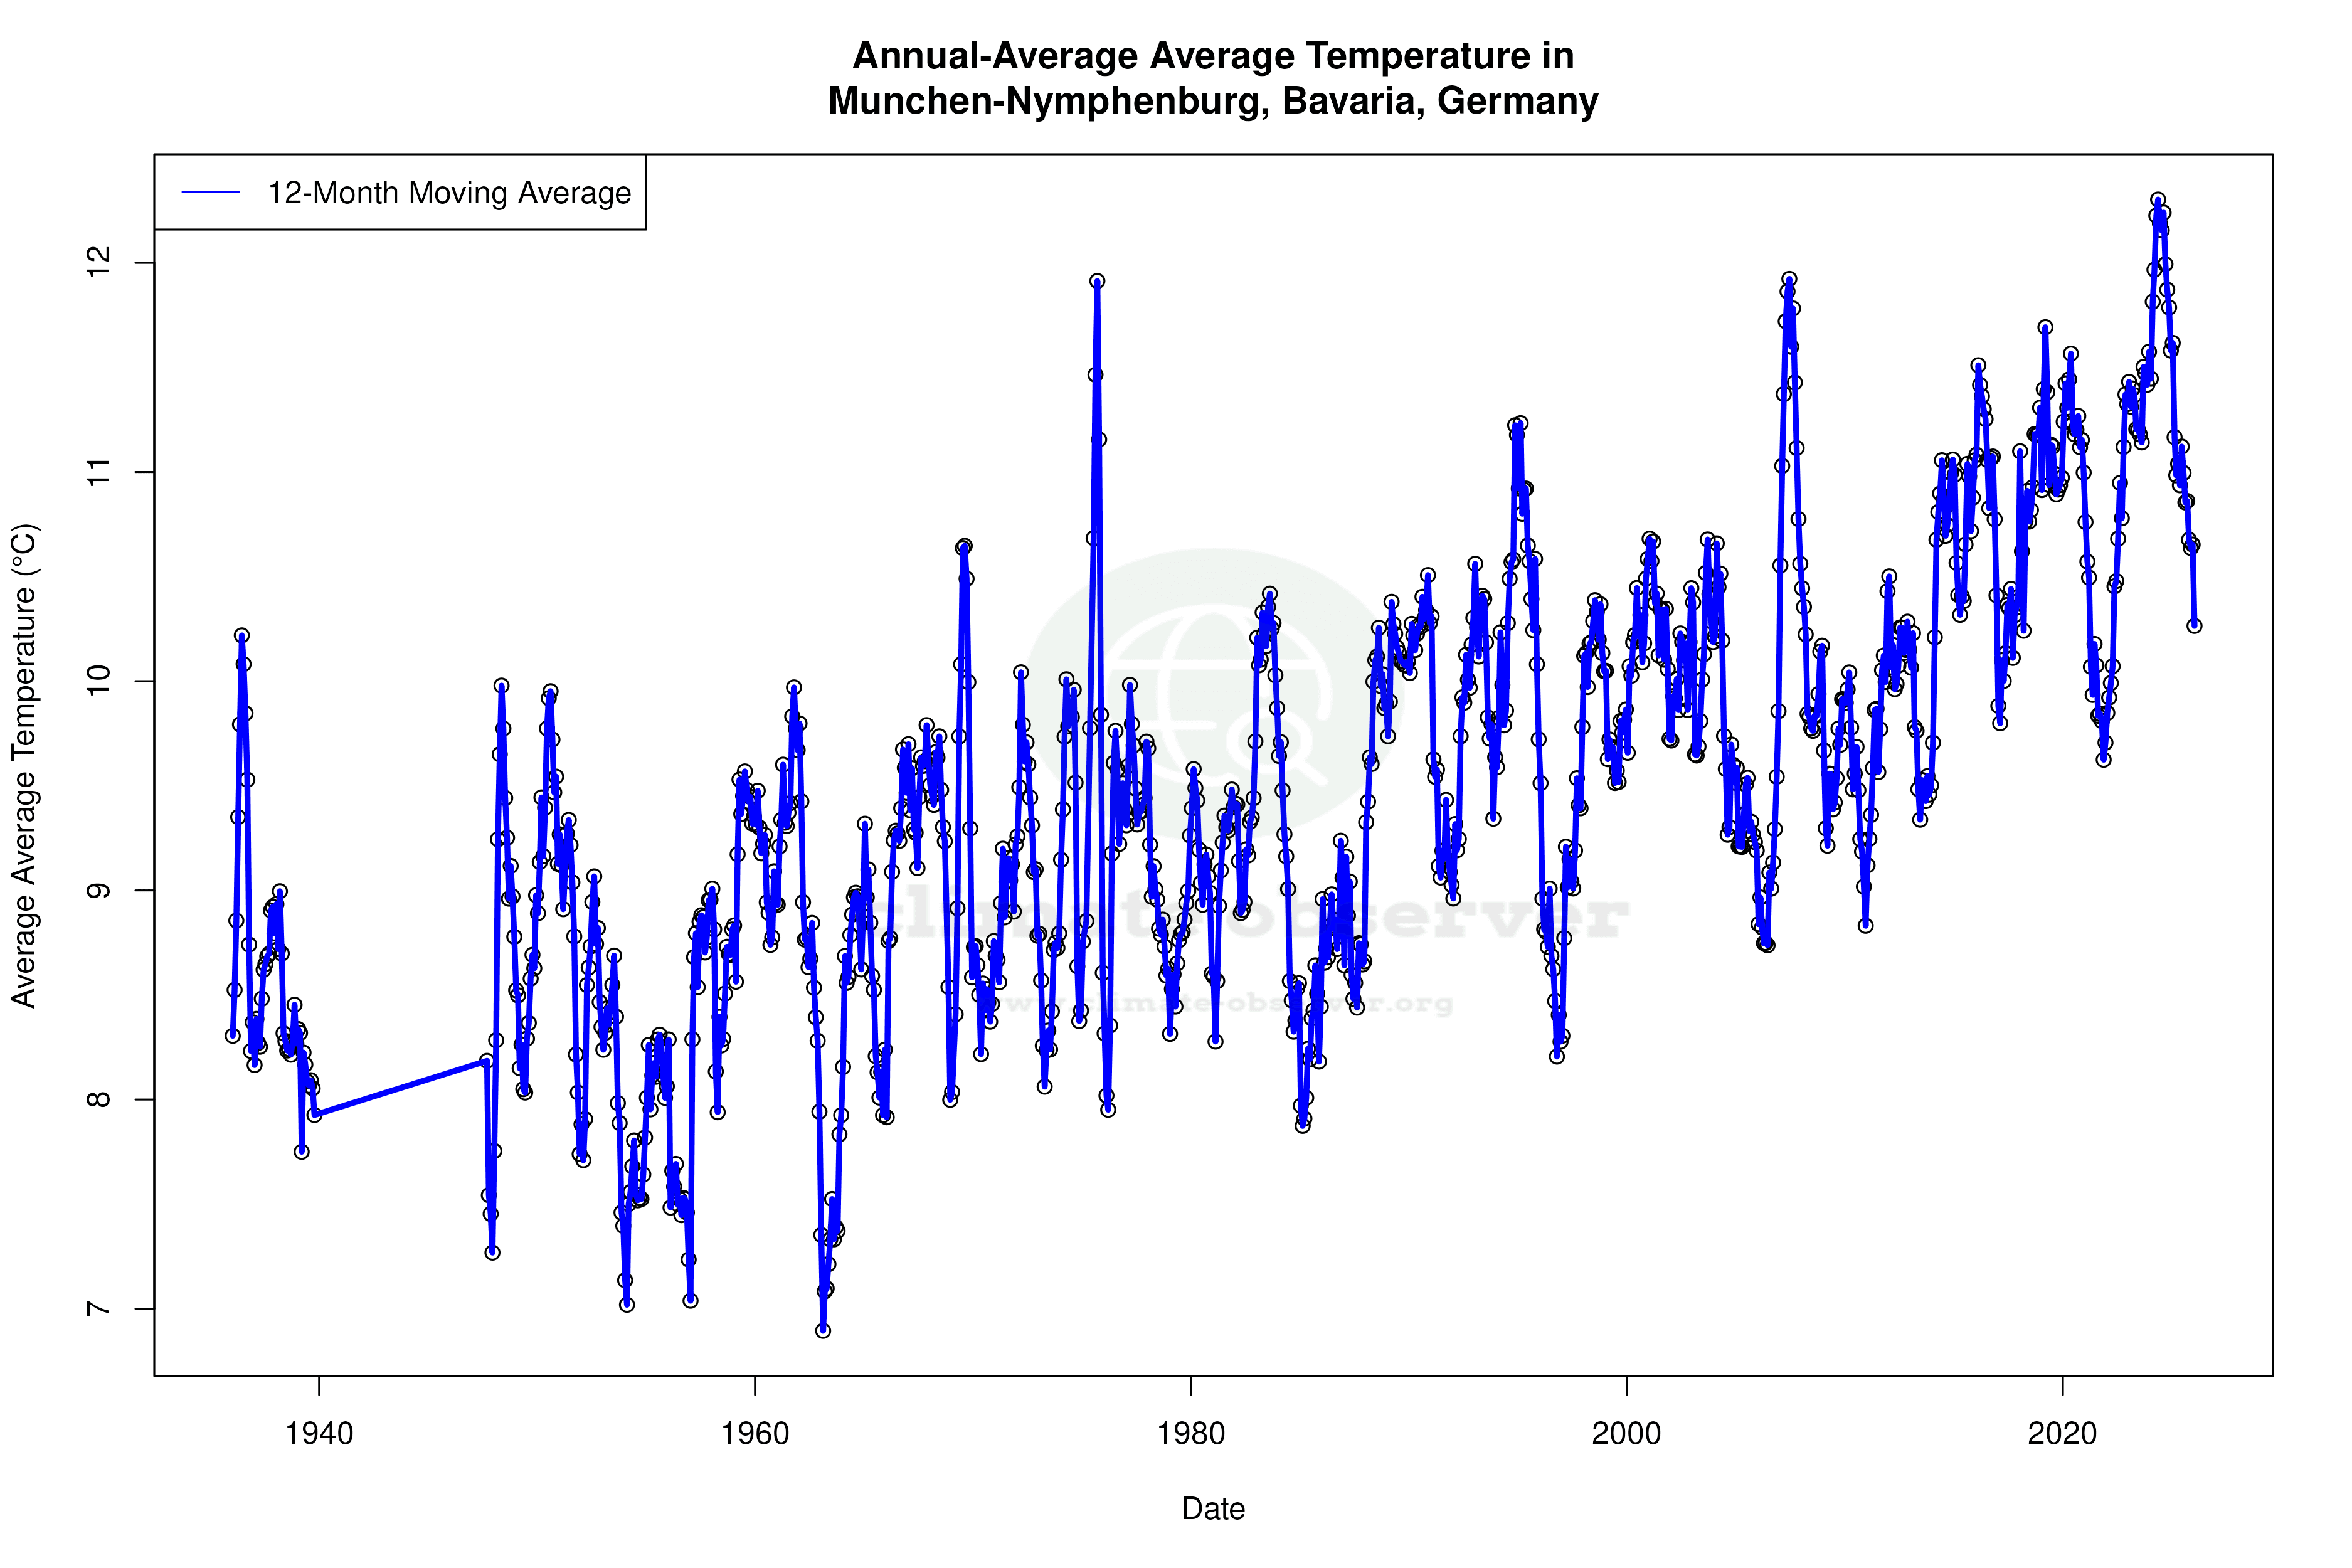


Max Temperature 12-Month MA | 1 of 6
Daily Data Points and Averages Throughout the Year
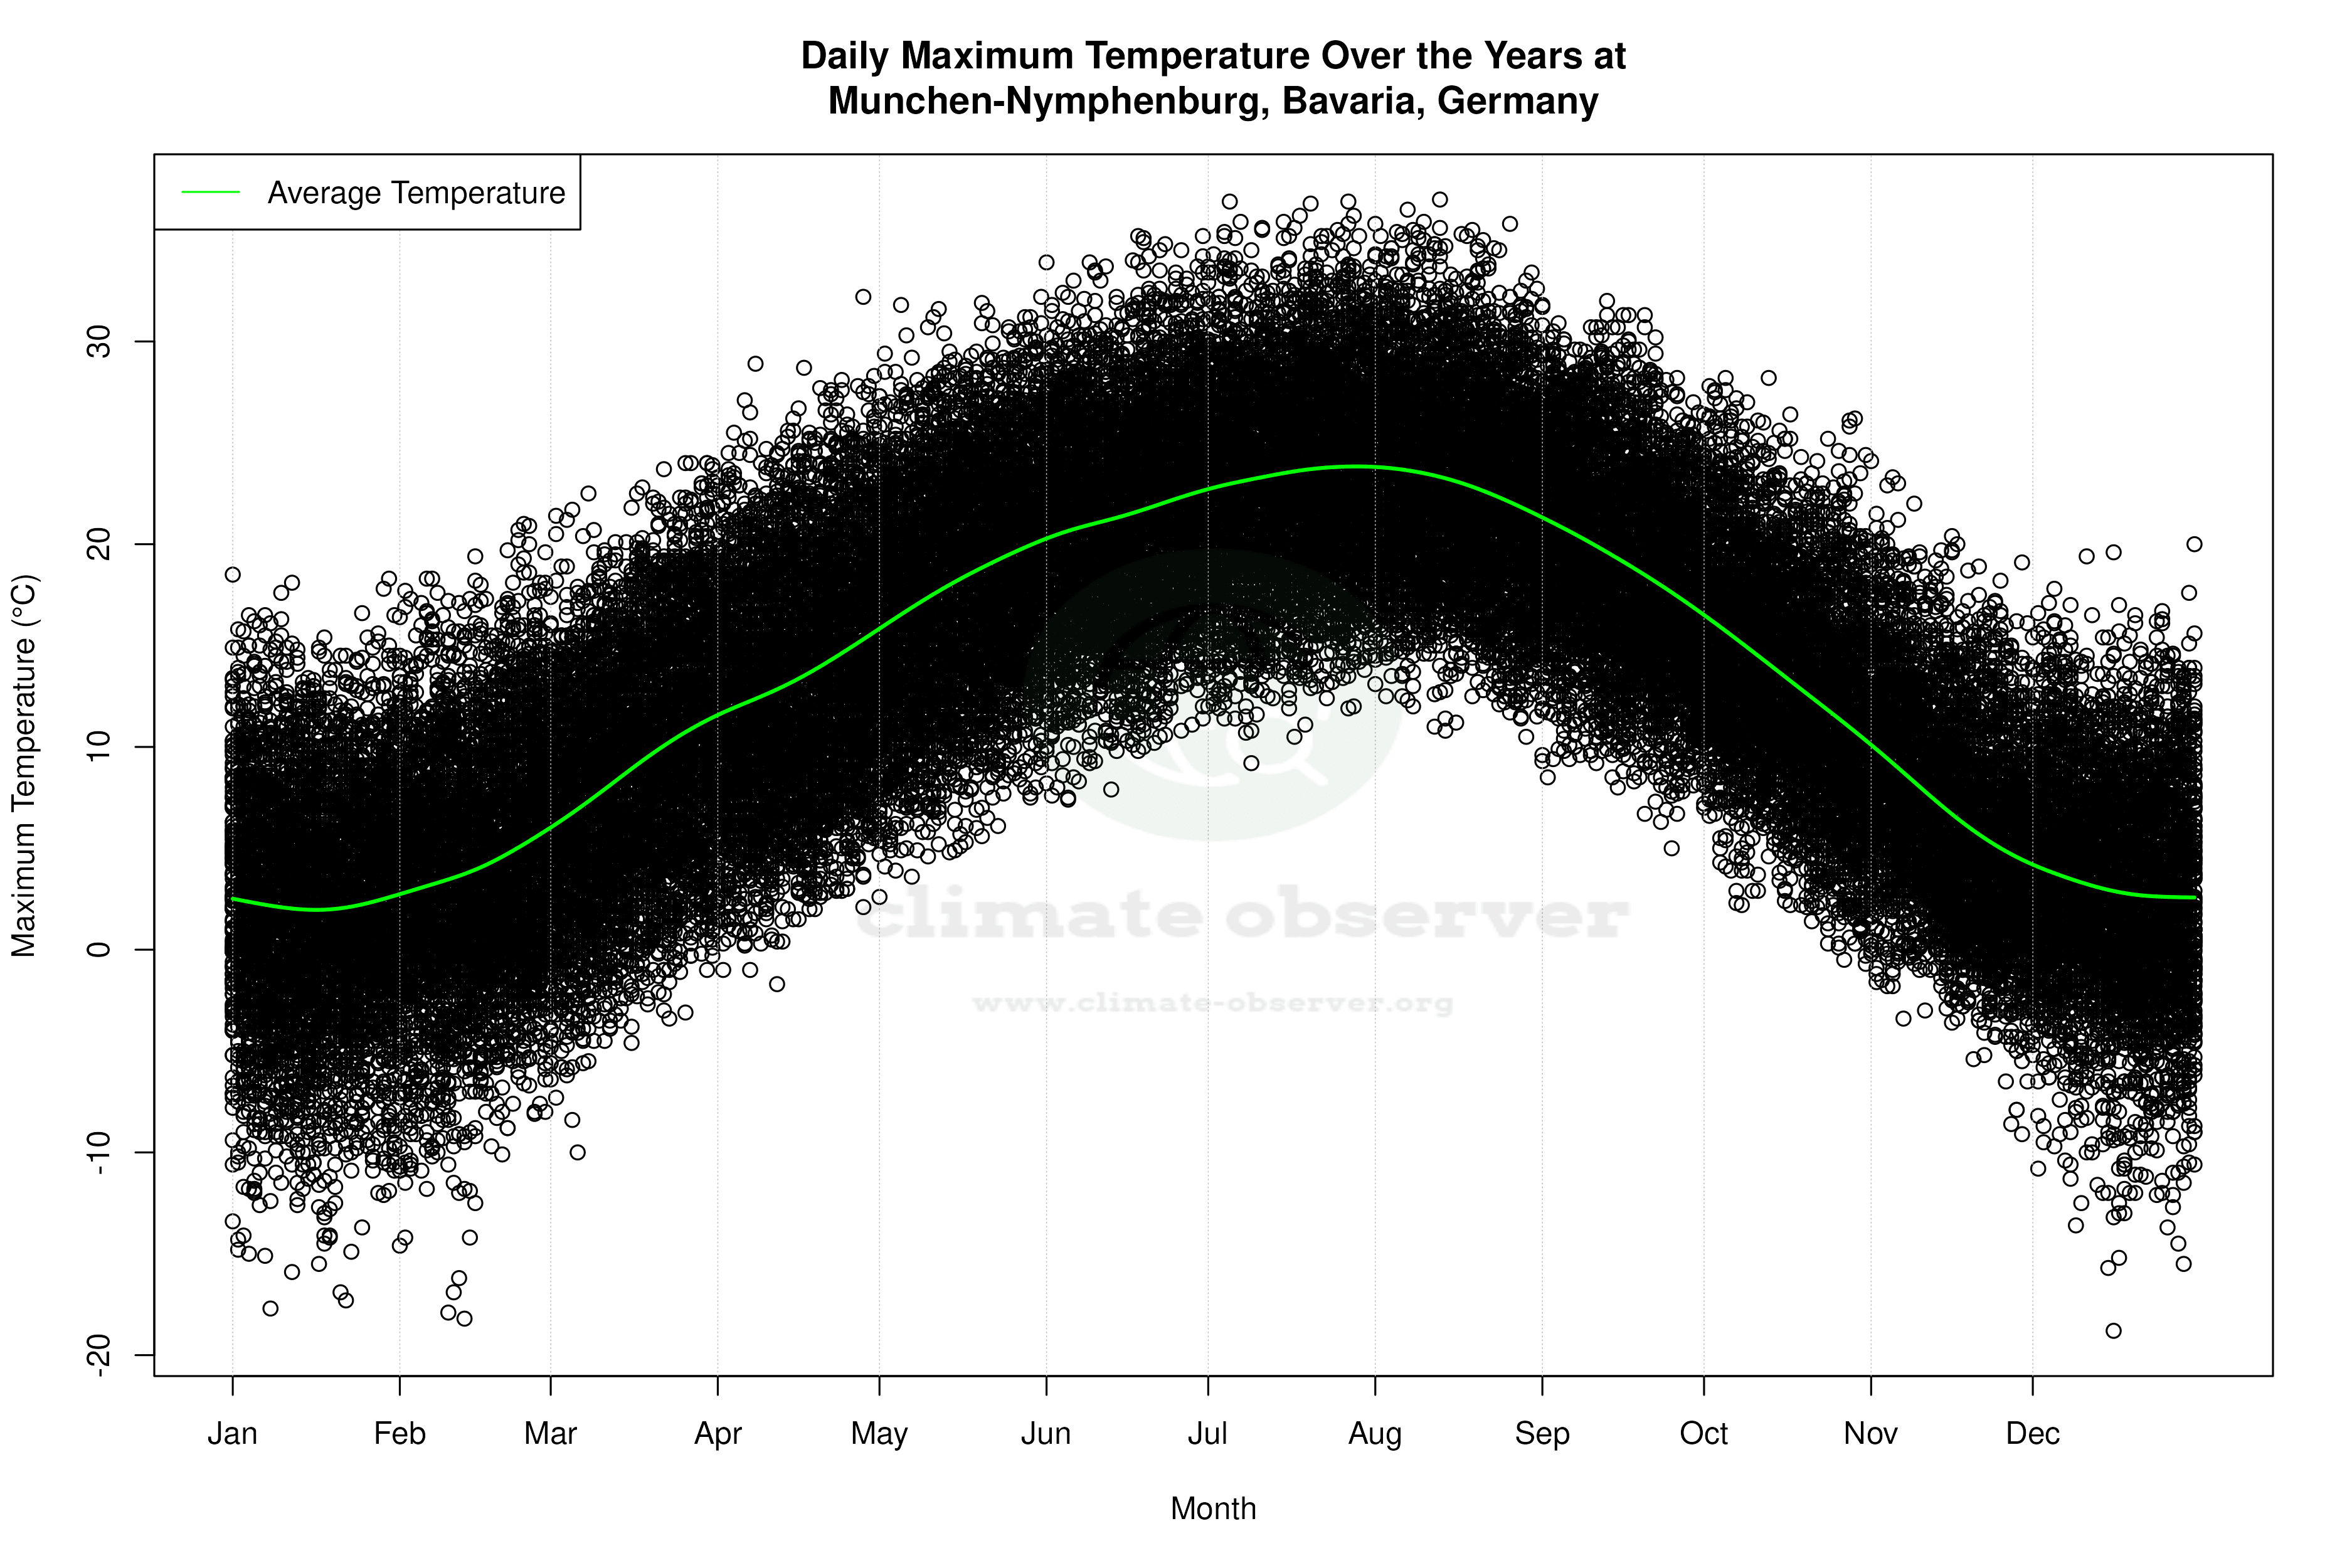

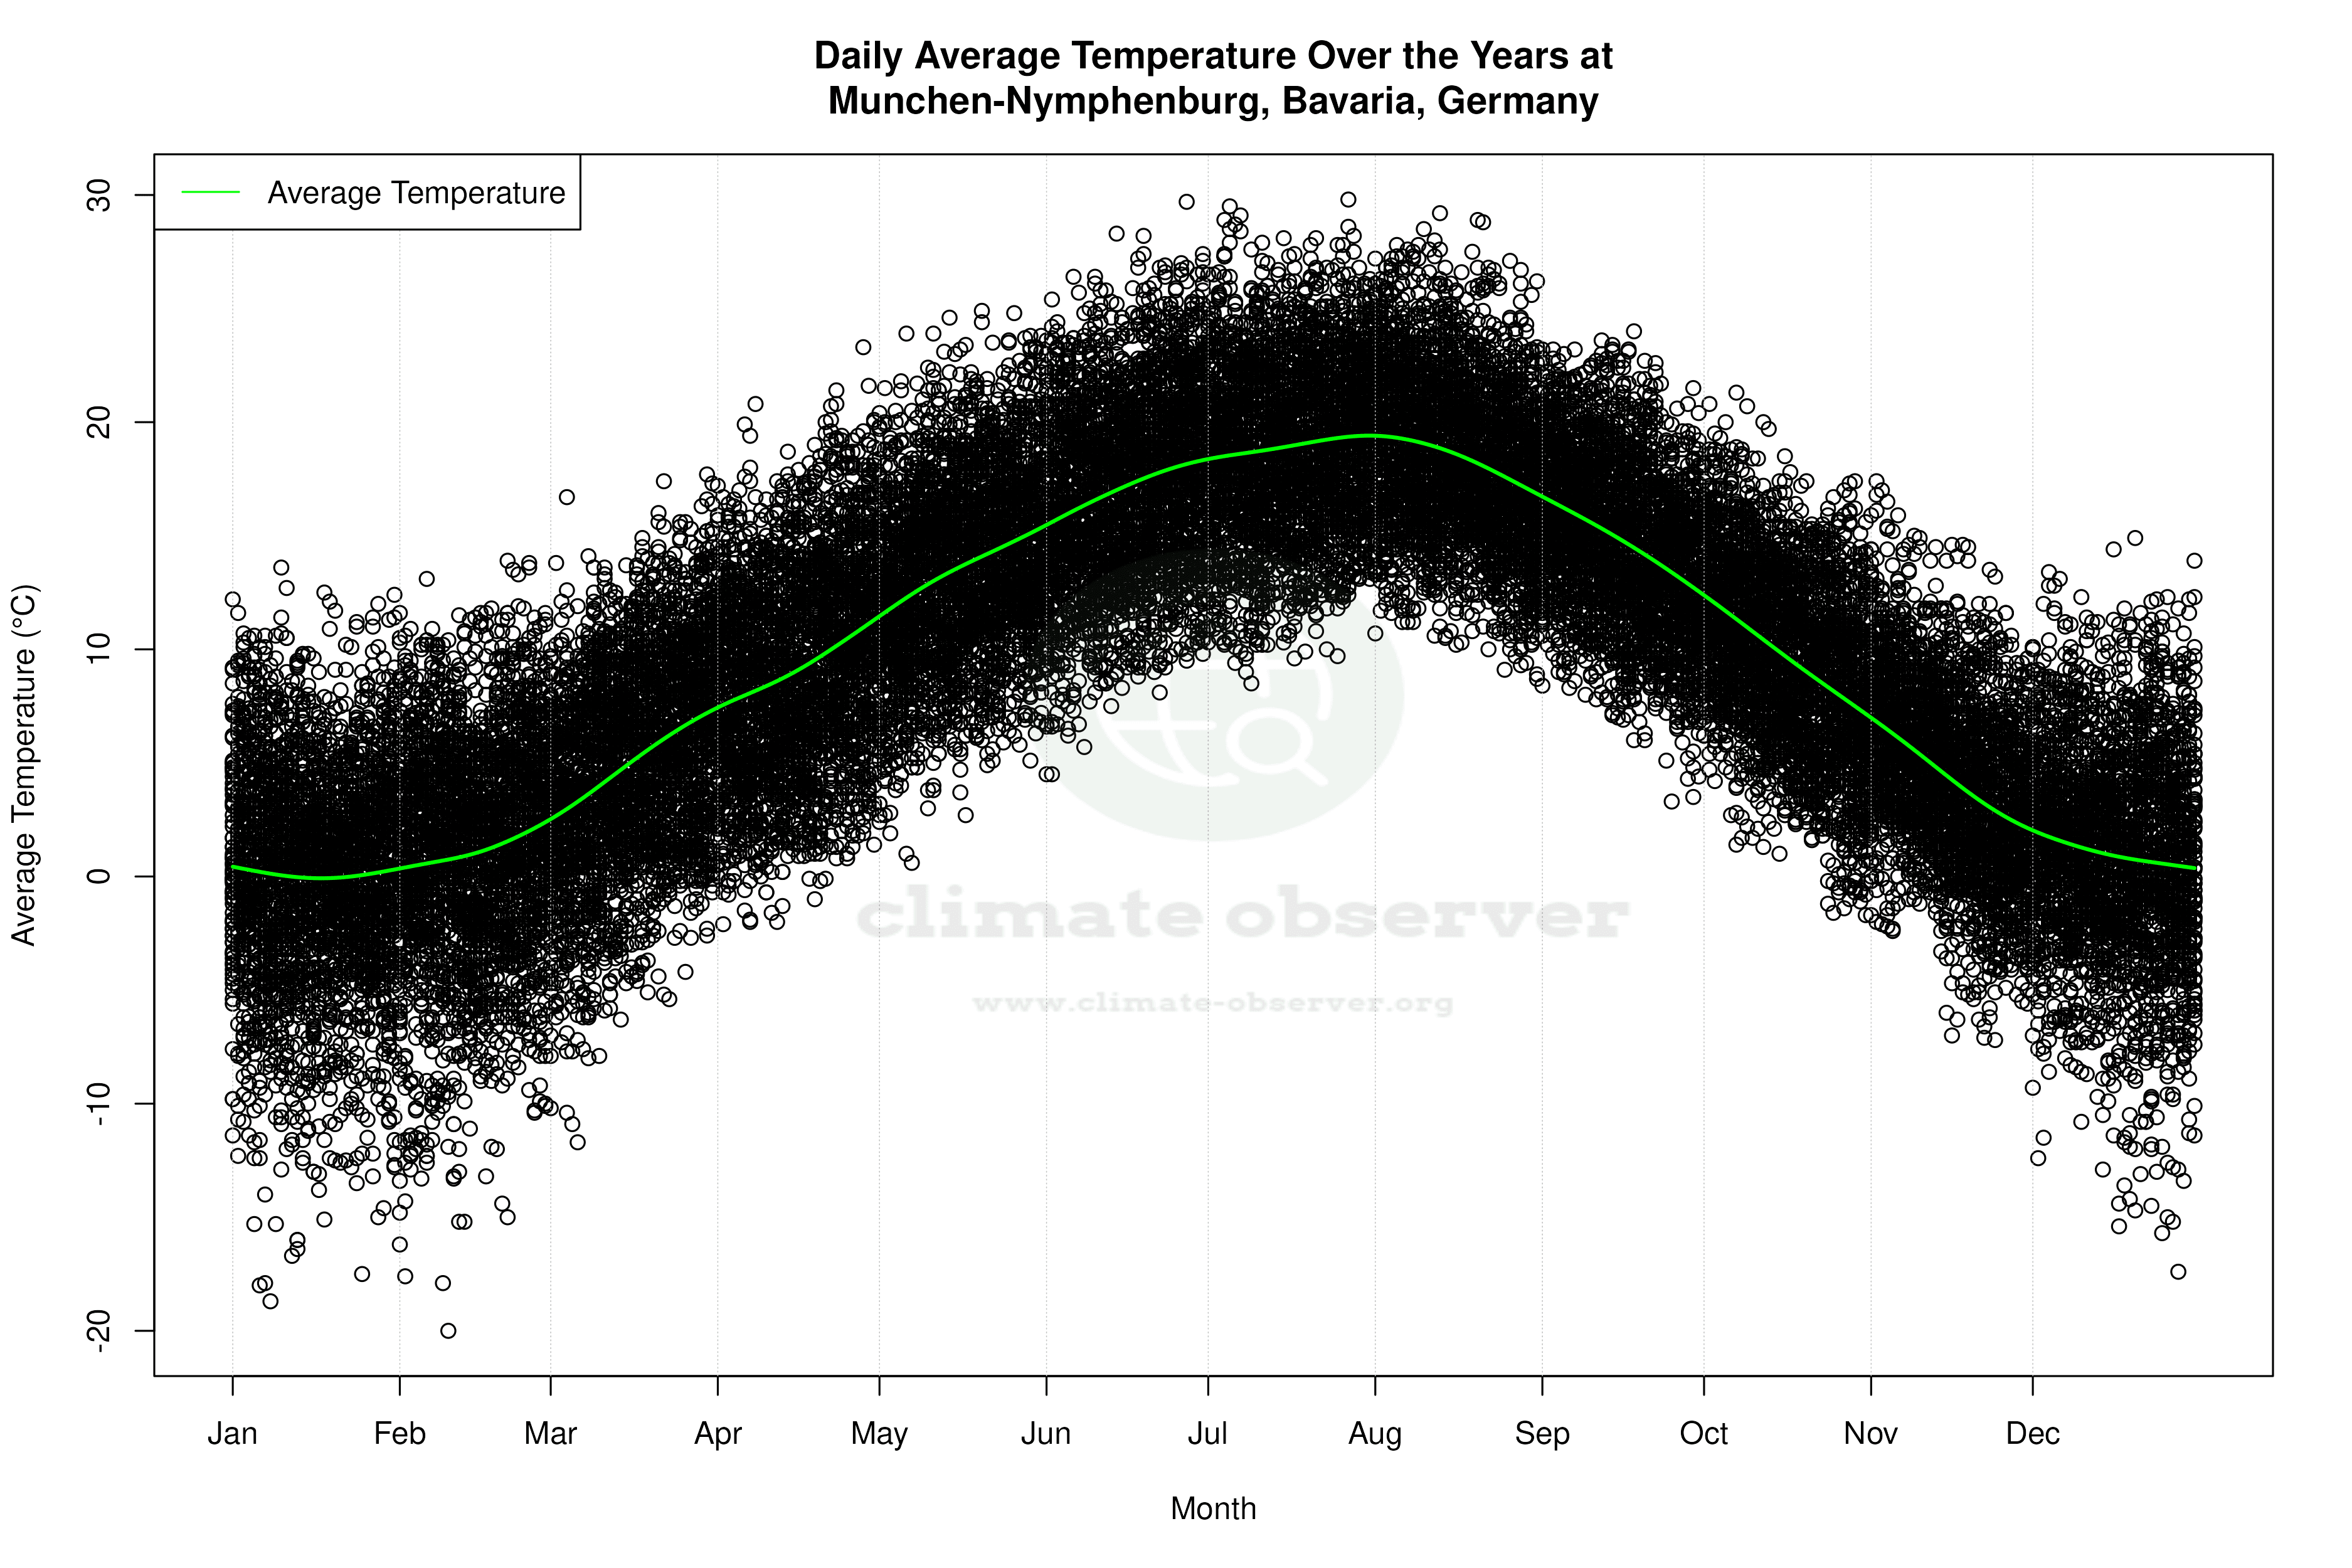


Average Max Temperature Throughout Year | 1 of 5
