Climate for Station: Jena Sternwarte, Thuringia, Germany
Loading live weather...
Climate Analysis & Overview
Jena Sternwarte is experiencing a warming trend, with recent decades showing a more pronounced increase in high temperatures. The precipitation pattern has become more evenly distributed, suggesting a shift in local climate dynamics. This aligns with Germany's broader climate objectives of stabilising weather patterns amidst global warming.
Warming Trends in Jena
Jena, located in the heart of Thüringen, Germany, falls under the Köppen climate classification Cfb, indicating a temperate oceanic climate. The city is nestled in a valley surrounded by hills, which moderates its temperature variations. Over the past decade, Jena has experienced a notable warming, with high temperatures increasing by 0.74°C (1.33°F) and lows by 0.13°C (0.23°F). This recent trend is more pronounced when compared to the all-time warming of highs at 0.15°C (0.27°F) and lows at 0.10°C (0.17°F). The increase in high temperatures suggests a shift towards warmer summers, consistent with Germany's efforts to mitigate climate change impacts.
Temperature Extremes
The region has recorded extreme temperatures, with a maximum of 39.1°C (102.4°F) and a minimum of -30.6°C (-23.1°F). These records highlight the potential for significant thermal oscillations within Jena's climate, influenced by its geographical position and topography. The surrounding hills can create microclimates, leading to these temperature extremes.
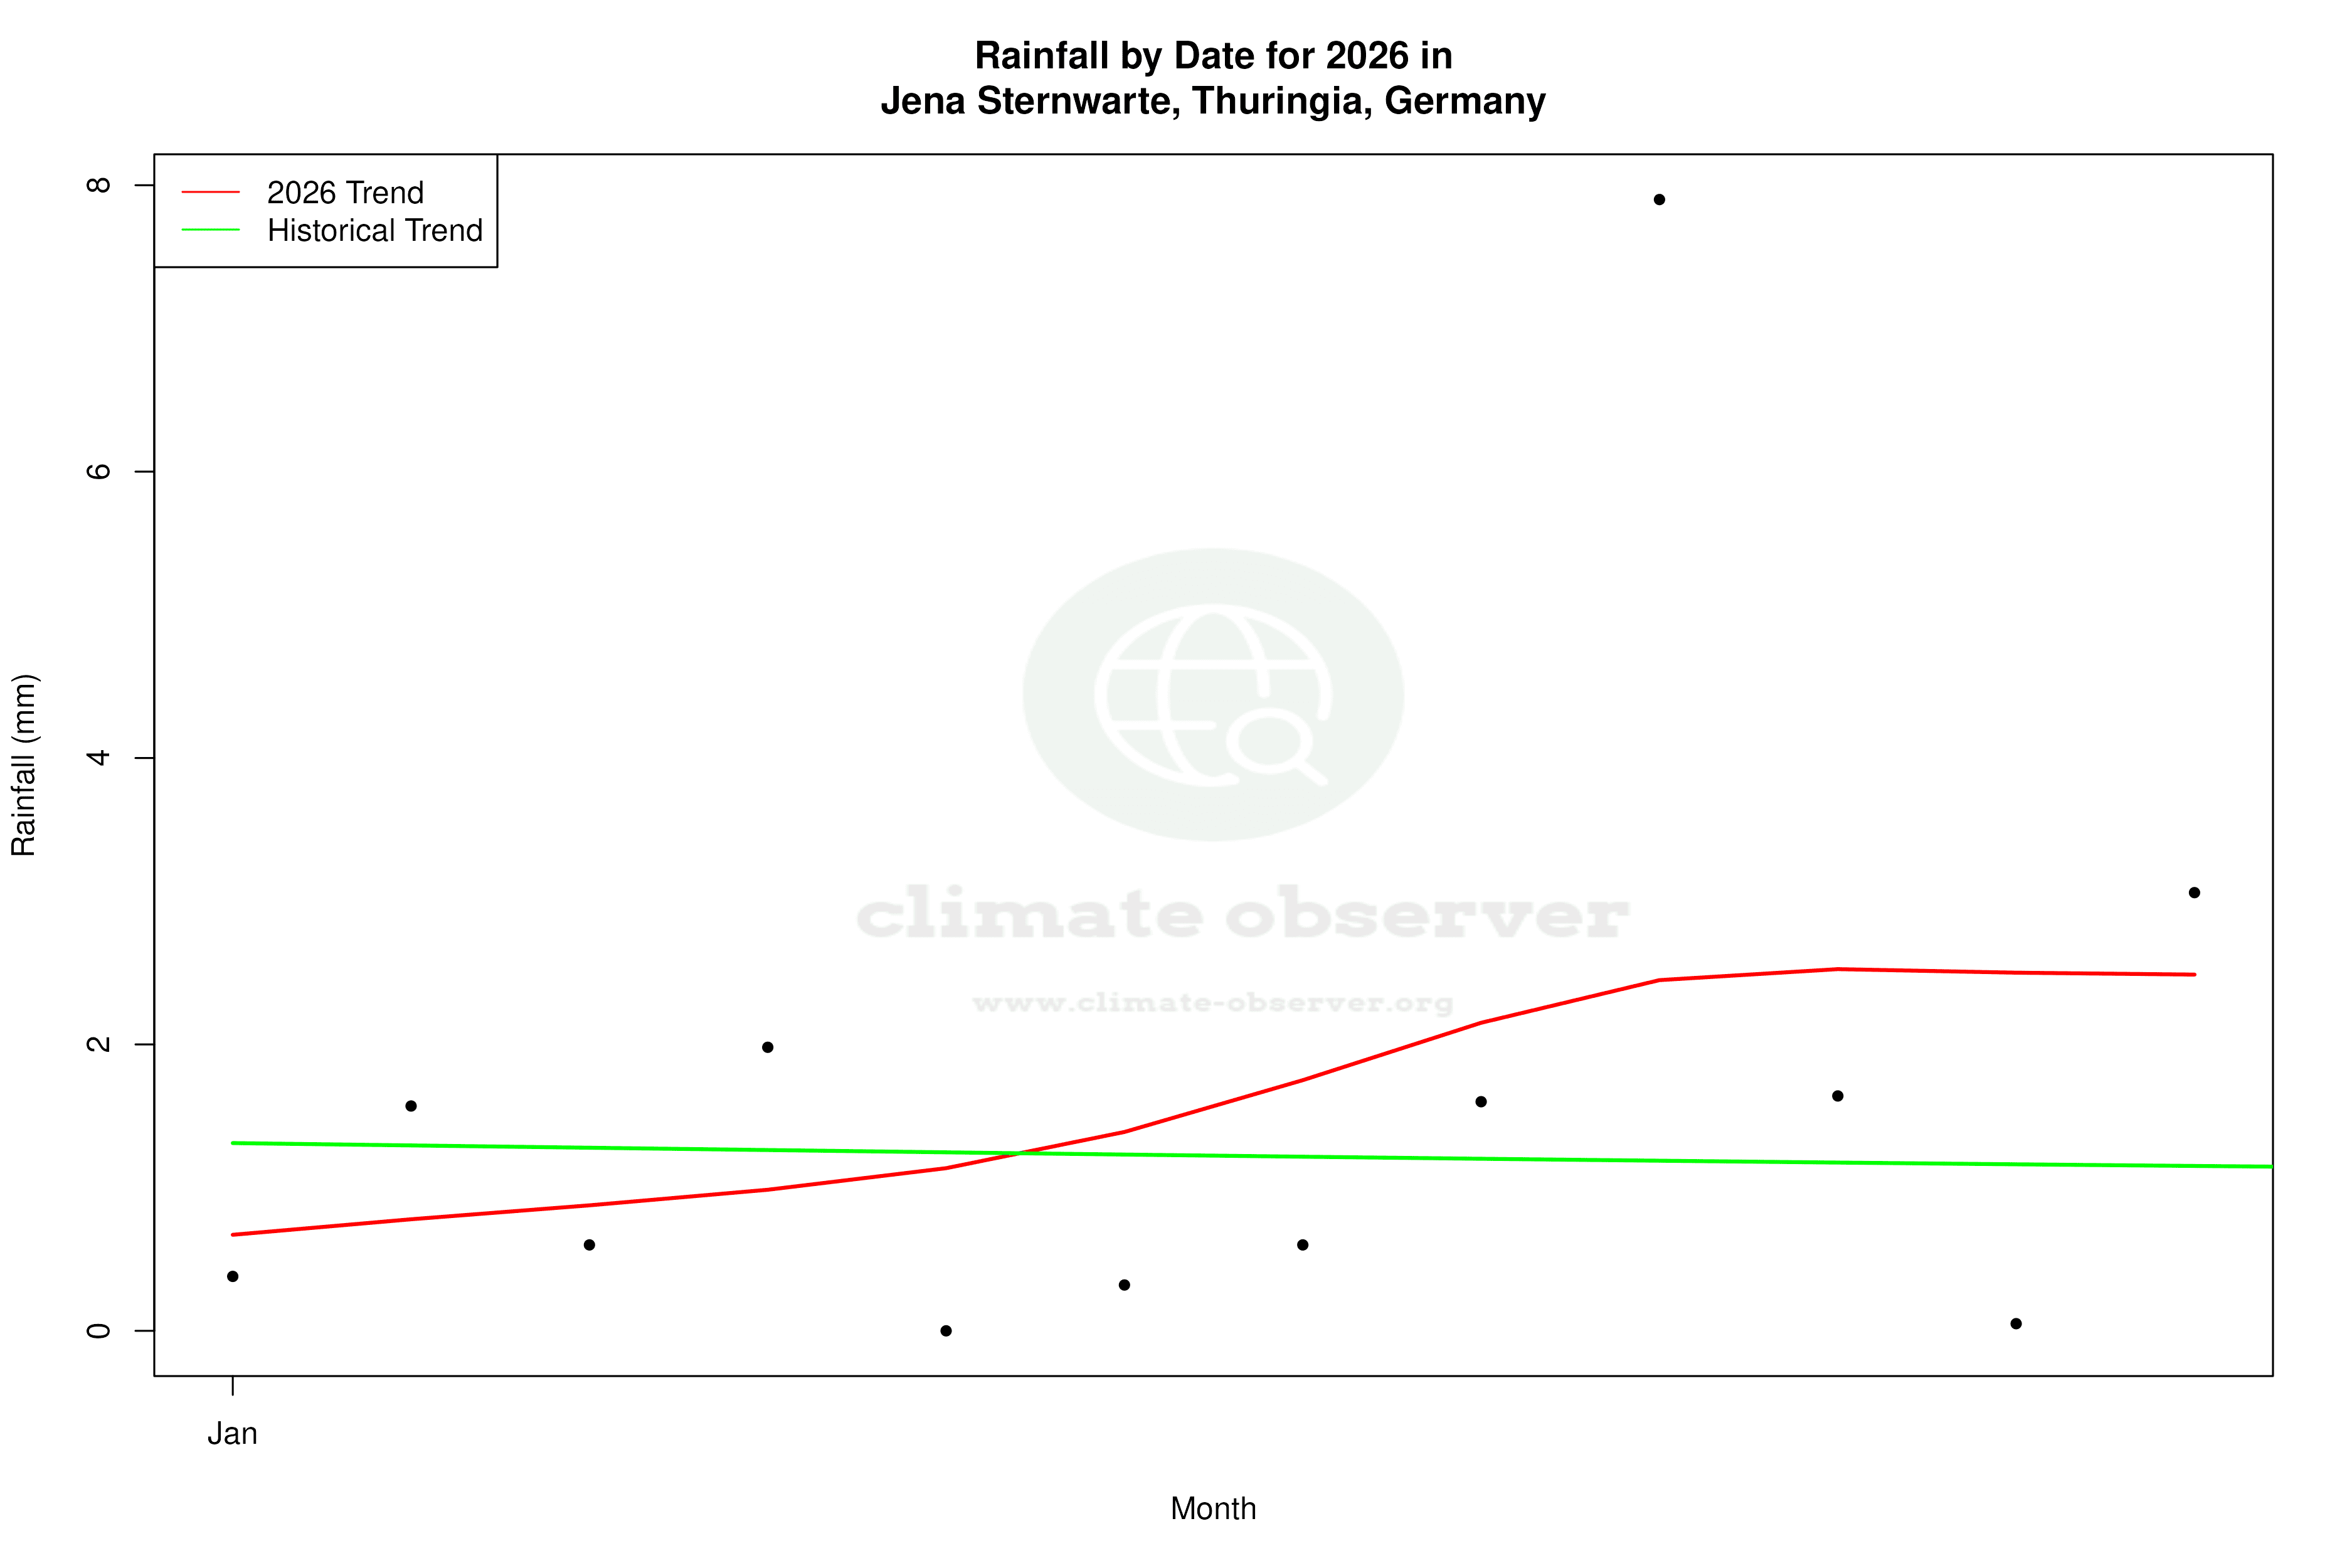
Precipitation Patterns and PCI
The Precipitation Concentration Index (PCI) for Jena has decreased from a baseline of 11.00 to a current value of 10.04. This marginal reduction indicates a more even distribution of rainfall throughout the year. A lower PCI suggests that precipitation events are becoming less concentrated, potentially reducing the risk of flooding and aligning with Germany's climate goals of achieving more stable weather patterns.
Regional Climate Implications
Jena's climate trends are reflective of broader regional changes in Germany, where efforts are being made to adapt to and mitigate the effects of global warming. The observed warming in Jena, particularly in high temperatures, underscores the importance of these initiatives. Additionally, the more evenly distributed precipitation could influence agricultural practices and water management strategies in the region, promoting sustainability.
The Broader Context of Climate Goals
Germany's climate strategy aims to reduce greenhouse gas emissions and adapt to changing weather patterns. The trends observed in Jena, with rising temperatures and a more balanced precipitation regime, are indicative of the challenges and progress in achieving these objectives. As the country continues to implement policies to combat climate change, monitoring stations like Jena Sternwarte provide valuable insights into the effectiveness of these measures.
Station Statistics
10-Year Trend
High: +0.76 °C/decade
Low: +0.04 °C/decade
Rain: +0.15 mm/decade
25-Year Trend
High: +0.74 °C/decade
Low: +0.28 °C/decade
Rain: -0.06 mm/decade
50-Year Trend
High: +0.56 °C/decade
Low: +0.28 °C/decade
Rain: -0.02 mm/decade
All-Time Trend
High: +0.15 °C/decade
Low: +0.09 °C/decade
Rain: +0.00 mm/decade
Percentage Above-Average Days
Last 12 Months: 61.6%
This Year: 30.0%
Precipitation Concentration Index (PCI) ℹ️
Last 12 Months: 11.2
Historical Average: 12.1
Percentile Rank of Last 12 Months ℹ️
High: 96th percentile
Low: 89th percentile
Rain: 35th percentile
Change in Variance ℹ️
High: -2.1%
Low: -17.7%
Intraday: -2.2%
Data Coverage
95.9%
First Year of Data
1822
Station Location
Historical Weather Records
| Max High | Avg High | Min High | Max Avg | Avg Avg | Min Avg | Max Low | Avg Low | Min Low | Max Precipitation | Avg Precipitation | Max Snow | Avg Snow | |
|---|---|---|---|---|---|---|---|---|---|---|---|---|---|
| Record | 39.1 °C | — | -19.7 °C | 29.8 °C | — | -24.3 °C | 21.0 °C | — | -30.6 °C | 75.0 mm | — | — | — |
| January | 17.0 °C | 2.8 °C | -18.8 °C | 14.4 °C | -0.2 °C | -24.2 °C | 10.5 °C | -3.4 °C | -30.6 °C | 27.4 mm | 1.1 mm | — | — |
| February | 23.1 °C | 4.8 °C | -19.7 °C | 14.5 °C | 1.0 °C | -24.3 °C | 12.4 °C | -2.6 °C | -30.6 °C | 40.7 mm | 1.1 mm | — | — |
| March | 25.9 °C | 9.0 °C | -9.1 °C | 16.6 °C | 4.2 °C | -14.3 °C | 12.4 °C | -0.0 °C | -22.0 °C | 33.7 mm | 1.2 mm | — | — |
| April | 32.5 °C | 14.2 °C | -1.9 °C | 21.3 °C | 8.5 °C | -4.2 °C | 14.5 °C | 3.4 °C | -12.4 °C | 53.1 mm | 1.5 mm | — | — |
| May | 36.1 °C | 19.2 °C | 5.0 °C | 24.9 °C | 13.2 °C | 1.7 °C | 19.1 °C | 7.4 °C | -5.1 °C | 56.2 mm | 1.9 mm | — | — |
| June | 38.8 °C | 22.5 °C | 8.8 °C | 28.8 °C | 16.6 °C | 7.1 °C | 20.5 °C | 11.0 °C | 0.6 °C | 60.1 mm | 2.2 mm | — | — |
| July | 39.1 °C | 24.3 °C | 11.7 °C | 29.8 °C | 18.1 °C | 9.8 °C | 21.0 °C | 12.8 °C | 3.7 °C | 75.0 mm | 2.3 mm | — | — |
| August | 38.7 °C | 23.7 °C | 12.6 °C | 28.3 °C | 17.3 °C | 9.1 °C | 20.8 °C | 12.3 °C | 3.4 °C | 68.6 mm | 2.0 mm | — | — |
| September | 36.5 °C | 20.0 °C | 5.6 °C | 25.5 °C | 13.8 °C | 4.4 °C | 18.8 °C | 9.1 °C | -4.4 °C | 68.6 mm | 1.6 mm | — | — |
| October | 29.0 °C | 14.2 °C | -0.4 °C | 20.9 °C | 9.2 °C | -4.2 °C | 17.1 °C | 5.3 °C | -10.9 °C | 51.3 mm | 1.4 mm | — | — |
| November | 23.1 °C | 7.5 °C | -12.4 °C | 18.2 °C | 4.4 °C | -13.8 °C | 14.5 °C | 1.4 °C | -19.9 °C | 51.8 mm | 1.3 mm | — | — |
| December | 17.7 °C | 4.0 °C | -16.9 °C | 15.3 °C | 1.3 °C | -20.5 °C | 13.1 °C | -1.6 °C | -24.5 °C | 29.1 mm | 1.2 mm | — | — |
Data Visualisations
Remove WatermarksCurrent Year Climate Trends vs Historical


Max Temperature this Year | 1 of 6
Climate 12-Month Moving Averages


Max Temperature 12-Month MA | 1 of 6
Daily Data Points and Averages Throughout the Year


Average Max Temperature Throughout Year | 1 of 5
