Climate for Station: Hohenpeissenberg, Bavaria, Germany
Loading live weather...
Climate Analysis & Overview
Hohenpeissenberg is experiencing a warming trend, with both high and low temperatures rising over the last decade. The precipitation pattern has become slightly more even, suggesting a change in local weather dynamics. These trends align with Germany's broader climate goals of reducing extreme weather impacts.
Alpine Climate Dynamics
Hohenpeissenberg, located in the Bavarian Alps, is characterised by a humid continental climate, classified as Dfb under the Köppen system. This region, with its elevated terrain and proximity to the Alps, experiences significant climatic influences, including cooler summers and cold, snowy winters. The all-time temperature trends reveal a subtle warming, with highs increasing by 0.17°C (0.31°F) and lows by 0.17°C (0.31°F). This gradual rise is indicative of broader regional warming patterns observed across Germany, which aims to mitigate the impacts of climate change through national policies and initiatives.
Decadal Temperature Trends
Over the past decade, Hohenpeissenberg has seen a more pronounced warming trend compared to its all-time records. High temperatures have risen by 1.04°C (1.87°F), while lows have increased by 0.88°C (1.58°F). This recent acceleration in temperature rise could be attributed to various factors, including increased greenhouse gas concentrations and changes in atmospheric circulation patterns. The stark contrast between the 10-year and all-time trends highlights the importance of short-term data in understanding immediate climatic shifts.
Precipitation Patterns and PCI
The Precipitation Concentration Index (PCI) for Hohenpeissenberg has shown a slight decrease from a baseline of 11.34 to a current value of 10.77. The PCI is a measure of how precipitation is distributed over time; a decrease indicates a more even distribution of rainfall events. This marginal change suggests that while precipitation remains relatively consistent throughout the year, there is a tendency towards less concentration in fewer, intense events. Such a shift could be beneficial in reducing the risk of flooding and soil erosion, aligning with Germany's climate adaptation strategies.
Temperature Extremes and Records
Hohenpeissenberg's temperature extremes provide insight into the variability of its climate. The record high stands at 33.8°C (92.8°F), while the record low is -29.1°C (-20.4°F). These extremes underscore the region's capacity for significant thermal oscillations, a common characteristic of continental climates. Understanding these extremes is crucial for local planning and infrastructure development, especially in the context of increasing temperature variability due to climate change.
Regional Climate Goals
Germany has been proactive in addressing climate change, with goals to reduce greenhouse gas emissions and adapt to changing weather patterns. The trends observed in Hohenpeissenberg reflect these national efforts, as the region experiences shifts in temperature and precipitation patterns. By continuing to monitor these changes, Hohenpeissenberg can contribute valuable data to Germany's climate initiatives, helping to inform policy and promote sustainable development.
Station Statistics
10-Year Trend
High: +1.01 °C/decade
Low: +0.84 °C/decade
Rain: +0.08 mm/decade
25-Year Trend
High: +0.84 °C/decade
Low: +0.56 °C/decade
Rain: -0.20 mm/decade
50-Year Trend
High: +0.63 °C/decade
Low: +0.45 °C/decade
Rain: -0.13 mm/decade
All-Time Trend
High: +0.17 °C/decade
Low: +0.18 °C/decade
Rain: +0.09 mm/decade
Percentage Above-Average Days
Last 12 Months: 60.0%
This Year: 65.0%
Precipitation Concentration Index (PCI) ℹ️
Last 12 Months: 10.5
Historical Average: 12.8
Percentile Rank of Last 12 Months ℹ️
High: 97th percentile
Low: 96th percentile
Rain: 58th percentile
Change in Variance ℹ️
High: -0.2%
Low: -7.8%
Intraday: +18.3%
Data Coverage
78.5%
First Year of Data
1781
Station Location
Historical Weather Records
| Max High | Avg High | Min High | Max Avg | Avg Avg | Min Avg | Max Low | Avg Low | Min Low | Max Precipitation | Avg Precipitation | Max Snow | Avg Snow | |
|---|---|---|---|---|---|---|---|---|---|---|---|---|---|
| Record | 33.8 °C | — | -23.4 °C | 28.5 °C | — | -25.4 °C | 25.9 °C | — | -29.1 °C | 116.8 mm | — | — | — |
| January | 18.1 °C | 1.3 °C | -20.2 °C | 11.5 °C | -2.1 °C | -22.9 °C | 9.6 °C | -4.4 °C | -26.3 °C | 86.3 mm | 1.4 mm | — | — |
| February | 19.7 °C | 2.2 °C | -23.4 °C | 14.6 °C | -1.2 °C | -25.4 °C | 11.3 °C | -3.8 °C | -29.1 °C | 52.6 mm | 1.4 mm | — | — |
| March | 23.6 °C | 5.7 °C | -13.8 °C | 16.1 °C | 1.4 °C | -15.2 °C | 11.8 °C | -1.2 °C | -18.8 °C | 41.5 mm | 1.5 mm | — | — |
| April | 29.4 °C | 9.8 °C | -4.6 °C | 20.7 °C | 5.5 °C | -9.2 °C | 16.5 °C | 2.0 °C | -11.0 °C | 58.1 mm | 2.1 mm | — | — |
| May | 29.0 °C | 14.4 °C | 0.2 °C | 24.6 °C | 10.0 °C | -3.0 °C | 18.5 °C | 6.2 °C | -6.6 °C | 97.7 mm | 3.3 mm | — | — |
| June | 31.8 °C | 17.7 °C | 3.1 °C | 25.8 °C | 13.2 °C | 0.3 °C | 22.6 °C | 9.5 °C | -1.1 °C | 116.8 mm | 4.4 mm | — | — |
| July | 33.8 °C | 19.7 °C | 6.4 °C | 28.5 °C | 15.1 °C | 3.6 °C | 25.9 °C | 11.4 °C | -0.8 °C | 94.5 mm | 4.2 mm | — | — |
| August | 33.1 °C | 19.2 °C | 6.6 °C | 26.5 °C | 14.7 °C | 4.0 °C | 22.8 °C | 11.4 °C | 0.2 °C | 91.2 mm | 4.0 mm | — | — |
| September | 29.6 °C | 15.7 °C | 1.0 °C | 25.6 °C | 11.6 °C | -3.2 °C | 21.2 °C | 8.7 °C | -3.5 °C | 65.4 mm | 3.0 mm | — | — |
| October | 26.9 °C | 10.9 °C | -4.6 °C | 19.8 °C | 7.1 °C | -8.4 °C | 17.2 °C | 4.6 °C | -10.8 °C | 53.3 mm | 1.9 mm | — | — |
| November | 22.3 °C | 5.6 °C | -11.5 °C | 16.5 °C | 2.1 °C | -16.9 °C | 14.9 °C | -0.0 °C | -14.9 °C | 79.4 mm | 1.7 mm | — | — |
| December | 18.6 °C | 2.4 °C | -15.5 °C | 14.6 °C | -0.9 °C | -21.2 °C | 11.5 °C | -3.1 °C | -21.1 °C | 47.0 mm | 1.4 mm | — | — |
Data Visualisations
Remove WatermarksCurrent Year Climate Trends vs Historical
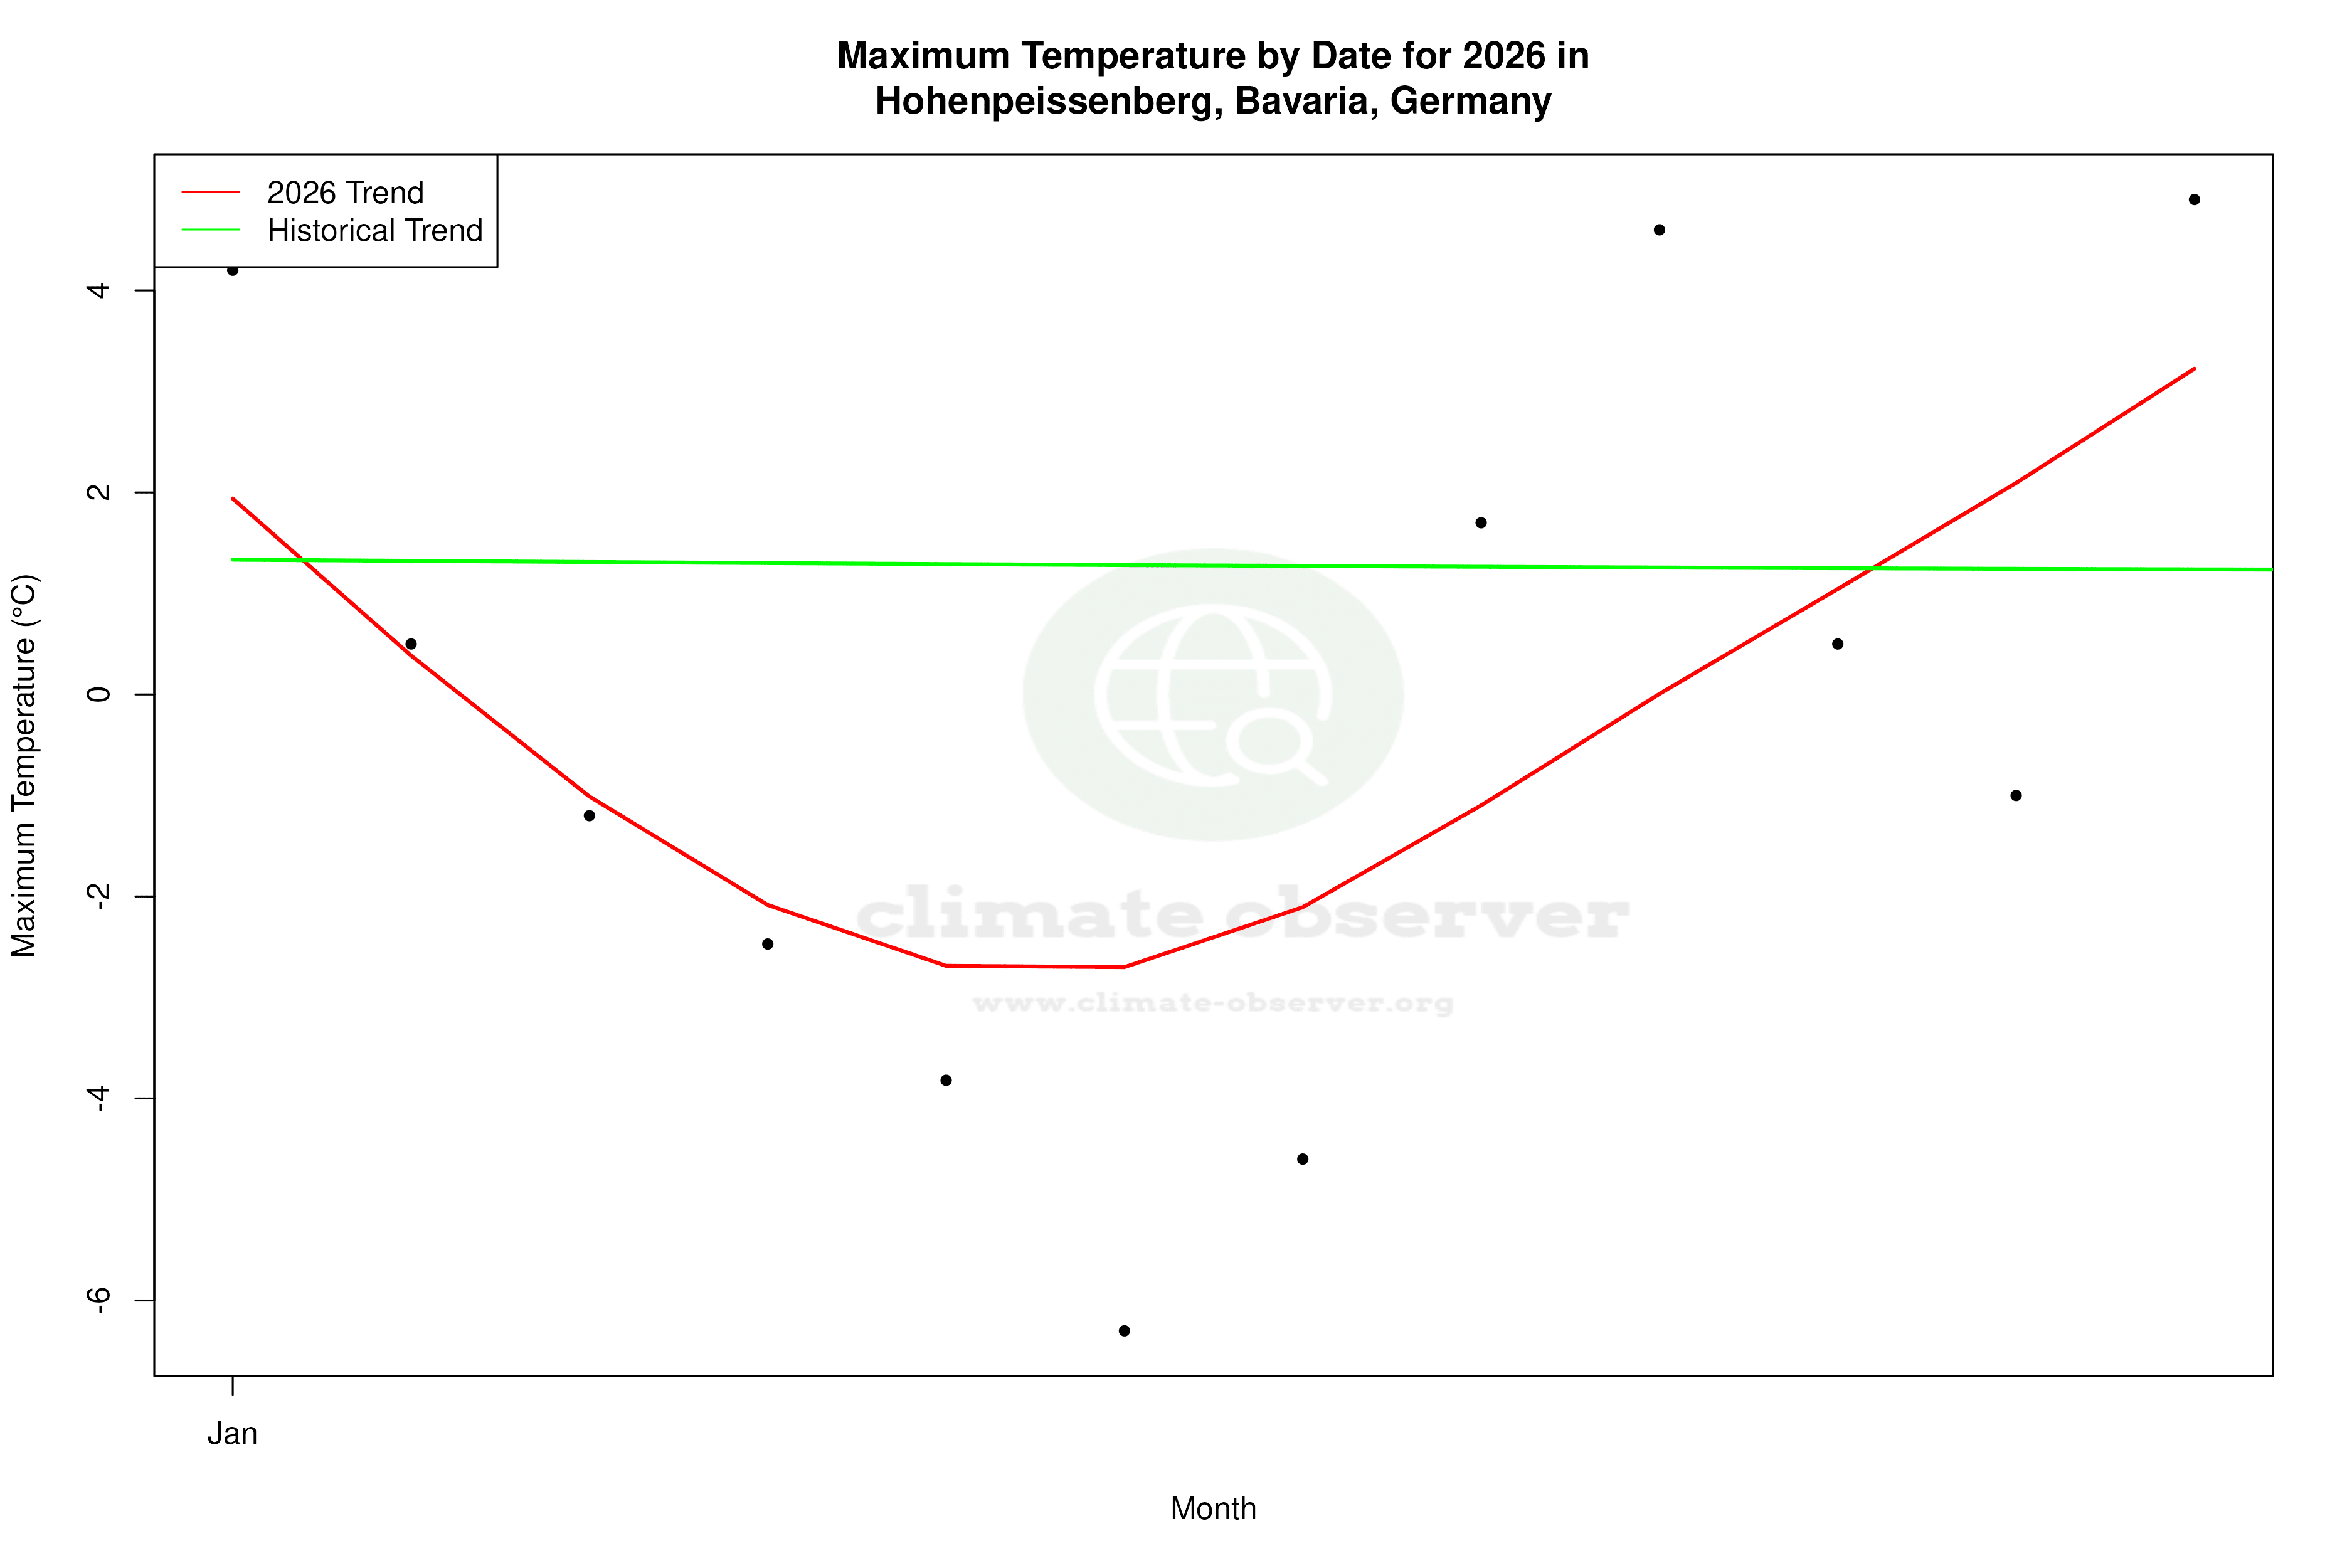


Max Temperature this Year | 1 of 6
Climate 12-Month Moving Averages


Max Temperature 12-Month MA | 1 of 6
Daily Data Points and Averages Throughout the Year
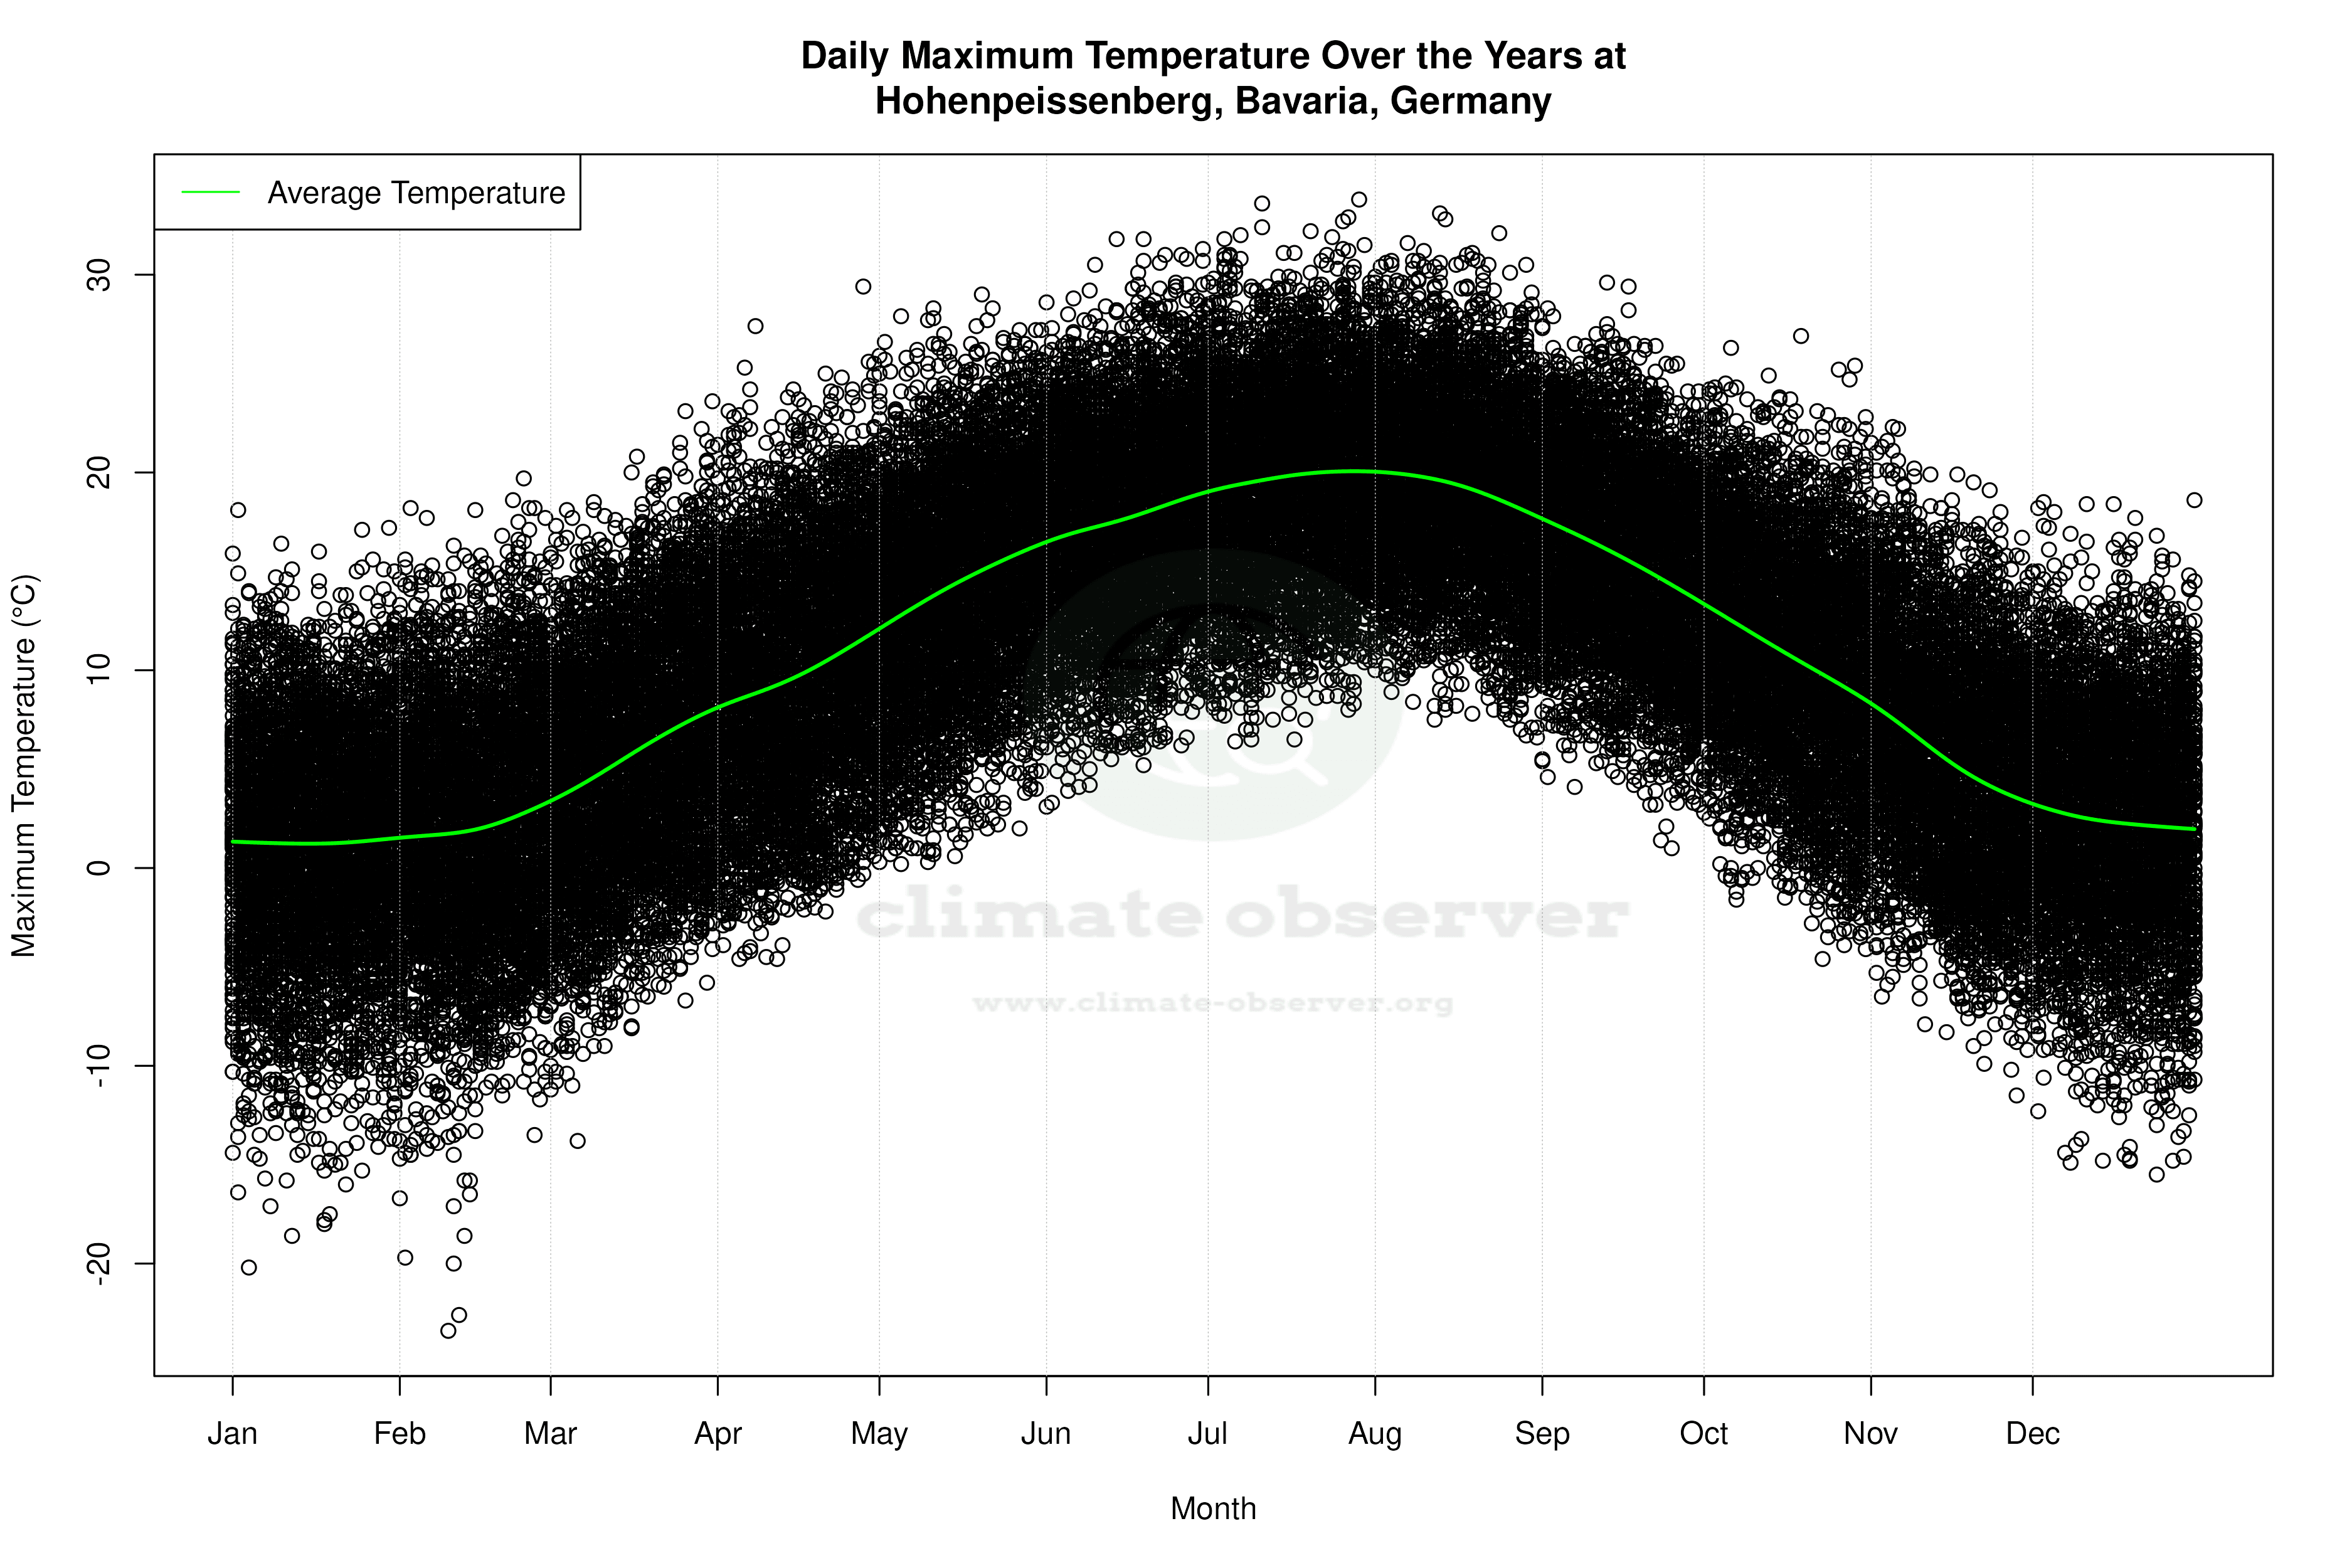

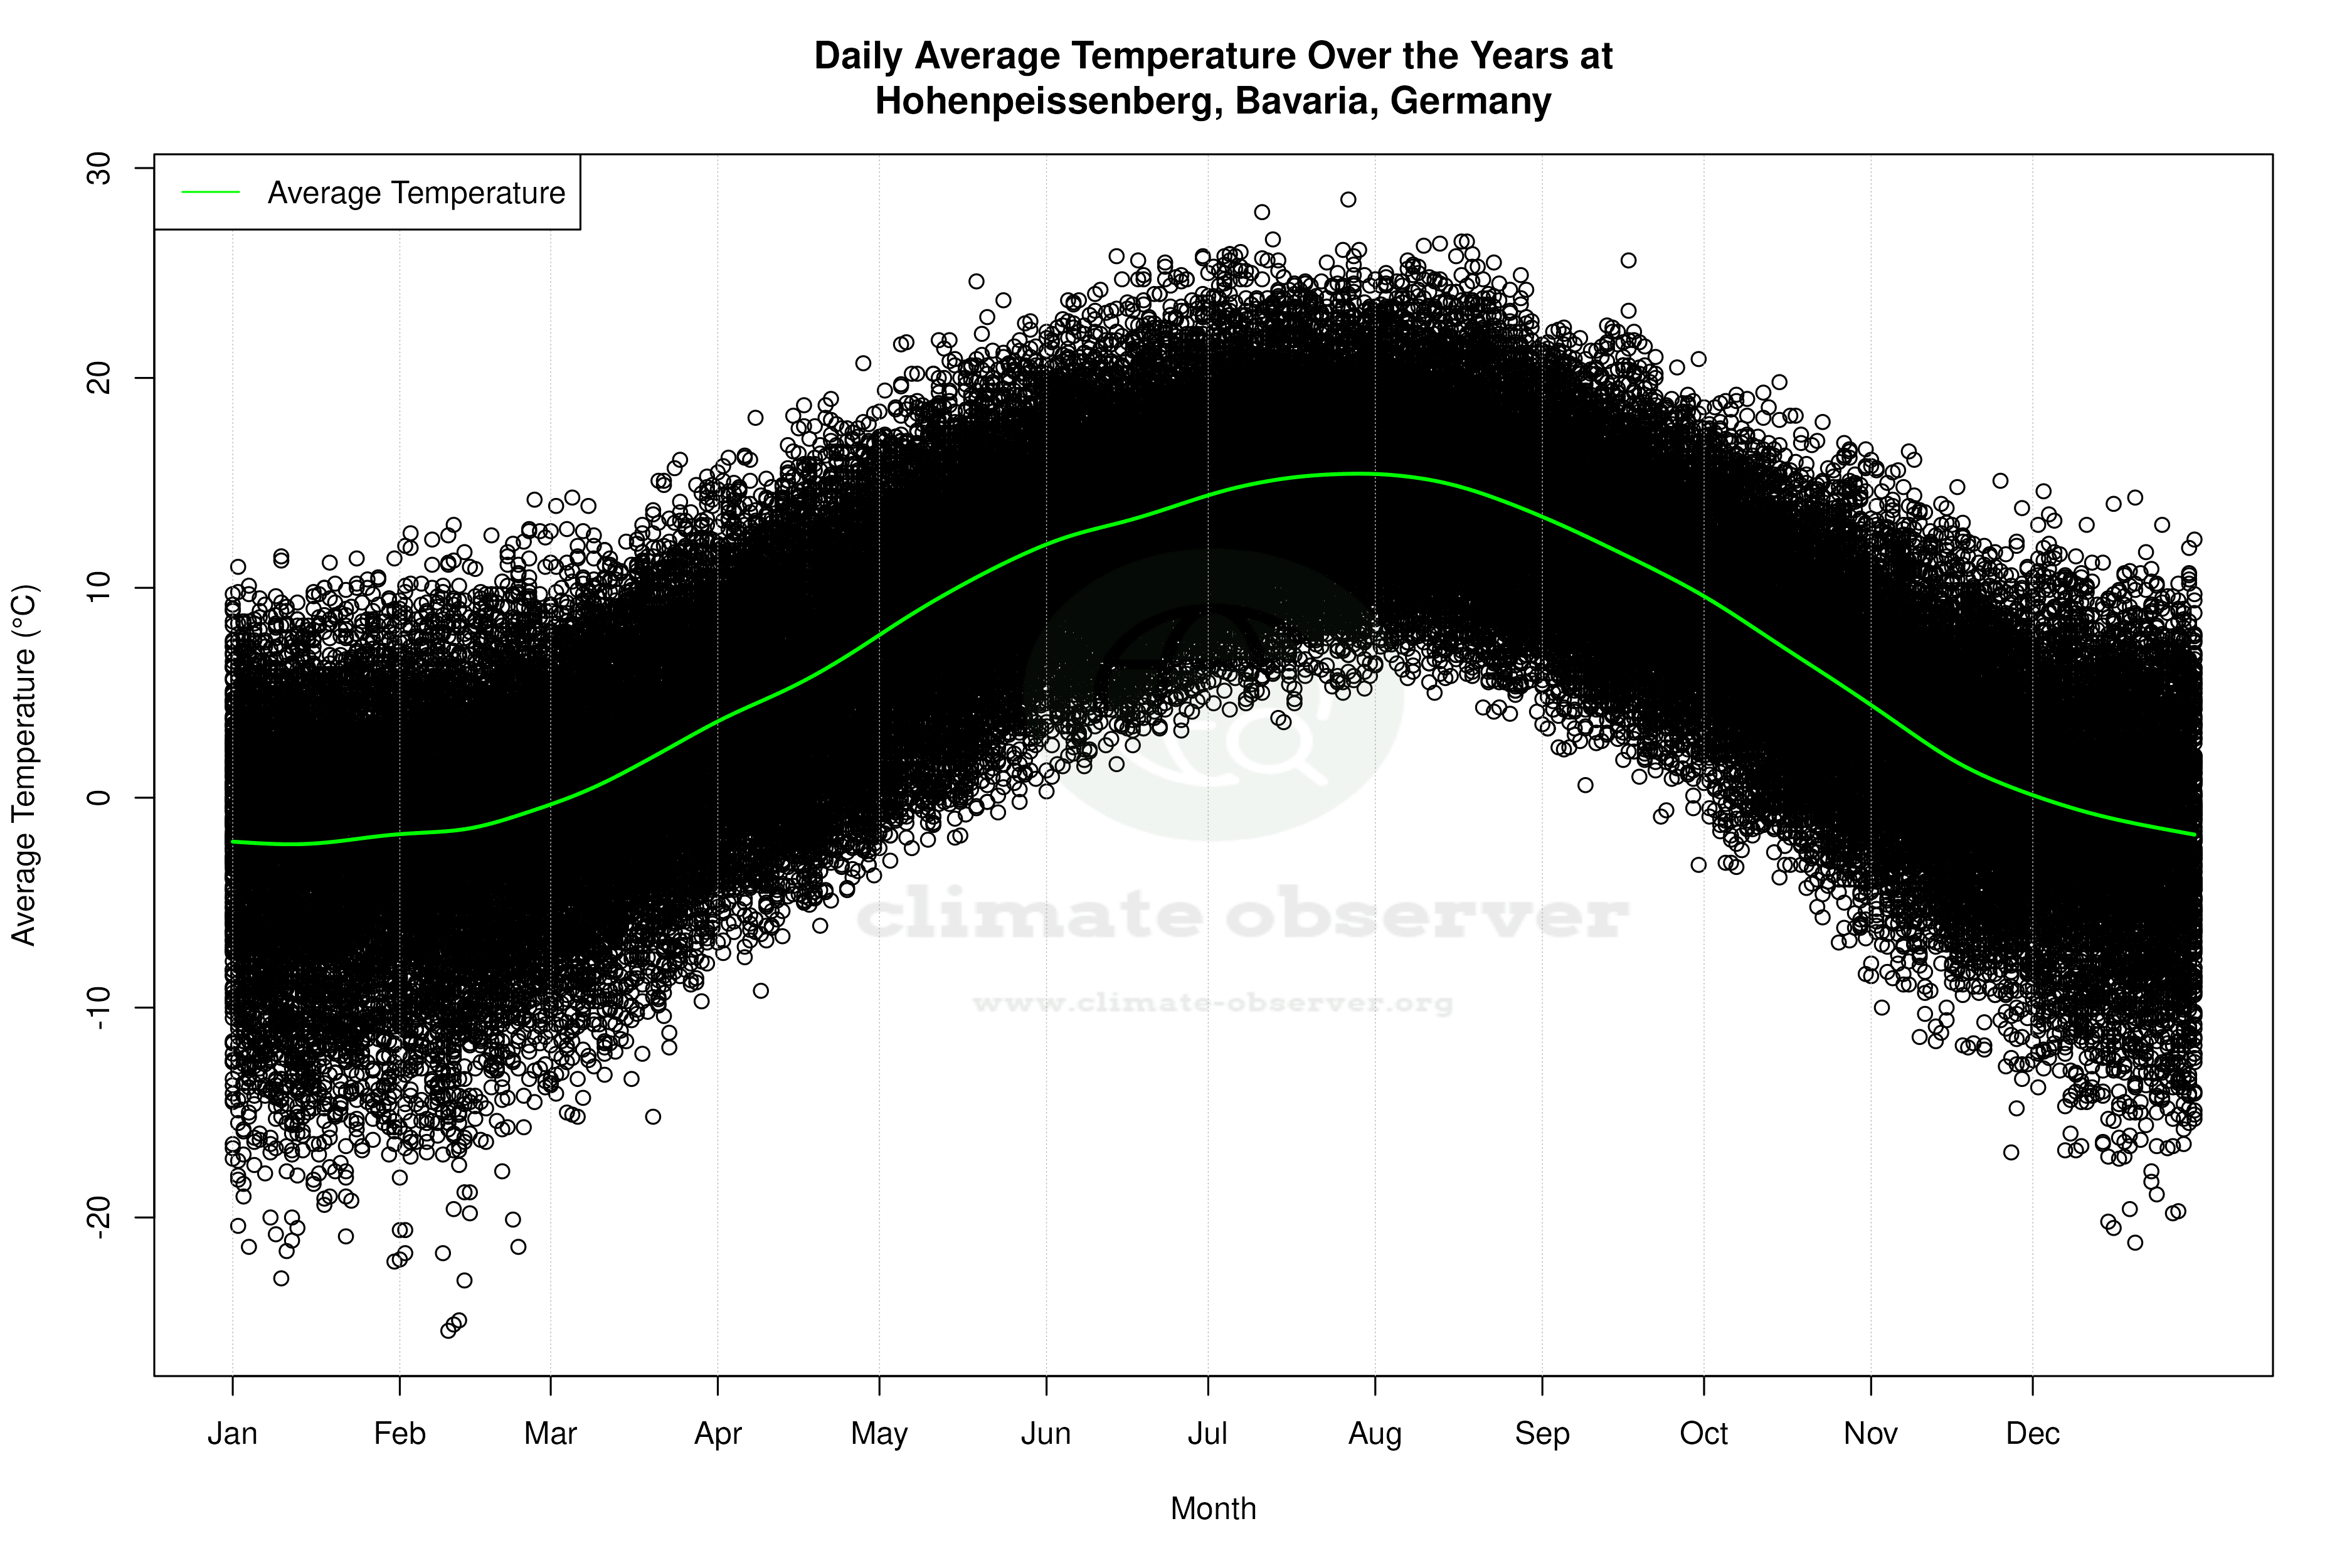


Average Max Temperature Throughout Year | 1 of 5
