Climate for Station: Nurnberg, Bavaria, Germany
Loading live weather...
Climate Analysis & Overview
Nurnberg's climate is experiencing a warming trend, with temperatures rising more significantly over the past decade than historically. Precipitation is becoming more evenly distributed, which could impact local agriculture and water management strategies.
Warming Trends in Nurnberg
Nurnberg, located at 49.5042°N, 11.0567°E, experiences a temperate oceanic climate (Cfb) according to the Köppen classification. This climate type is characterised by moderate temperature variations and adequate precipitation throughout the year. Over the past decade, Nurnberg has seen a noticeable warming trend, with average high temperatures increasing by 0.74°C (1.33°F) and lows by 0.53°C (0.95°F). These figures are more pronounced than the all-time trends, which show a rise of 0.15°C (0.27°F) for highs and 0.06°C (0.11°F) for lows. This suggests a recent acceleration in warming, which aligns with broader European climate patterns.
Temperature Extremes and Records
Nurnberg's temperature records illustrate the range of its climate. The highest recorded temperature is 38.6°C (101.5°F), while the lowest plummets to -27.8°C (-18.0°F). These extremes highlight the city's ability to experience both intense summer heat and severe winter cold, a characteristic of its inland position away from moderating coastal influences.
Precipitation Patterns and Implications
The Precipitation Concentration Index (PCI) for Nurnberg has decreased from a baseline of 11.13 to a current value of 10.46, indicating more evenly distributed rainfall events. This marginal change suggests a shift towards consistent precipitation, potentially benefiting water resource management and reducing the risk of flooding associated with concentrated heavy rainfall events. Such a trend may also support agricultural activities by providing more reliable water supply throughout the growing season.
Regional Climate Goals and Local Impact
Germany is committed to ambitious climate goals, aiming to reduce greenhouse gas emissions significantly by 2030. Nurnberg's warming trend underscores the urgency of these targets. The city's climate data serves as a microcosm of the broader challenges facing Germany, as it strives to balance economic growth with environmental sustainability. Recent weather events, such as heatwaves, have further highlighted the need for adaptive strategies to mitigate the impacts of climate change on urban infrastructure and public health.
Geographical Influences on Climate
Nurnberg's geographical setting, nestled in the Franconian region of Bavaria, is influenced by its proximity to the Main-Danube Canal and surrounding low hills. These features contribute to its moderate climate, with the canal potentially affecting local humidity and temperature patterns. The city's inland position also means it is less affected by maritime influences, leading to more pronounced seasonal temperature variations.
Station Statistics
10-Year Trend
High: +0.71 °C/decade
Low: +0.55 °C/decade
Rain: +0.33 mm/decade
25-Year Trend
High: +0.85 °C/decade
Low: +0.49 °C/decade
Rain: -0.01 mm/decade
50-Year Trend
High: +0.57 °C/decade
Low: +0.19 °C/decade
Rain: -0.03 mm/decade
All-Time Trend
High: +0.15 °C/decade
Low: +0.07 °C/decade
Rain: +0.01 mm/decade
Percentage Above-Average Days
Last 12 Months: 59.5%
This Year: 35.0%
Precipitation Concentration Index (PCI) ℹ️
Last 12 Months: 13.1
Historical Average: 12.7
Percentile Rank of Last 12 Months ℹ️
High: 95th percentile
Low: 87th percentile
Rain: 43rd percentile
Change in Variance ℹ️
High: +0.9%
Low: -12.4%
Intraday: +16.4%
Data Coverage
89.4%
First Year of Data
1879
Station Location
Historical Weather Records
| Max High | Avg High | Min High | Max Avg | Avg Avg | Min Avg | Max Low | Avg Low | Min Low | Max Precipitation | Avg Precipitation | Max Snow | Avg Snow | |
|---|---|---|---|---|---|---|---|---|---|---|---|---|---|
| Record | 38.6 °C | — | -17.2 °C | 30.1 °C | — | -22.4 °C | 21.4 °C | — | -27.8 °C | 100.6 mm | — | — | — |
| January | 15.2 °C | 2.3 °C | -17.2 °C | 11.8 °C | -0.6 °C | -22.4 °C | 9.9 °C | -3.5 °C | -27.8 °C | 26.8 mm | 1.3 mm | — | — |
| February | 19.7 °C | 4.4 °C | -15.4 °C | 11.8 °C | 0.7 °C | -20.4 °C | 9.8 °C | -2.8 °C | -26.0 °C | 24.3 mm | 1.3 mm | — | — |
| March | 24.4 °C | 9.1 °C | -6.4 °C | 16.8 °C | 4.3 °C | -11.6 °C | 11.6 °C | -0.2 °C | -18.3 °C | 100.6 mm | 1.3 mm | — | — |
| April | 31.0 °C | 13.9 °C | 0.3 °C | 22.0 °C | 8.6 °C | -3.6 °C | 14.5 °C | 3.1 °C | -10.8 °C | 32.9 mm | 1.4 mm | — | — |
| May | 33.2 °C | 18.9 °C | 2.8 °C | 24.7 °C | 13.4 °C | 1.3 °C | 17.9 °C | 7.5 °C | -4.3 °C | 77.4 mm | 2.0 mm | — | — |
| June | 36.7 °C | 22.3 °C | 9.1 °C | 28.6 °C | 16.9 °C | 7.2 °C | 21.2 °C | 11.0 °C | 0.0 °C | 65.0 mm | 2.4 mm | — | — |
| July | 38.6 °C | 24.0 °C | 11.4 °C | 30.1 °C | 18.5 °C | 9.8 °C | 21.4 °C | 12.7 °C | 3.1 °C | 64.0 mm | 2.5 mm | — | — |
| August | 38.1 °C | 23.4 °C | 12.4 °C | 29.3 °C | 17.8 °C | 9.3 °C | 20.9 °C | 12.2 °C | 0.6 °C | 90.6 mm | 2.2 mm | — | — |
| September | 34.1 °C | 19.4 °C | 8.3 °C | 25.0 °C | 14.0 °C | 4.2 °C | 19.3 °C | 8.8 °C | -3.0 °C | 50.2 mm | 1.7 mm | — | — |
| October | 27.8 °C | 13.5 °C | 0.0 °C | 21.4 °C | 8.9 °C | -3.1 °C | 16.4 °C | 4.7 °C | -7.8 °C | 50.0 mm | 1.6 mm | — | — |
| November | 20.9 °C | 6.9 °C | -8.0 °C | 16.3 °C | 3.9 °C | -10.2 °C | 13.6 °C | 0.9 °C | -15.6 °C | 38.7 mm | 1.5 mm | — | — |
| December | 17.8 °C | 3.3 °C | -15.0 °C | 14.1 °C | 0.7 °C | -21.0 °C | 10.8 °C | -1.9 °C | -27.4 °C | 47.6 mm | 1.6 mm | — | — |
Data Visualisations
Remove WatermarksCurrent Year Climate Trends vs Historical


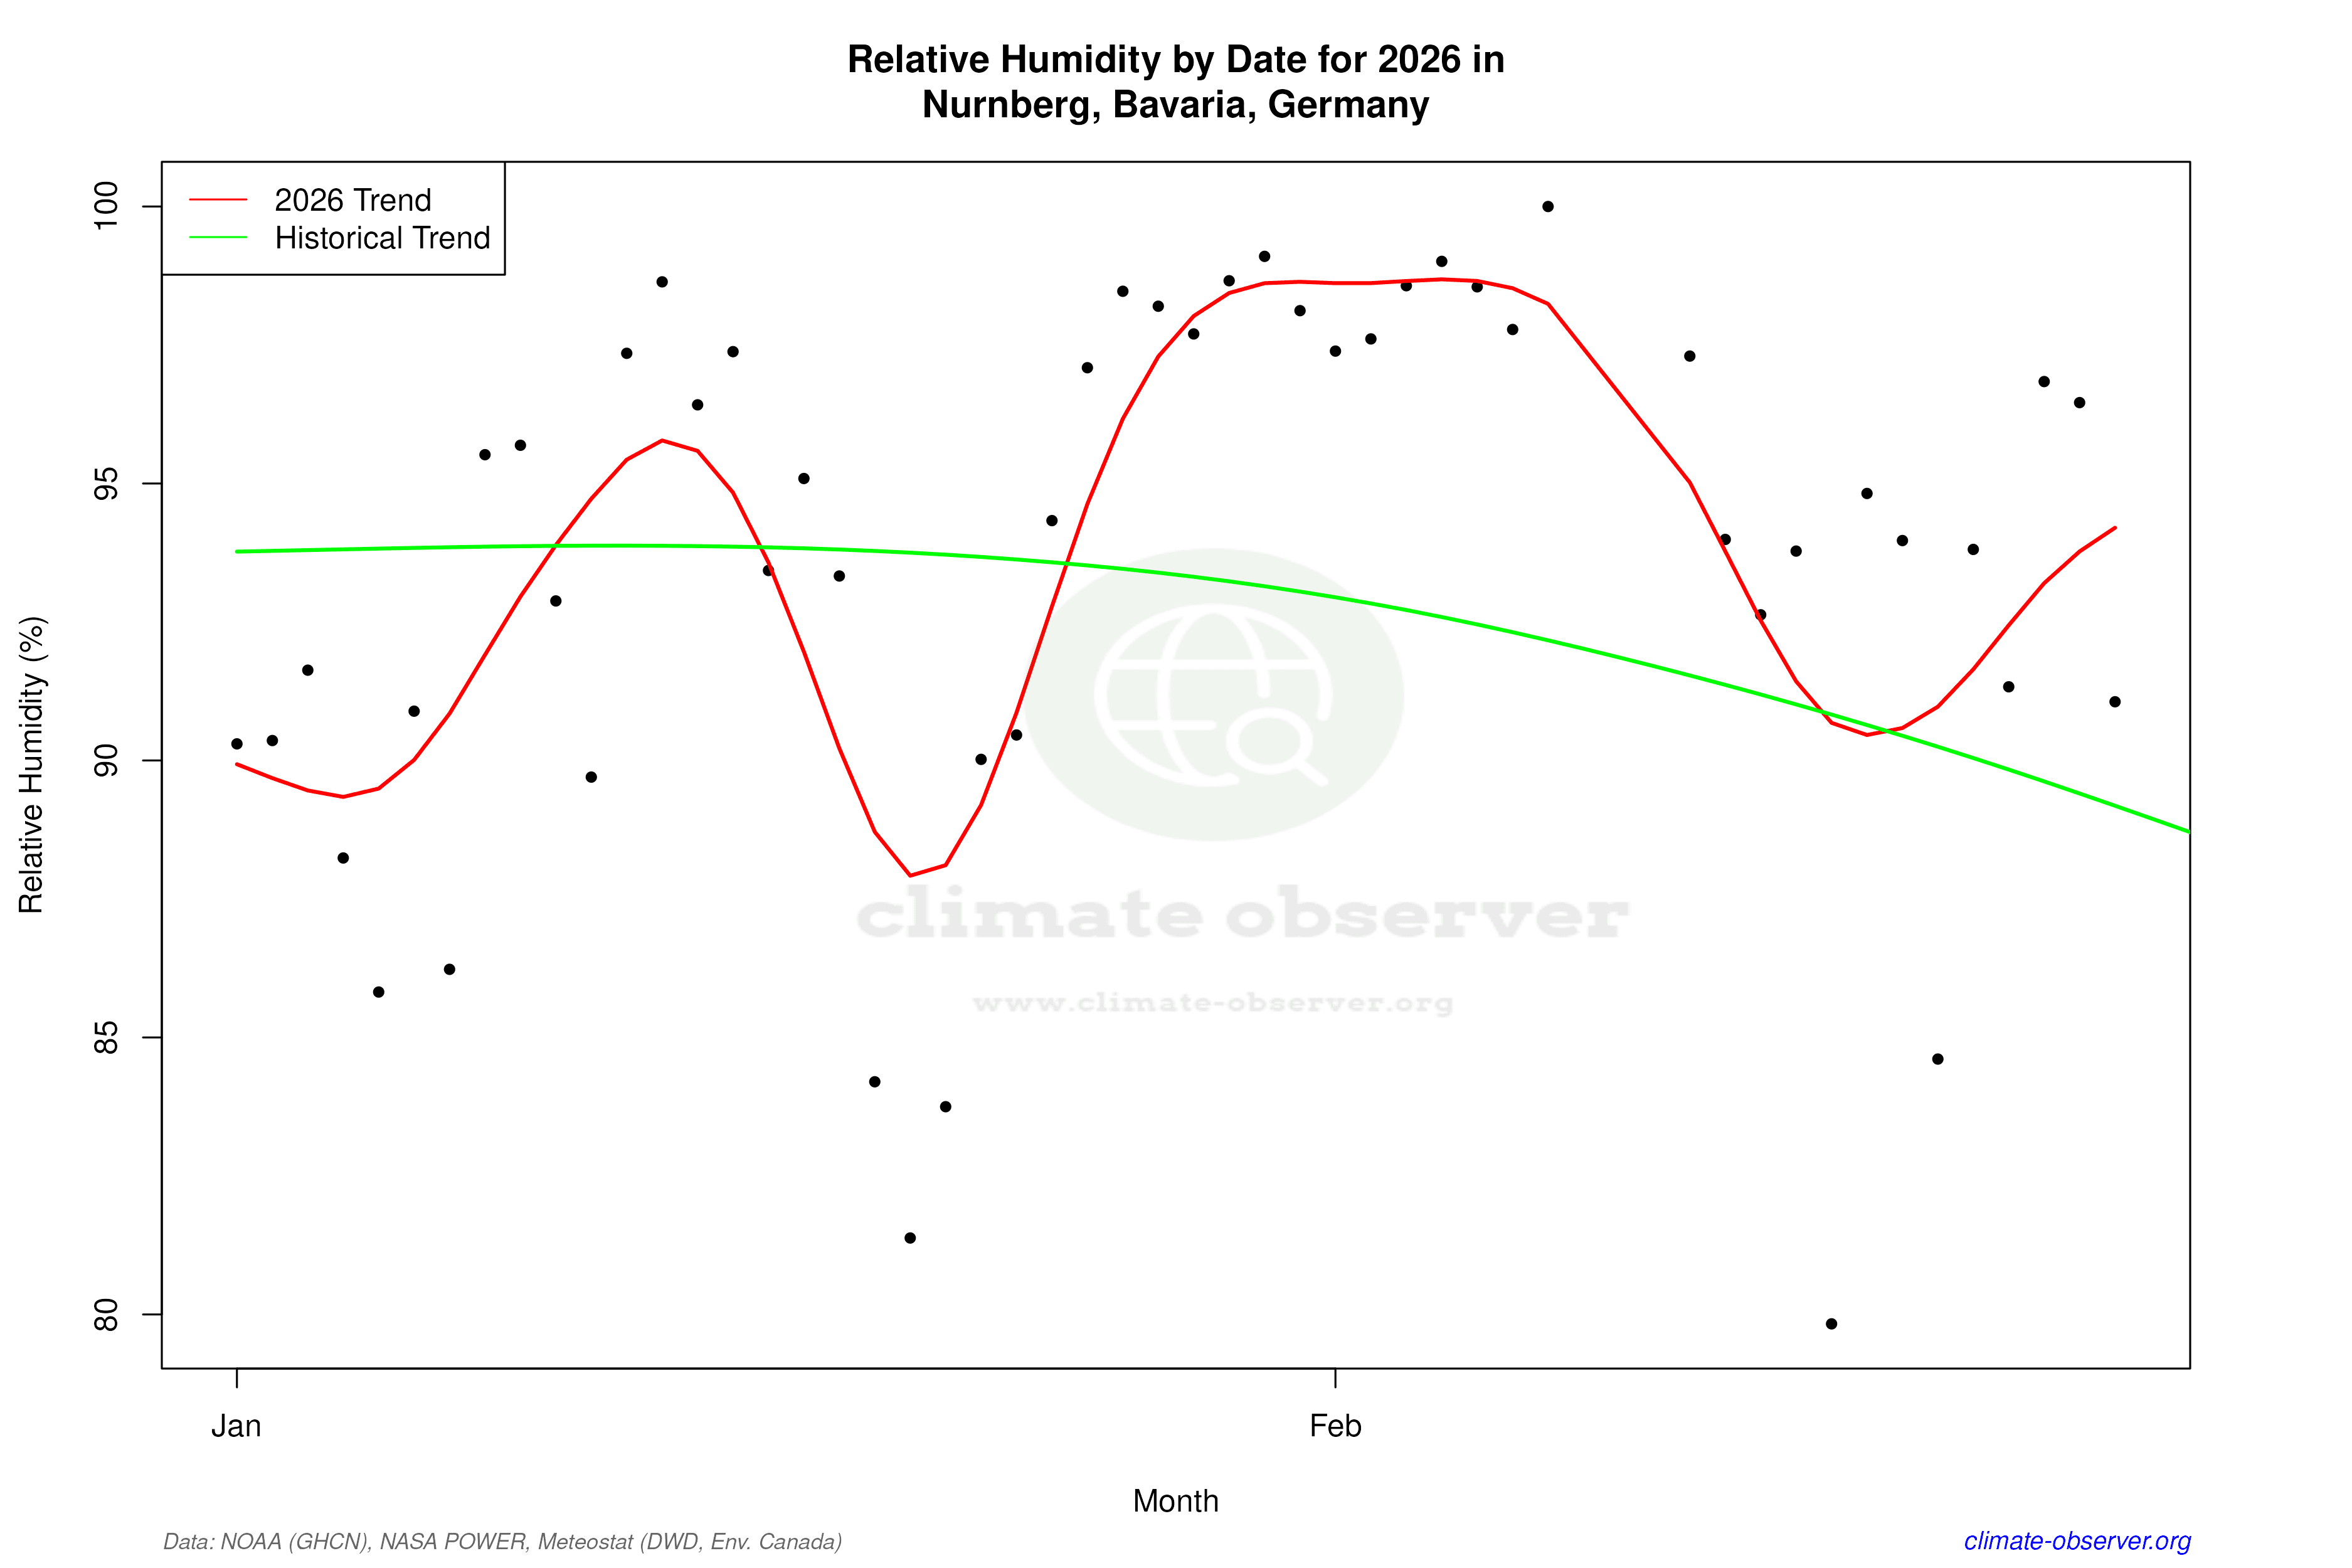

Max Temperature this Year | 1 of 6
Climate 12-Month Moving Averages


Max Temperature 12-Month MA | 1 of 6
Daily Data Points and Averages Throughout the Year

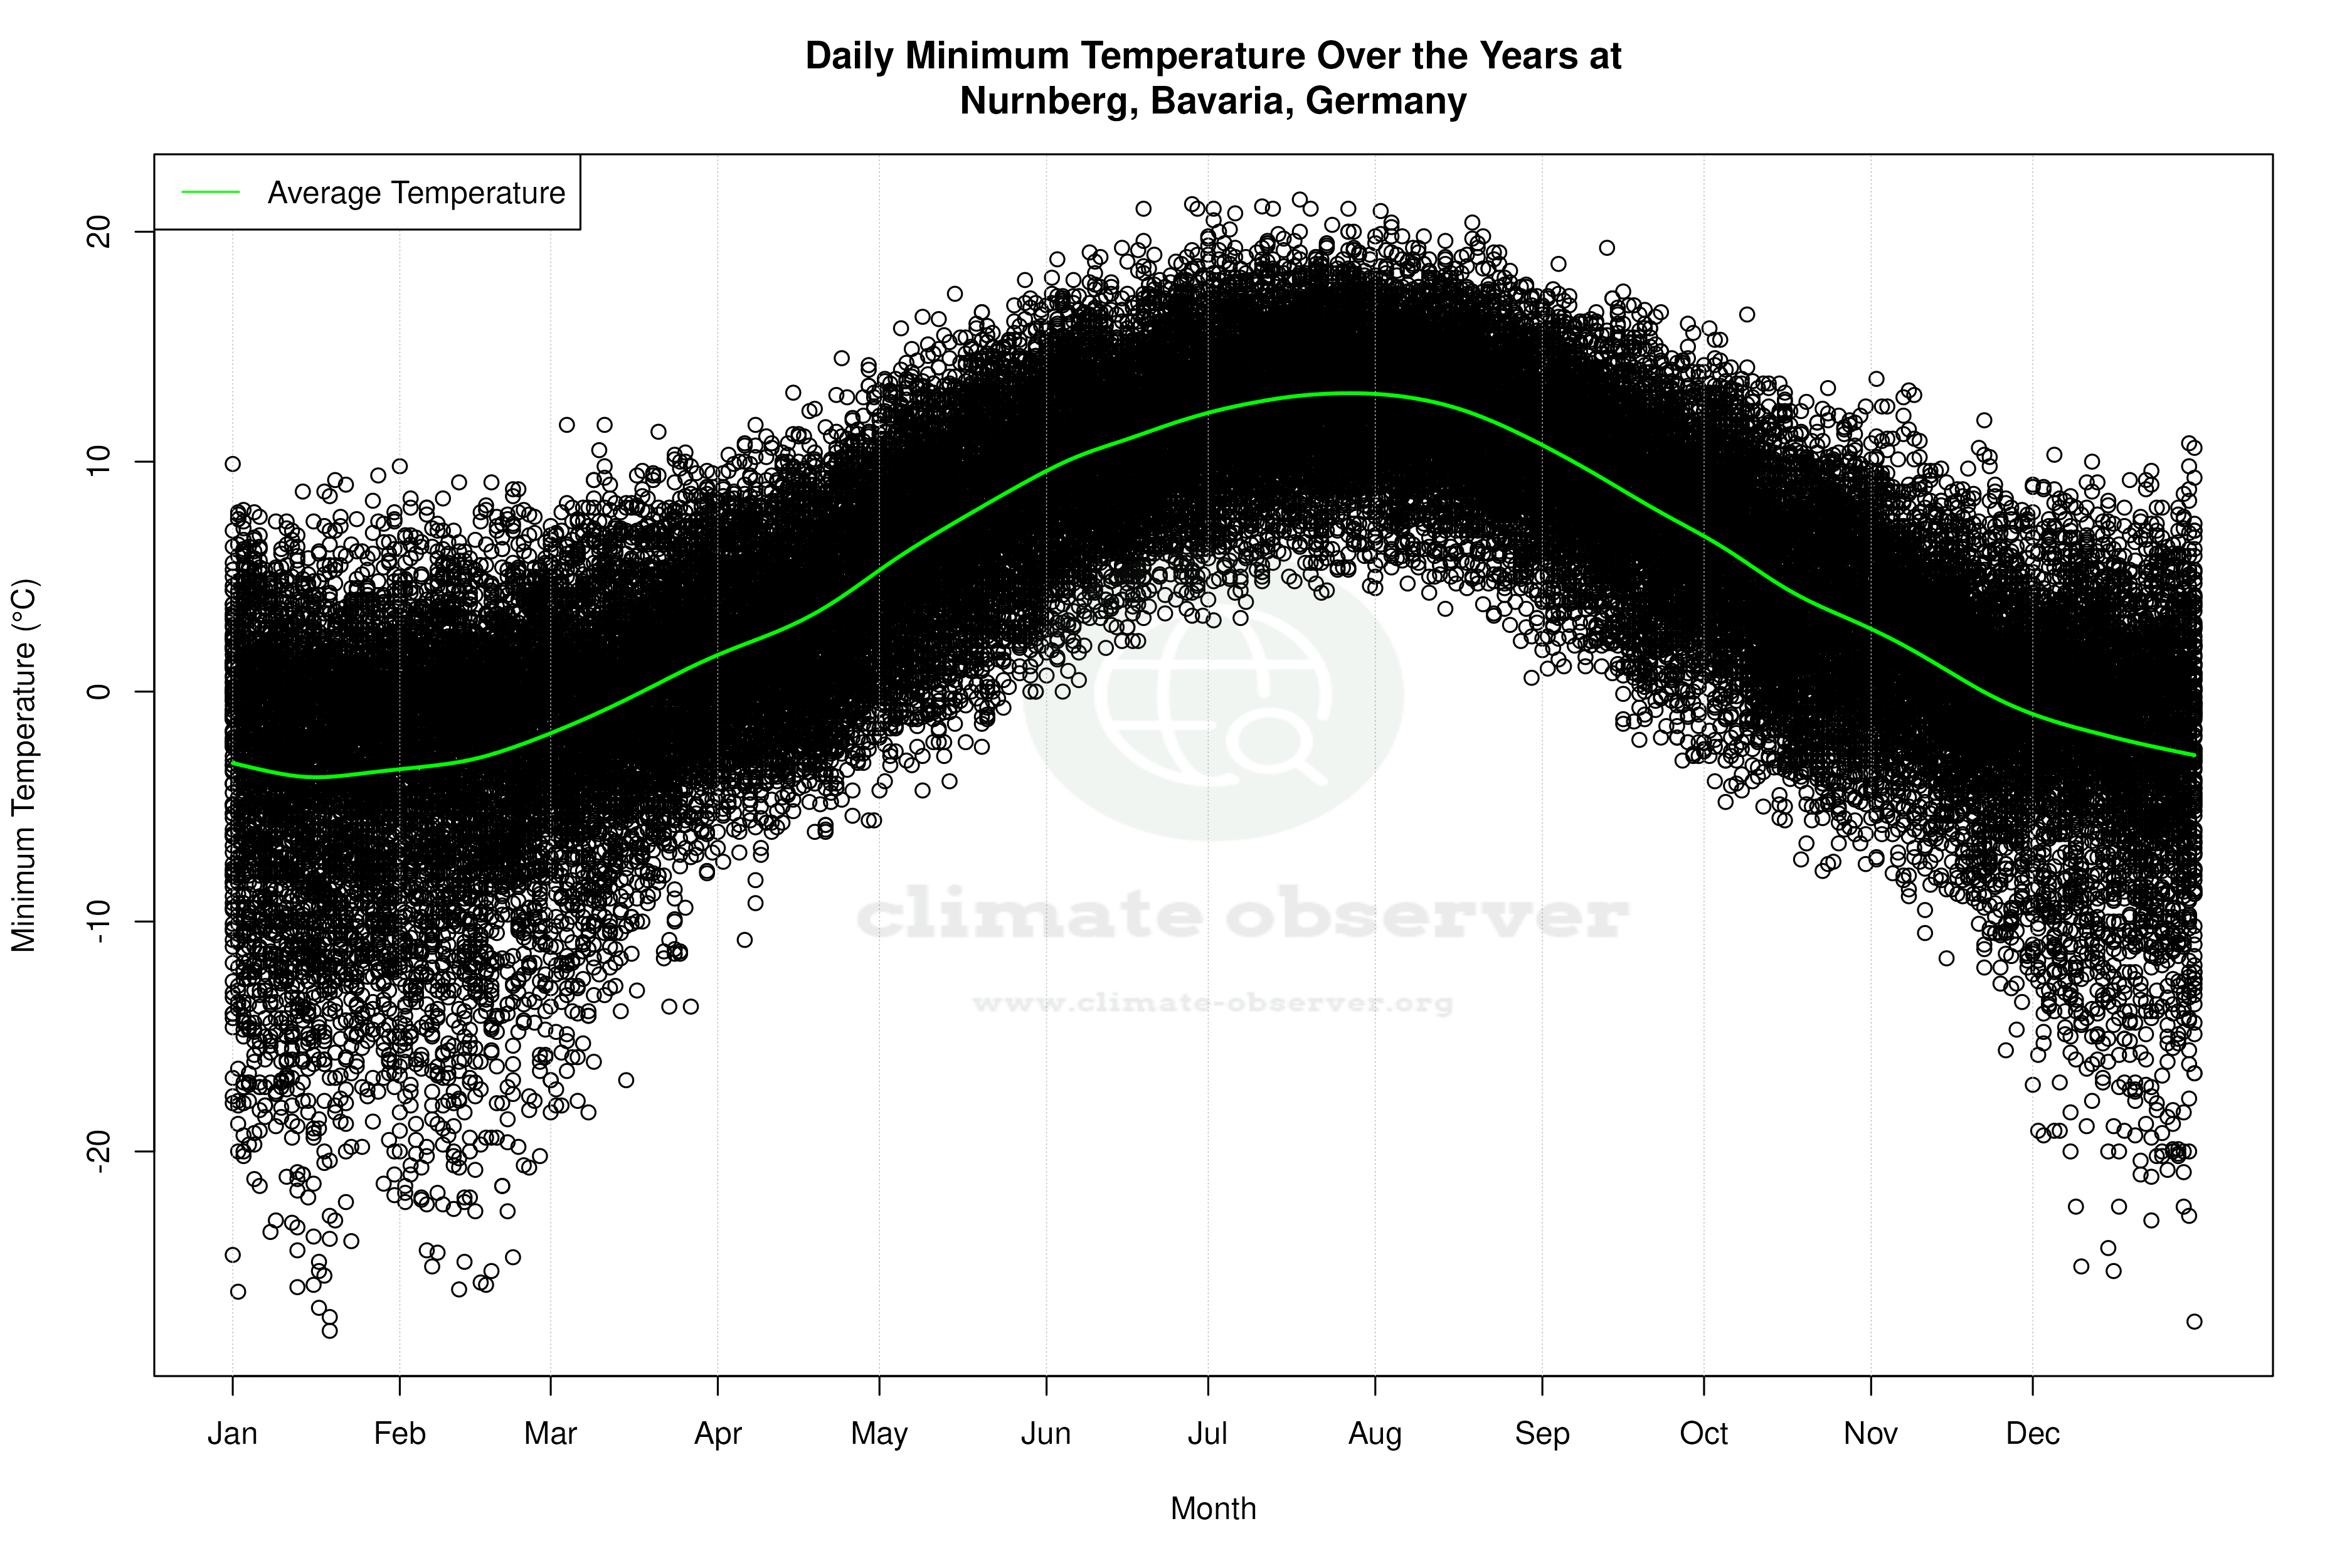

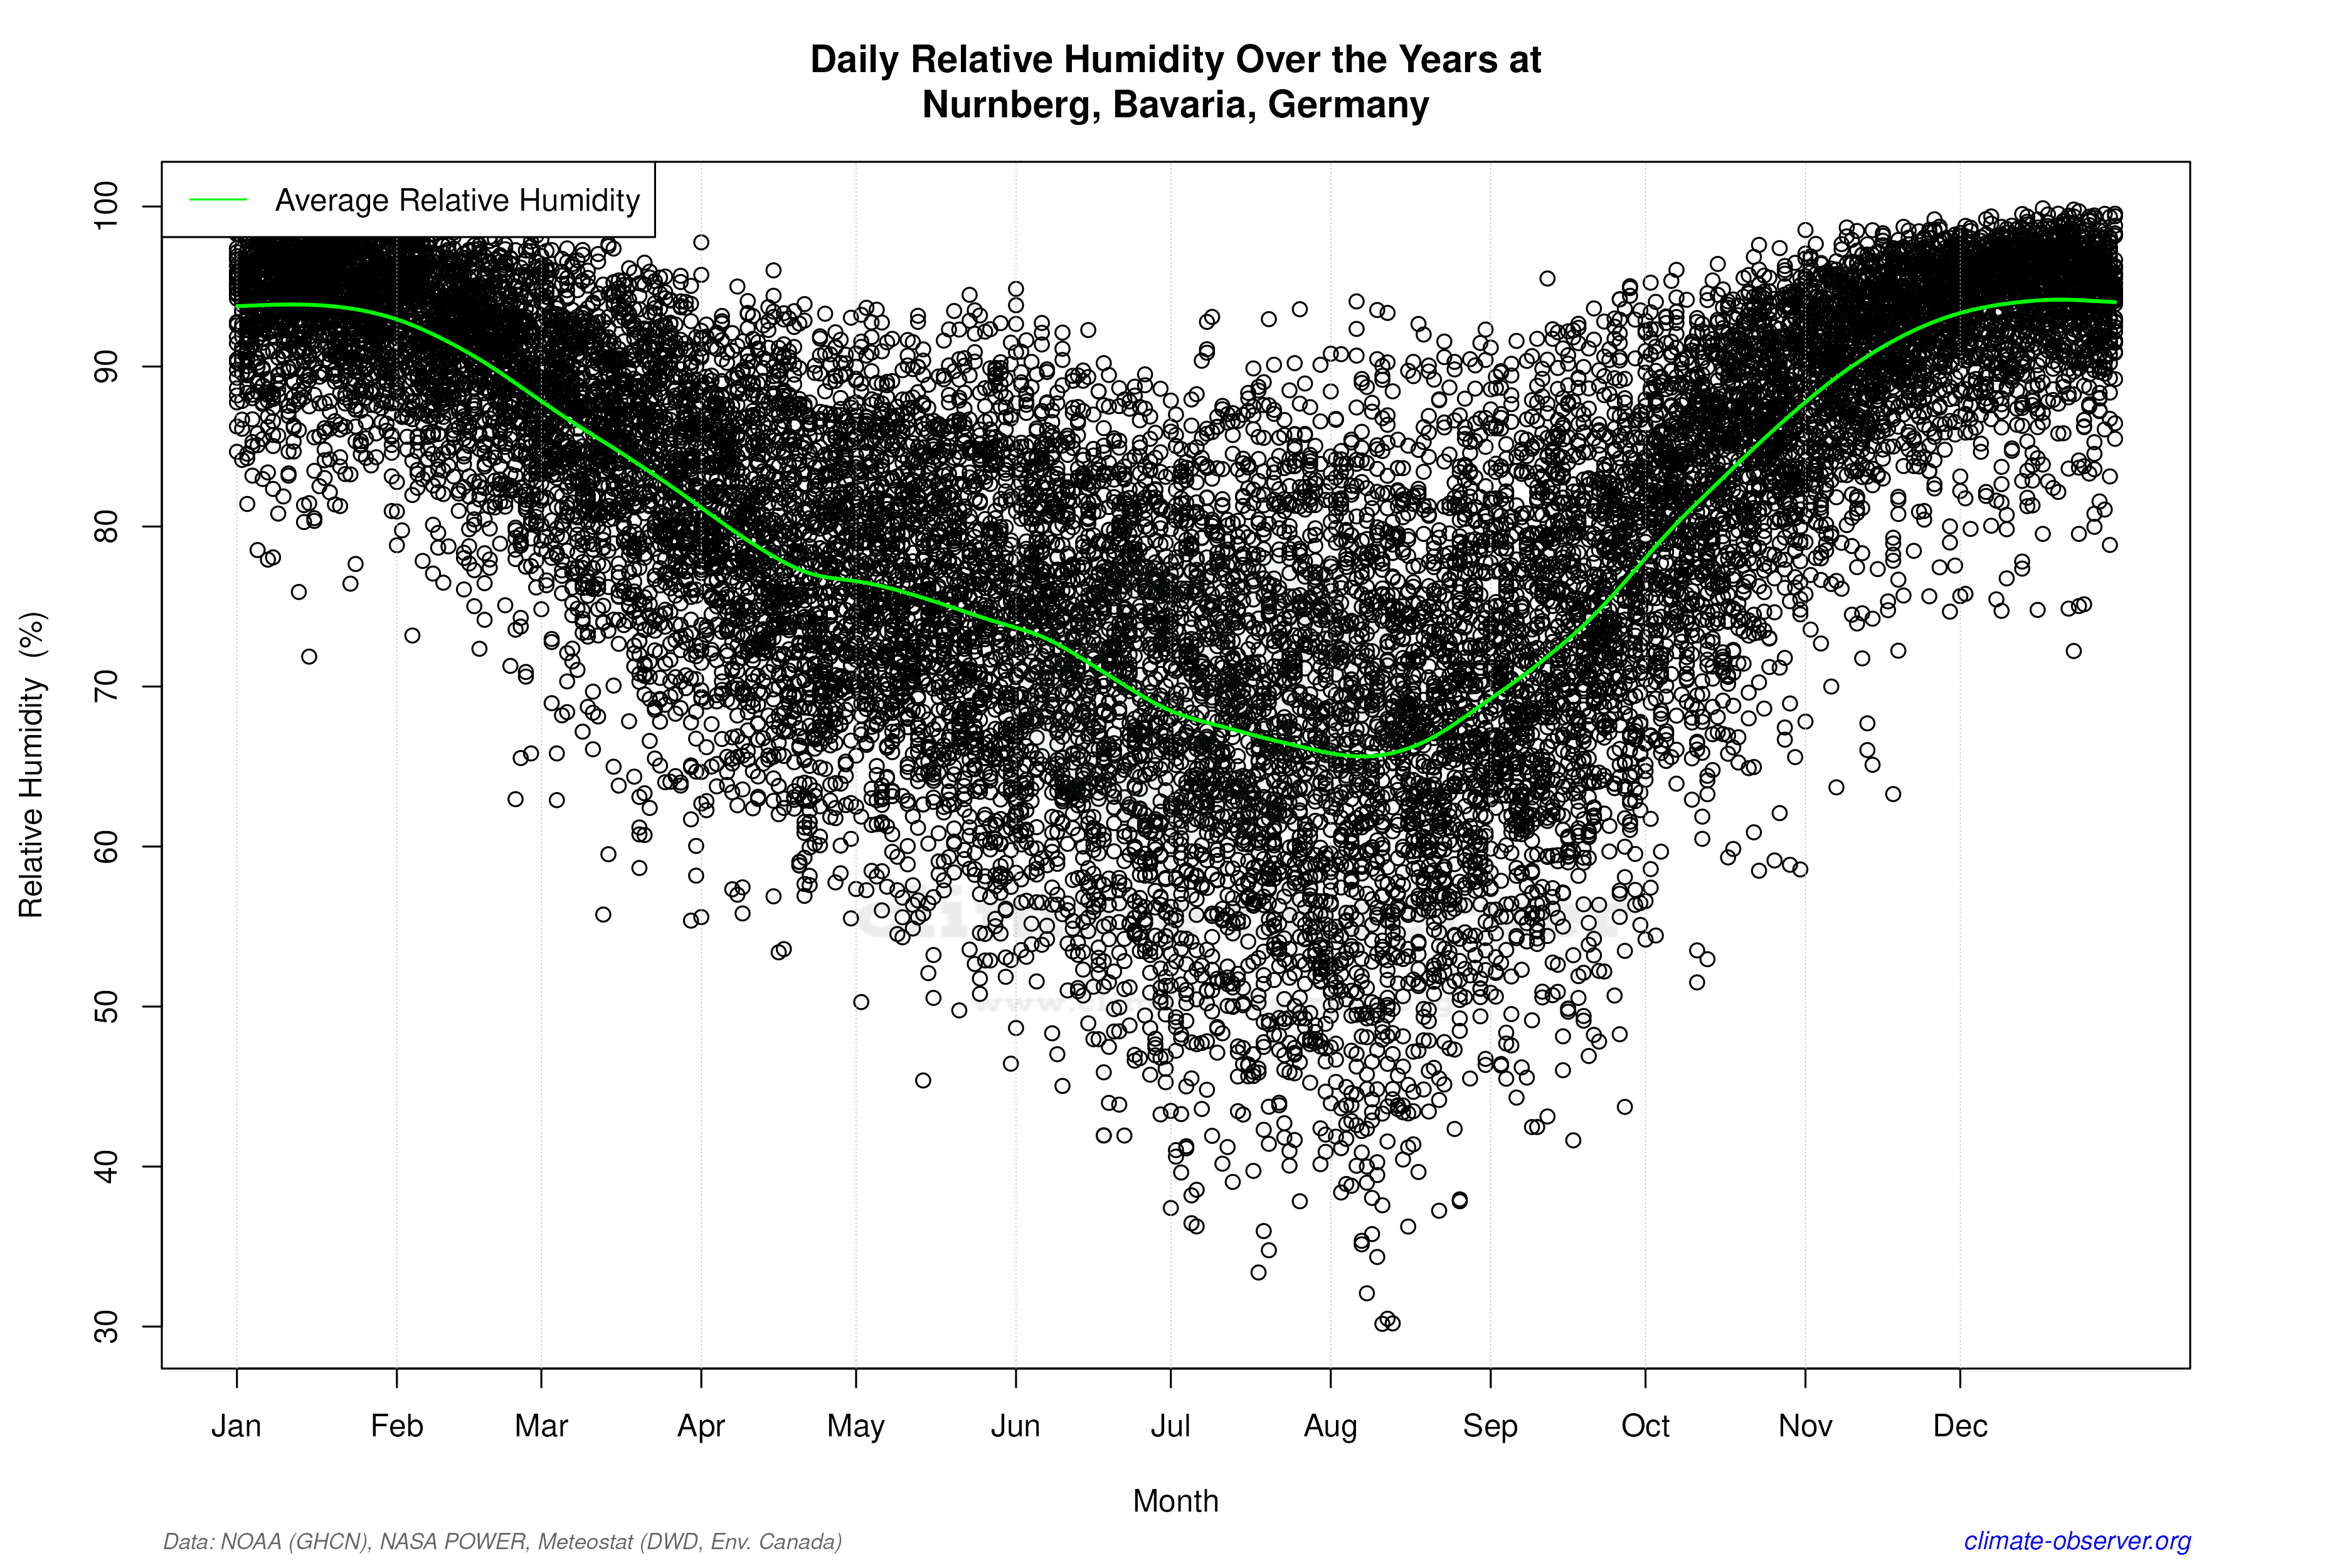

Average Max Temperature Throughout Year | 1 of 5
