Climate for Station: Cottbus, Brandenburg, Germany
Loading live weather...
Climate Analysis & Overview
Cottbus is experiencing a warming trend, with notable increases in both high and low temperatures over the past decade. The precipitation pattern has become slightly more evenly distributed, reflecting subtle shifts in local climate dynamics.
Warming Trends in Cottbus
Cottbus, located in Brandenburg, Germany, is characterised by a temperate oceanic climate according to the Köppen classification. This region has witnessed a notable warming trend over the past decade. The high temperatures have risen by 1.01°C (1.82°F), while the low temperatures have increased by 0.58°C (1.04°F). These changes are more pronounced than the all-time trends, which show a rise of 0.18°C (0.32°F) for highs and 0.08°C (0.14°F) for lows. This discrepancy suggests an acceleration in warming over recent years, possibly influenced by regional climate factors and broader global warming trends.
Temperature Extremes and Records
The temperature extremes in Cottbus provide a stark illustration of its climate variability. The highest recorded temperature is 39.2°C (102.6°F), while the lowest is a frigid -28.0°C (-18.4°F). These records highlight the potential for significant thermal oscillations, which can have profound impacts on local ecosystems and human activities. Such extremes are critical for understanding the resilience and adaptability of the region's infrastructure and natural systems.
Precipitation Patterns and Distribution
The Precipitation Concentration Index (PCI) is a measure of how precipitation is distributed throughout the year. A decrease in PCI from a baseline of 11.54 to a current value of 10.93 indicates a slight shift towards more evenly distributed rainfall events. This subtle change suggests a reduction in the concentration of precipitation into fewer, more intense events, which can influence water management strategies and agricultural planning in the region.
Geographical Influences on Climate
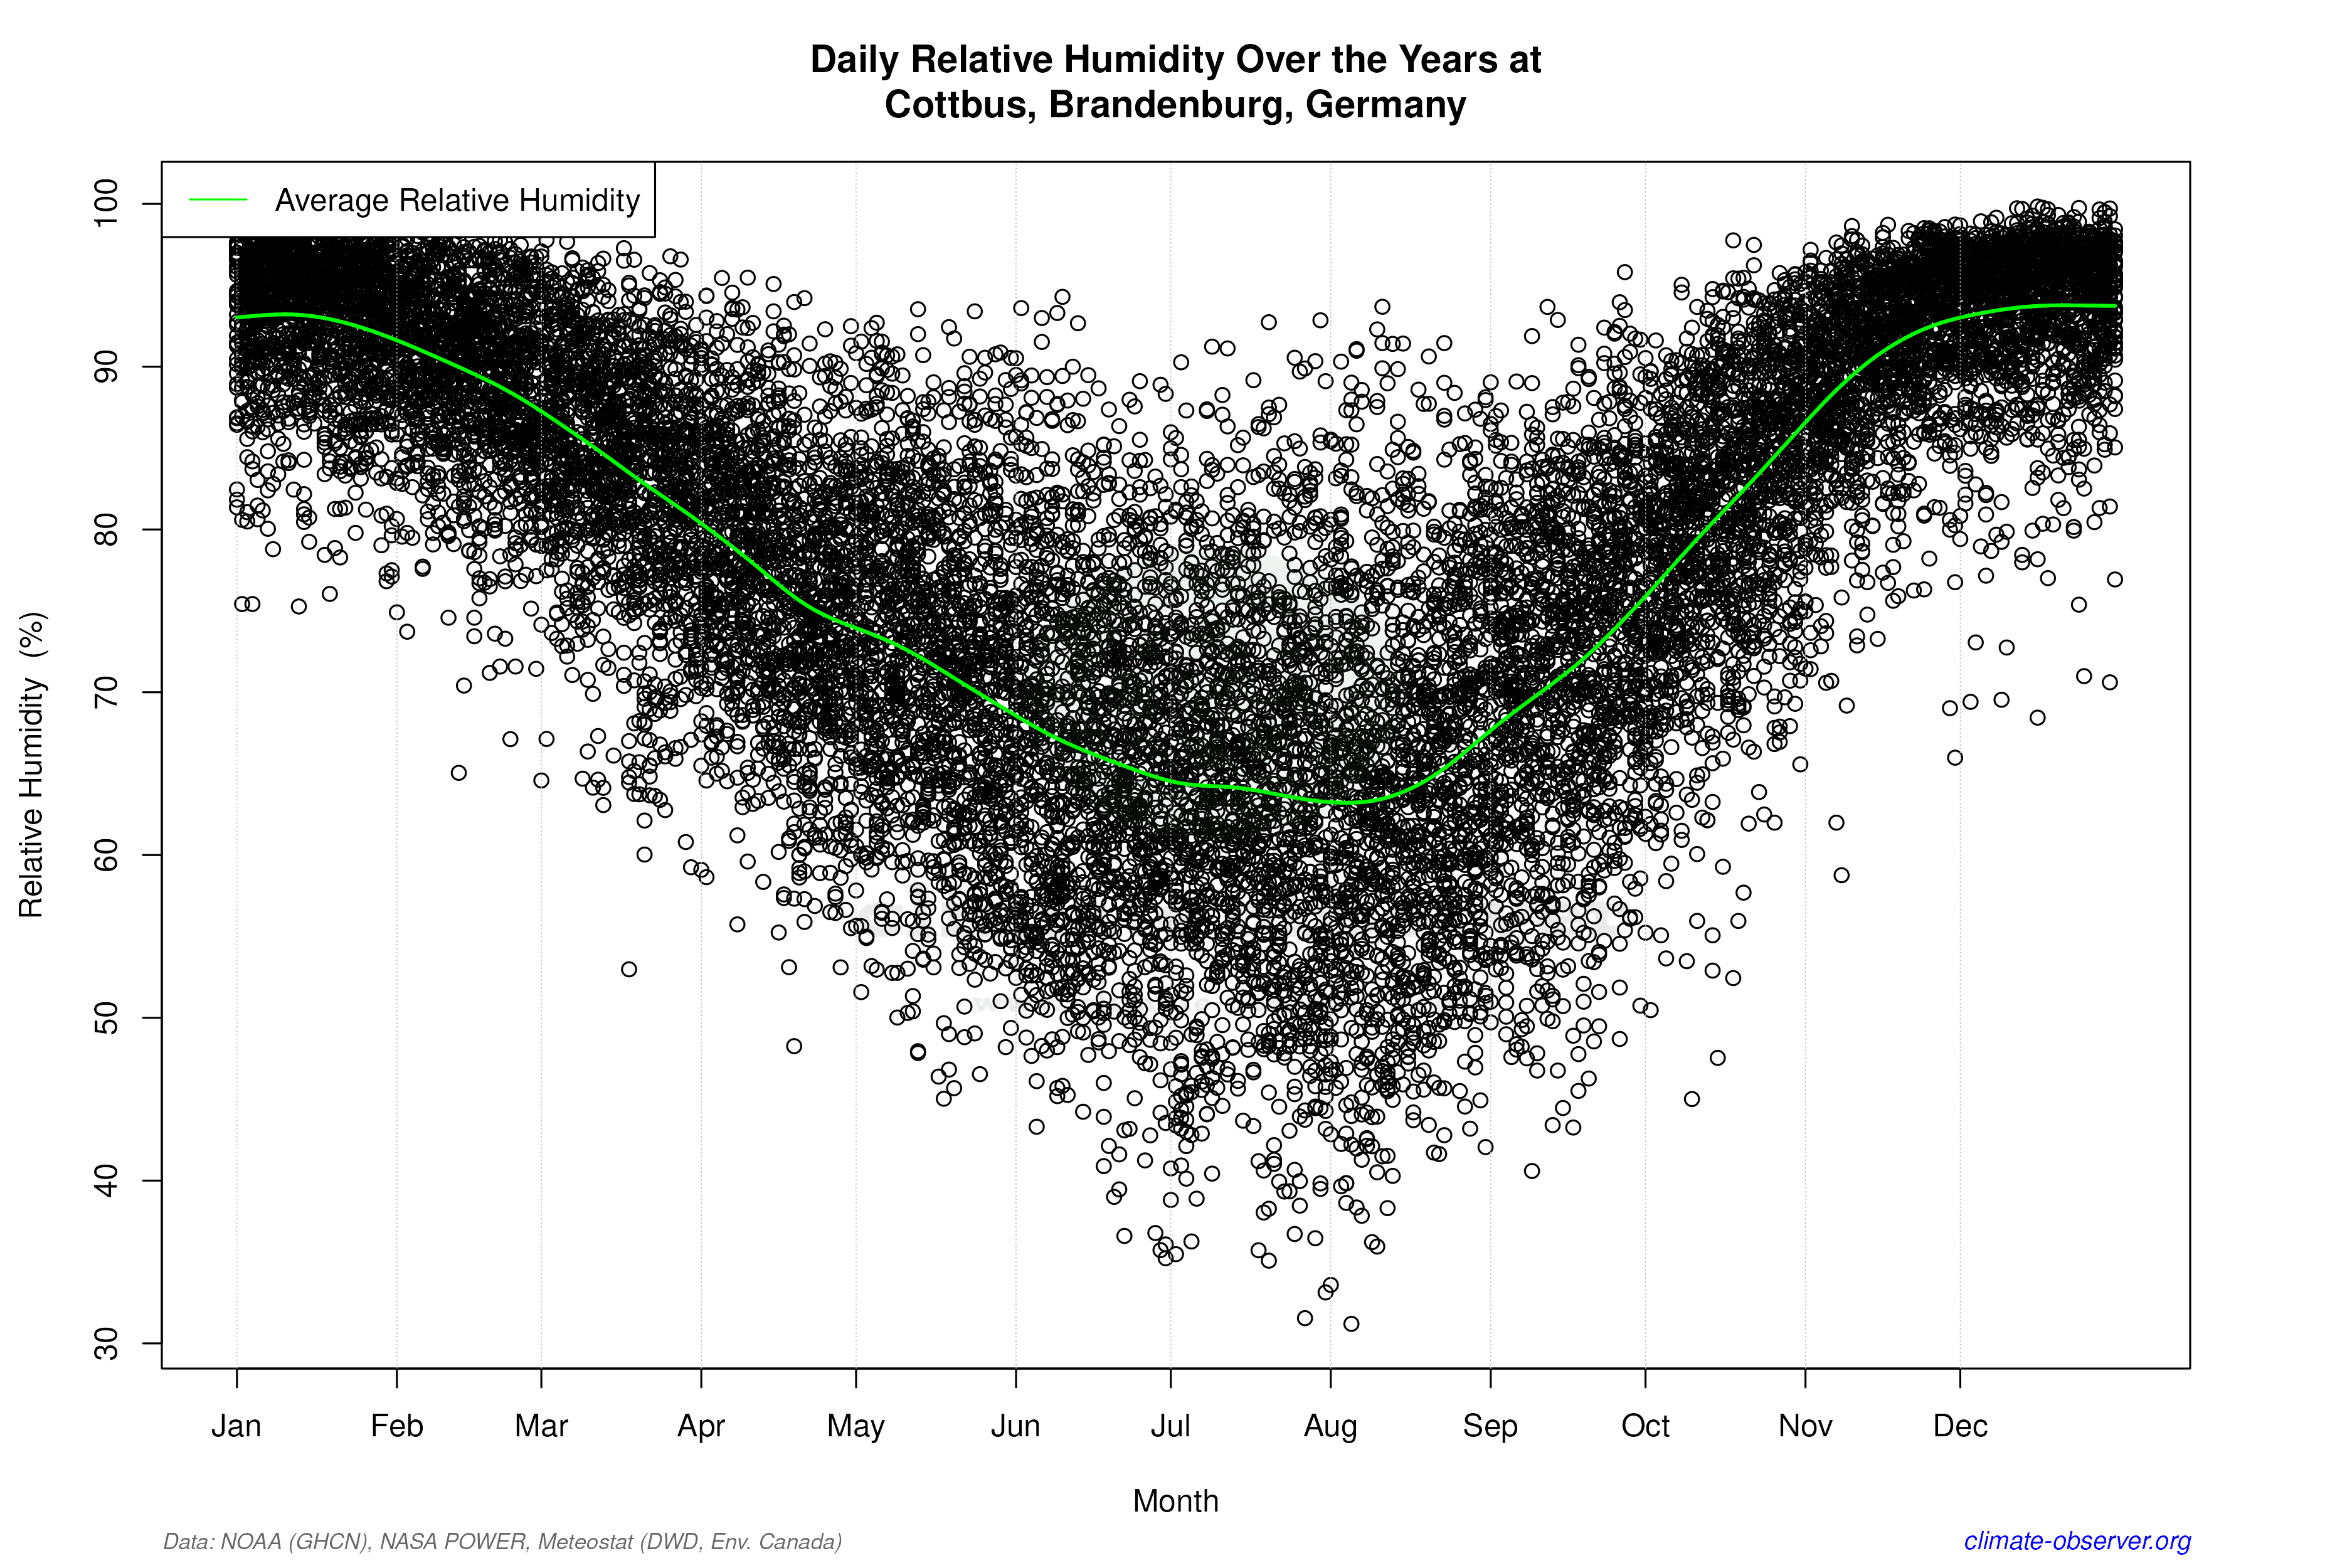
Cottbus's geographical position in the Spree River basin, surrounded by lowlands, influences its climate patterns. The relative flatness of the area allows for the free movement of air masses, contributing to the observed warming trends. Additionally, the proximity to the Spree River may moderate temperature extremes and affect local humidity levels, which in turn can impact the distribution and intensity of precipitation.
Contextualising Climate Goals
Germany has set ambitious climate goals, aiming to reduce greenhouse gas emissions and transition to renewable energy sources. The trends observed in Cottbus are reflective of broader national and global climate challenges. Understanding these localised changes is crucial for informing policy decisions and achieving sustainable development objectives. Recent weather events, such as heatwaves and unseasonal rainfall, underscore the importance of adaptive strategies to mitigate the impacts of climate change on both the environment and society.
Station Statistics
10-Year Trend
High: +0.75 °C/decade
Low: +0.47 °C/decade
Rain: +0.05 mm/decade
25-Year Trend
High: +0.86 °C/decade
Low: +0.41 °C/decade
Rain: -0.07 mm/decade
50-Year Trend
High: +0.55 °C/decade
Low: +0.16 °C/decade
Rain: -0.01 mm/decade
All-Time Trend
High: +0.18 °C/decade
Low: +0.08 °C/decade
Rain: -0.01 mm/decade
Percentage Above-Average Days
Last 12 Months: 57.5%
This Year: 57.8%
Precipitation Concentration Index (PCI) ℹ️
Last 12 Months: 11.5
Historical Average: 11.3
Percentile Rank of Last 12 Months ℹ️
High: 92nd percentile
Low: 75th percentile
Rain: 35th percentile
Change in Variance ℹ️
High: -1.6%
Low: -11.0%
Intraday: +18.1%
Data Coverage
96.2%
First Year of Data
1887
Station Location
Historical Weather Records
| Max High | Avg High | Min High | Max Avg | Avg Avg | Min Avg | Max Low | Avg Low | Min Low | Max Precipitation | Avg Precipitation | Max Snow | Avg Snow | |
|---|---|---|---|---|---|---|---|---|---|---|---|---|---|
| Record | 39.2 °C | — | -19.0 °C | 31.1 °C | — | -24.1 °C | 25.7 °C | — | -28.0 °C | 130.6 mm | — | — | — |
| January | 17.8 °C | 2.4 °C | -18.3 °C | 15.4 °C | -0.2 °C | -21.0 °C | 11.7 °C | -3.1 °C | -28.0 °C | 59.1 mm | 1.3 mm | — | — |
| February | 20.6 °C | 4.0 °C | -19.0 °C | 13.2 °C | 0.6 °C | -24.1 °C | 11.8 °C | -2.7 °C | -27.7 °C | 24.4 mm | 1.1 mm | — | — |
| March | 25.9 °C | 8.6 °C | -9.2 °C | 17.4 °C | 4.1 °C | -13.9 °C | 11.5 °C | -0.0 °C | -20.1 °C | 34.7 mm | 1.1 mm | — | — |
| April | 31.2 °C | 14.0 °C | -0.1 °C | 23.0 °C | 8.7 °C | -4.8 °C | 19.5 °C | 3.4 °C | -14.2 °C | 34.4 mm | 1.3 mm | — | — |
| May | 33.6 °C | 19.5 °C | 3.0 °C | 27.0 °C | 13.9 °C | 0.2 °C | 19.3 °C | 8.0 °C | -3.5 °C | 60.1 mm | 1.7 mm | — | — |
| June | 39.2 °C | 22.9 °C | 10.5 °C | 31.1 °C | 17.4 °C | 7.5 °C | 25.7 °C | 11.4 °C | -1.9 °C | 76.0 mm | 2.0 mm | — | — |
| July | 38.9 °C | 24.5 °C | 10.6 °C | 30.6 °C | 19.0 °C | 9.6 °C | 23.0 °C | 13.3 °C | 4.3 °C | 73.3 mm | 2.4 mm | — | — |
| August | 38.5 °C | 23.9 °C | 12.0 °C | 30.5 °C | 18.2 °C | 9.2 °C | 21.7 °C | 12.8 °C | 3.2 °C | 130.6 mm | 2.1 mm | — | — |
| September | 34.5 °C | 19.7 °C | 8.3 °C | 25.9 °C | 14.2 °C | 4.4 °C | 19.5 °C | 9.4 °C | -2.7 °C | 50.7 mm | 1.5 mm | — | — |
| October | 29.2 °C | 13.8 °C | 0.1 °C | 20.8 °C | 9.4 °C | -3.6 °C | 16.5 °C | 5.5 °C | -10.2 °C | 44.3 mm | 1.4 mm | — | — |
| November | 20.2 °C | 7.3 °C | -11.2 °C | 16.3 °C | 4.4 °C | -13.1 °C | 15.7 °C | 1.5 °C | -14.4 °C | 47.1 mm | 1.4 mm | — | — |
| December | 17.9 °C | 3.6 °C | -14.6 °C | 14.5 °C | 1.2 °C | -19.3 °C | 11.9 °C | -1.4 °C | -22.2 °C | 20.7 mm | 1.3 mm | — | — |
Data Visualisations
Remove WatermarksCurrent Year Climate Trends vs Historical


Max Temperature this Year | 1 of 6
Climate 12-Month Moving Averages


Max Temperature 12-Month MA | 1 of 6
Daily Data Points and Averages Throughout the Year


Average Max Temperature Throughout Year | 1 of 5
