Climate for Station: Leipzig-Holzhausen, Saxony, Germany
Loading live weather...
Climate Analysis & Overview
Leipzig-Holzhausen is experiencing a warming trend, with significant temperature increases over the past decade, particularly in high temperatures. Precipitation patterns have become more evenly distributed, suggesting shifts in local climate dynamics that align with broader regional climate goals in Germany.
Warming Trends in Leipzig-Holzhausen
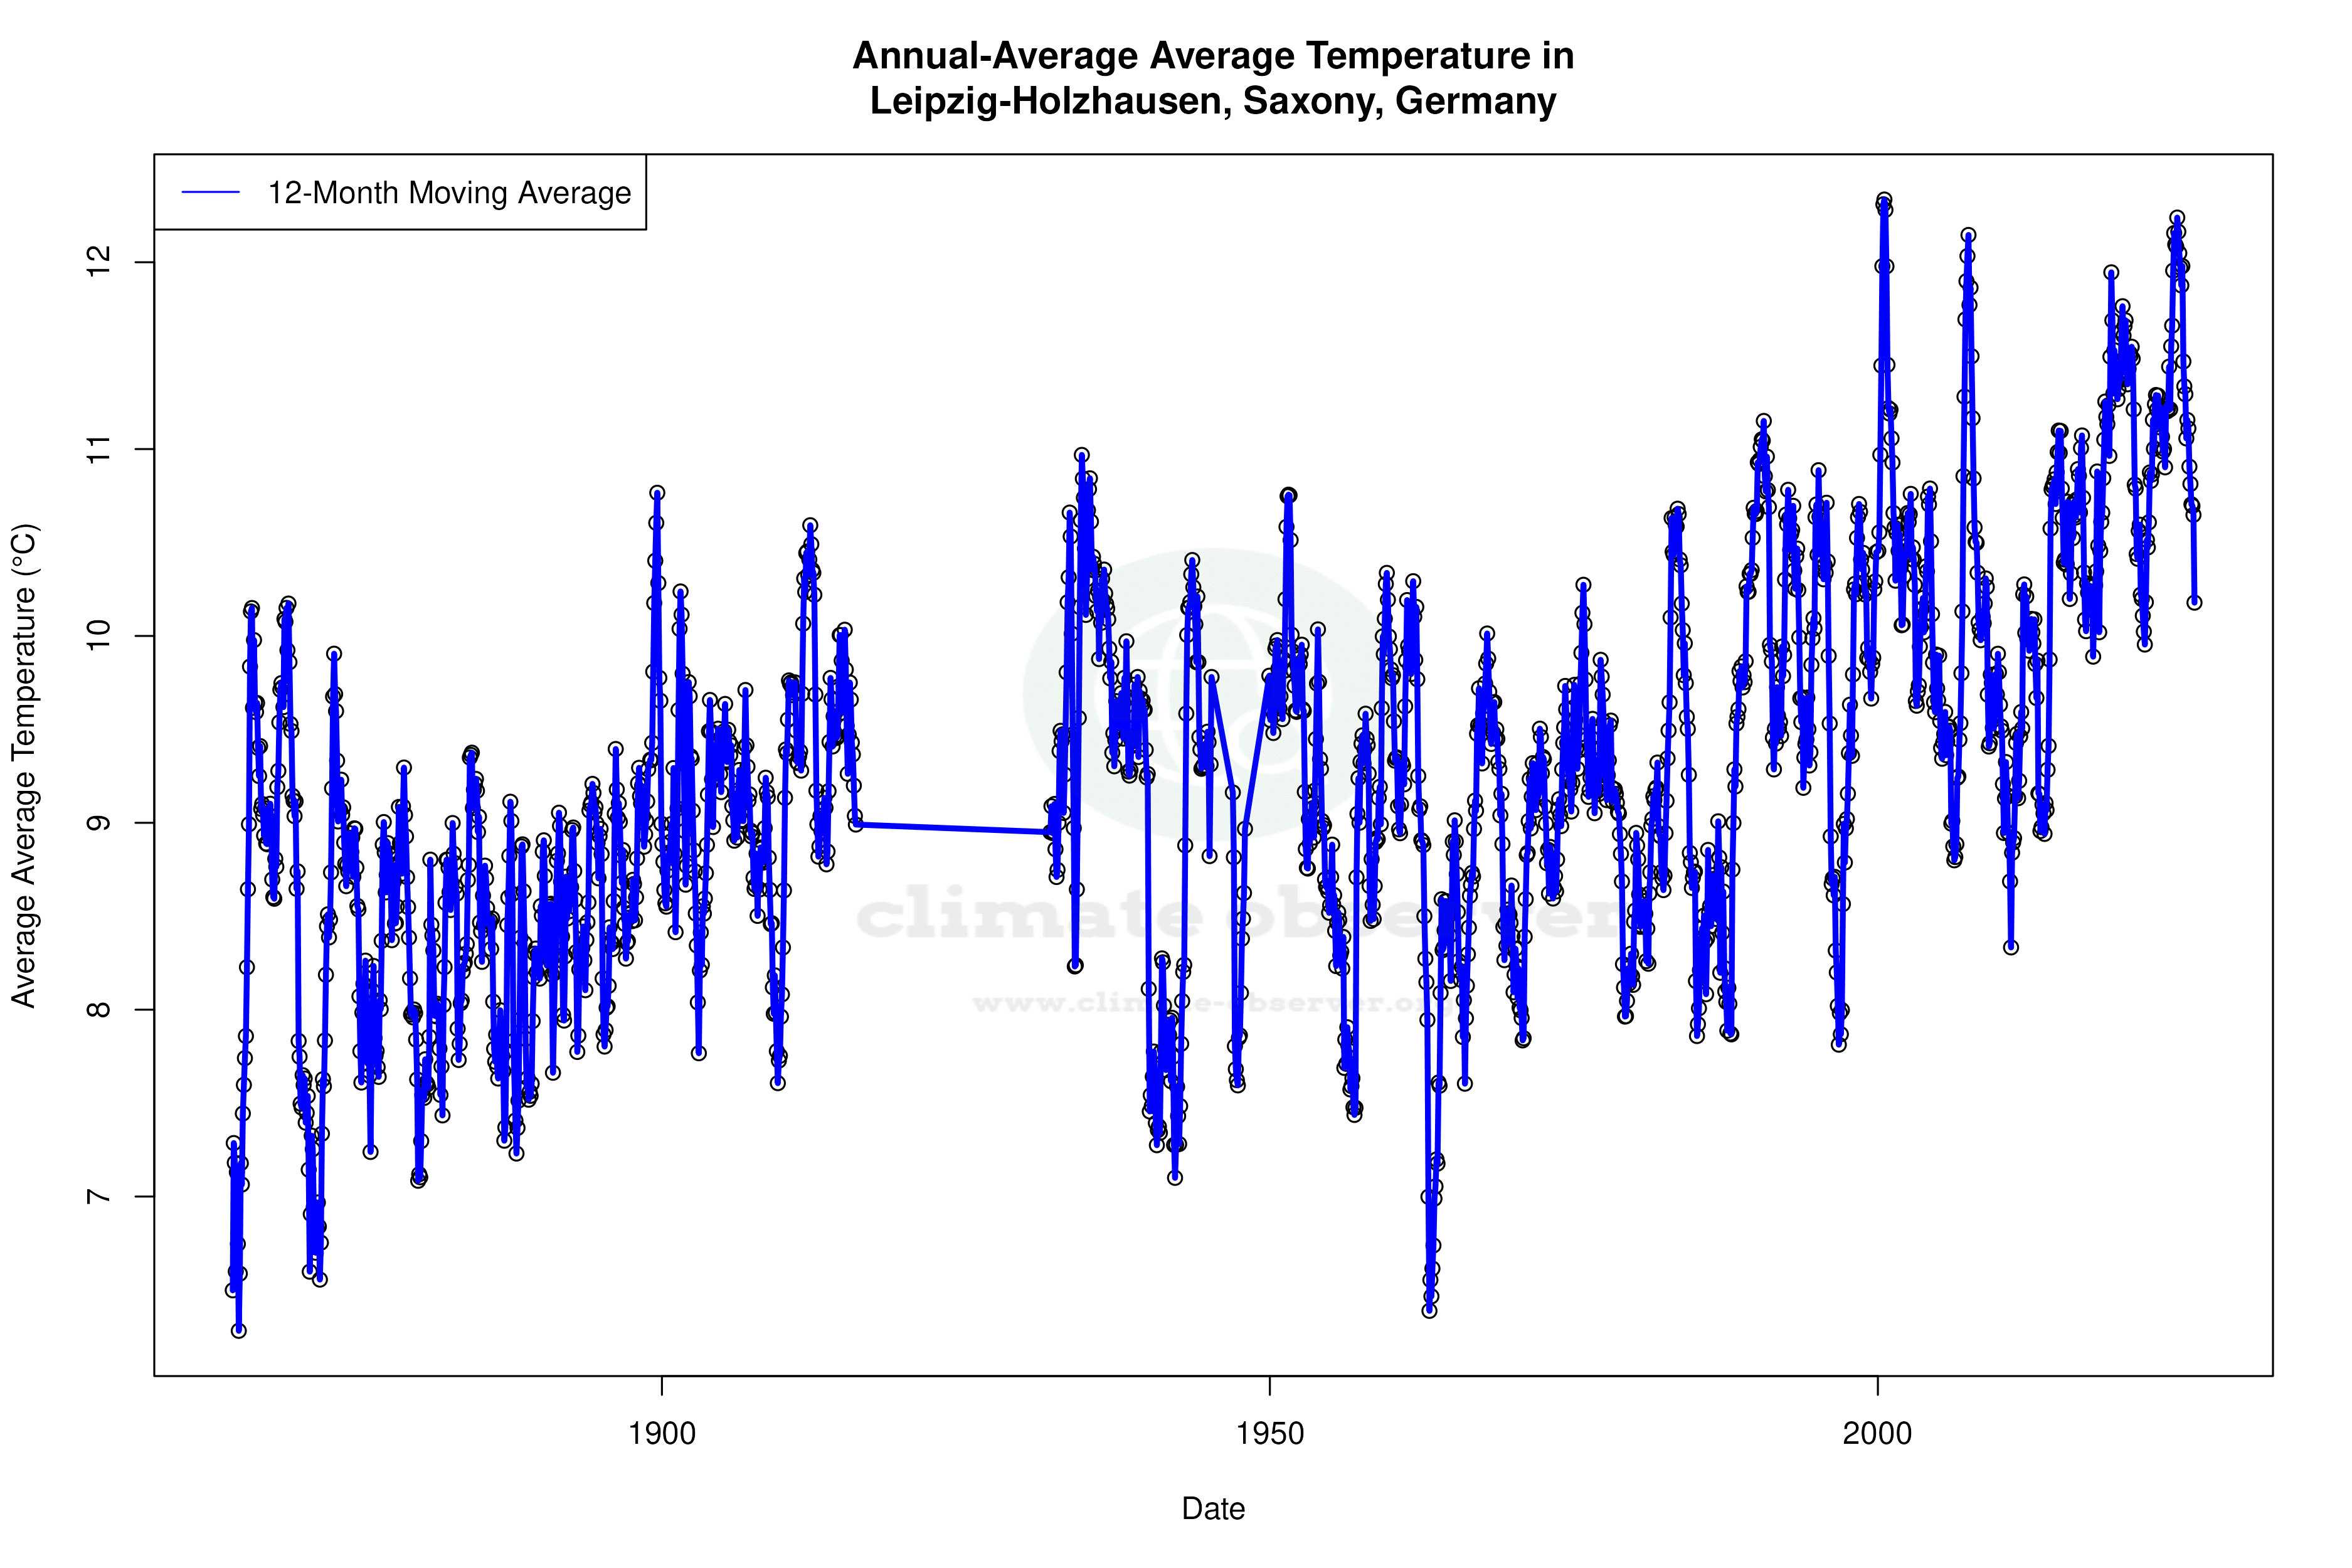
Leipzig-Holzhausen, positioned at 51.3164°N, 12.4475°E, falls under the Köppen climate classification of Cfb, indicating a temperate oceanic climate with warm summers and no dry season. Over the last decade, the region has experienced a notable warming trend. High temperatures have increased by 1.01°C (1.82°F), while low temperatures have risen by 0.55°C (0.99°F). These changes are more pronounced than the all-time trends, which show a more modest warming of 0.16°C (0.29°F) for highs and 0.07°C (0.13°F) for lows. This disparity suggests an acceleration in warming, particularly in recent years, which is significant in the context of Germany's climate goals aimed at reducing greenhouse gas emissions and mitigating climate change impacts.
Temperature Extremes and Historical Context
The historical temperature records for Leipzig-Holzhausen highlight the region's climatic variability. The highest recorded temperature is 38.4°C (101.1°F), while the lowest is -26.9°C (-16.4°F). These extremes underscore the potential for both summer heatwaves and harsh winter conditions. The warming trend, particularly in high temperatures, may lead to more frequent and intense heatwaves, challenging local infrastructure and health systems.
Precipitation Patterns: A Shift Towards Even Distribution
The Precipitation Concentration Index (PCI) for Leipzig-Holzhausen has shifted from a baseline of 11.15 to a current value of 10.24. This decrease indicates that precipitation is becoming more evenly distributed throughout the year. A PCI below 10 suggests a very even distribution, and while Leipzig-Holzhausen's current PCI is slightly above this threshold, the trend towards evenness is clear. This change may reduce the risk of flooding and droughts, aligning with Germany's efforts to adapt to climate variability by enhancing water management strategies.
Regional Climate Dynamics and Implications
The geographical setting of Leipzig-Holzhausen, with its proximity to the larger urban area of Leipzig and the influence of the Elbe River basin, plays a crucial role in its climate dynamics. The warming trends observed are consistent with regional climate models predicting increased temperatures due to anthropogenic climate change. As Germany continues to pursue its climate goals, including the transition to renewable energy and improved energy efficiency, understanding these localised climate changes becomes increasingly important. The even distribution of precipitation could support agricultural resilience, a key consideration for regional planning and sustainability efforts.
Future Considerations for Leipzig-Holzhausen
The observed climatic trends in Leipzig-Holzhausen provide a microcosm of broader climatic shifts occurring across Germany and Europe. The warming trend, particularly in high temperatures, necessitates adaptive measures in urban planning and public health. Additionally, the more even distribution of precipitation offers opportunities for improved water resource management. As Germany progresses towards its climate objectives, the insights gained from stations like Leipzig-Holzhausen will be invaluable in shaping effective climate policies and strategies.
Station Statistics
10-Year Trend
High: +0.75 °C/decade
Low: +0.43 °C/decade
Rain: +0.28 mm/decade
25-Year Trend
High: +0.89 °C/decade
Low: +0.21 °C/decade
Rain: -0.11 mm/decade
50-Year Trend
High: +0.54 °C/decade
Low: +0.10 °C/decade
Rain: -0.01 mm/decade
All-Time Trend
High: +0.16 °C/decade
Low: +0.07 °C/decade
Rain: -0.00 mm/decade
Percentage Above-Average Days
Last 12 Months: 57.8%
This Year: 61.5%
Precipitation Concentration Index (PCI) ℹ️
Last 12 Months: 9.9
Historical Average: 10.9
Percentile Rank of Last 12 Months ℹ️
High: 94th percentile
Low: 69th percentile
Rain: 18th percentile
Change in Variance ℹ️
High: -2.5%
Low: -13.8%
Intraday: +36.4%
Data Coverage
91.9%
First Year of Data
1863
Station Location
Historical Weather Records
| Max High | Avg High | Min High | Max Avg | Avg Avg | Min Avg | Max Low | Avg Low | Min Low | Max Precipitation | Avg Precipitation | Max Snow | Avg Snow | |
|---|---|---|---|---|---|---|---|---|---|---|---|---|---|
| Record | 38.4 °C | — | -19.3 °C | 30.0 °C | — | -23.1 °C | 24.9 °C | — | -26.9 °C | 115.8 mm | — | — | — |
| January | 16.1 °C | 2.5 °C | -17.9 °C | 14.5 °C | -0.1 °C | -23.0 °C | 13.2 °C | -2.6 °C | -26.9 °C | 24.0 mm | 1.3 mm | — | — |
| February | 20.3 °C | 4.1 °C | -19.3 °C | 13.1 °C | 1.0 °C | -23.1 °C | 11.7 °C | -1.9 °C | -25.8 °C | 48.7 mm | 1.3 mm | — | — |
| March | 24.5 °C | 8.2 °C | -7.5 °C | 16.4 °C | 4.2 °C | -12.7 °C | 11.8 °C | 0.6 °C | -16.9 °C | 33.5 mm | 1.3 mm | — | — |
| April | 30.4 °C | 13.6 °C | -0.6 °C | 22.1 °C | 8.8 °C | -2.6 °C | 15.3 °C | 4.2 °C | -6.6 °C | 36.1 mm | 1.4 mm | — | — |
| May | 32.2 °C | 18.6 °C | 2.9 °C | 25.0 °C | 13.5 °C | 1.4 °C | 20.4 °C | 8.5 °C | -3.3 °C | 55.7 mm | 1.8 mm | — | — |
| June | 38.4 °C | 22.2 °C | 9.0 °C | 30.0 °C | 17.1 °C | 7.9 °C | 24.9 °C | 12.1 °C | 1.2 °C | 75.1 mm | 2.2 mm | — | — |
| July | 37.8 °C | 23.9 °C | 10.7 °C | 29.9 °C | 18.7 °C | 9.5 °C | 24.0 °C | 13.8 °C | 6.5 °C | 65.3 mm | 2.5 mm | — | — |
| August | 38.0 °C | 23.4 °C | 12.0 °C | 29.1 °C | 18.1 °C | 9.4 °C | 22.7 °C | 13.3 °C | 3.1 °C | 115.8 mm | 2.1 mm | — | — |
| September | 34.9 °C | 19.4 °C | 6.5 °C | 25.8 °C | 14.3 °C | 4.7 °C | 19.2 °C | 10.0 °C | -1.4 °C | 73.5 mm | 1.6 mm | — | — |
| October | 28.3 °C | 13.6 °C | -0.7 °C | 21.5 °C | 9.4 °C | -1.9 °C | 16.5 °C | 5.9 °C | -7.0 °C | 75.0 mm | 1.5 mm | — | — |
| November | 21.4 °C | 7.3 °C | -9.9 °C | 17.6 °C | 4.5 °C | -12.2 °C | 14.5 °C | 1.9 °C | -17.6 °C | 55.0 mm | 1.5 mm | — | — |
| December | 17.6 °C | 3.6 °C | -17.9 °C | 15.0 °C | 1.3 °C | -19.6 °C | 12.5 °C | -1.0 °C | -21.5 °C | 31.6 mm | 1.4 mm | — | — |
Data Visualisations
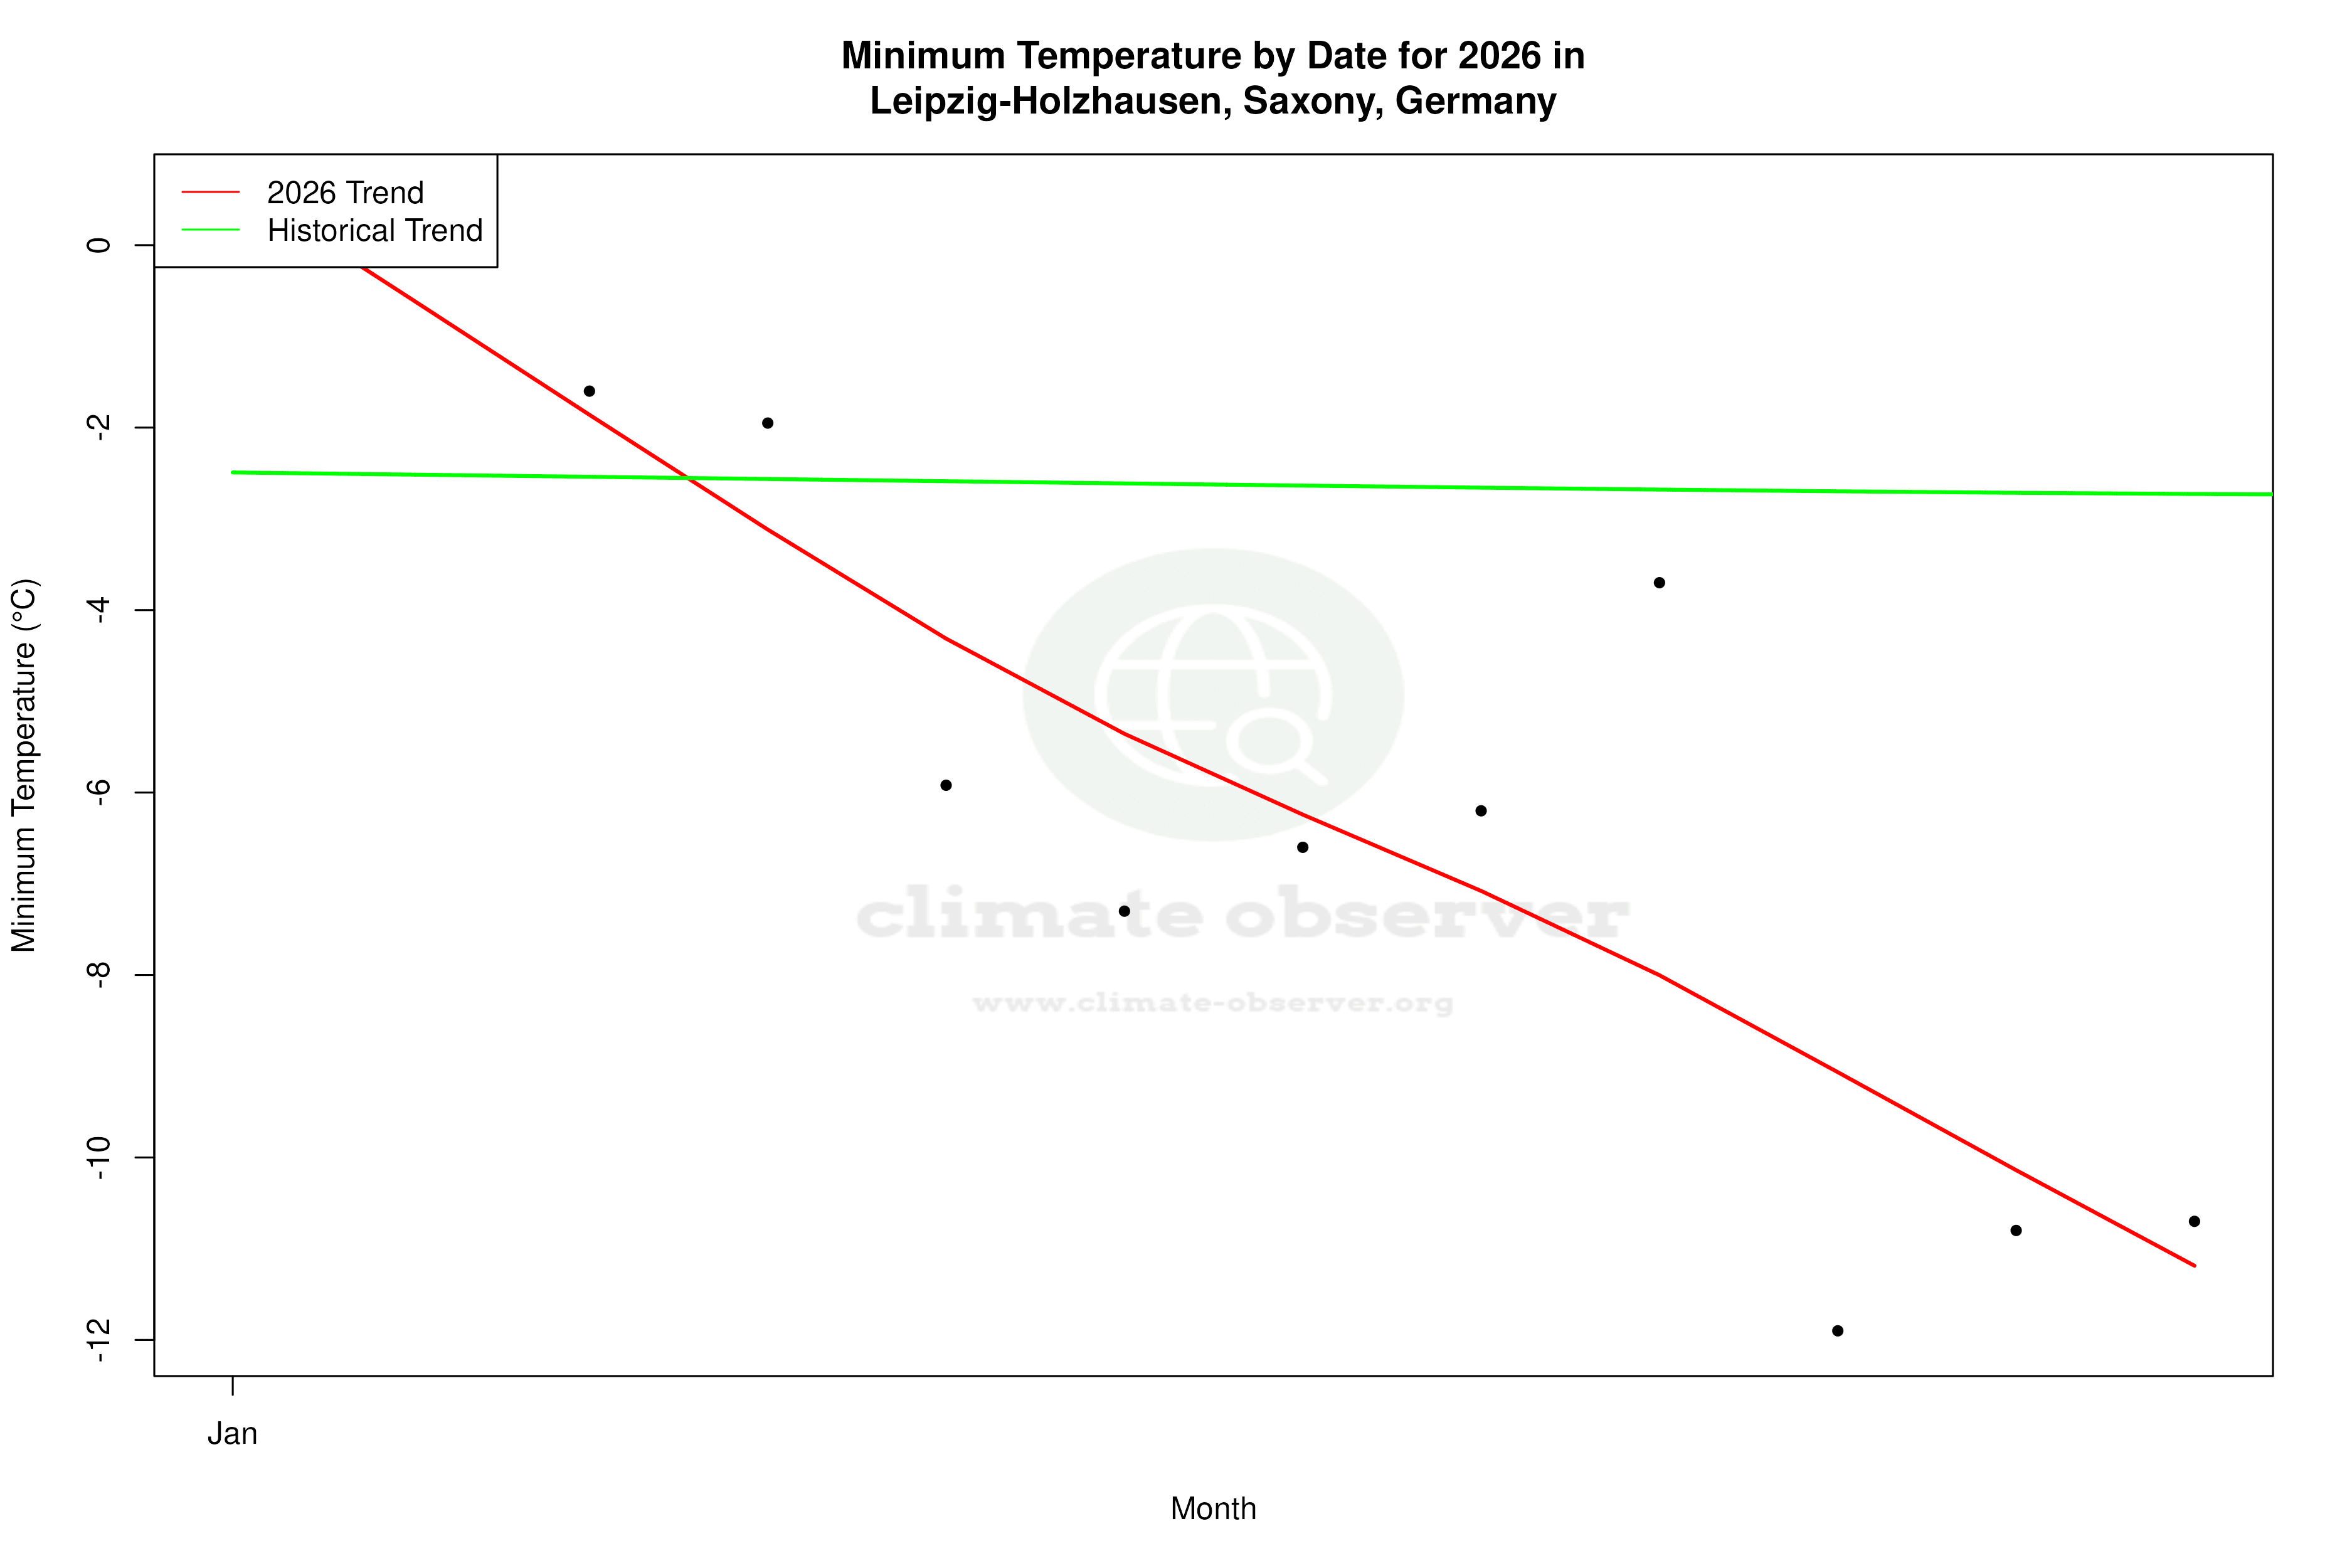
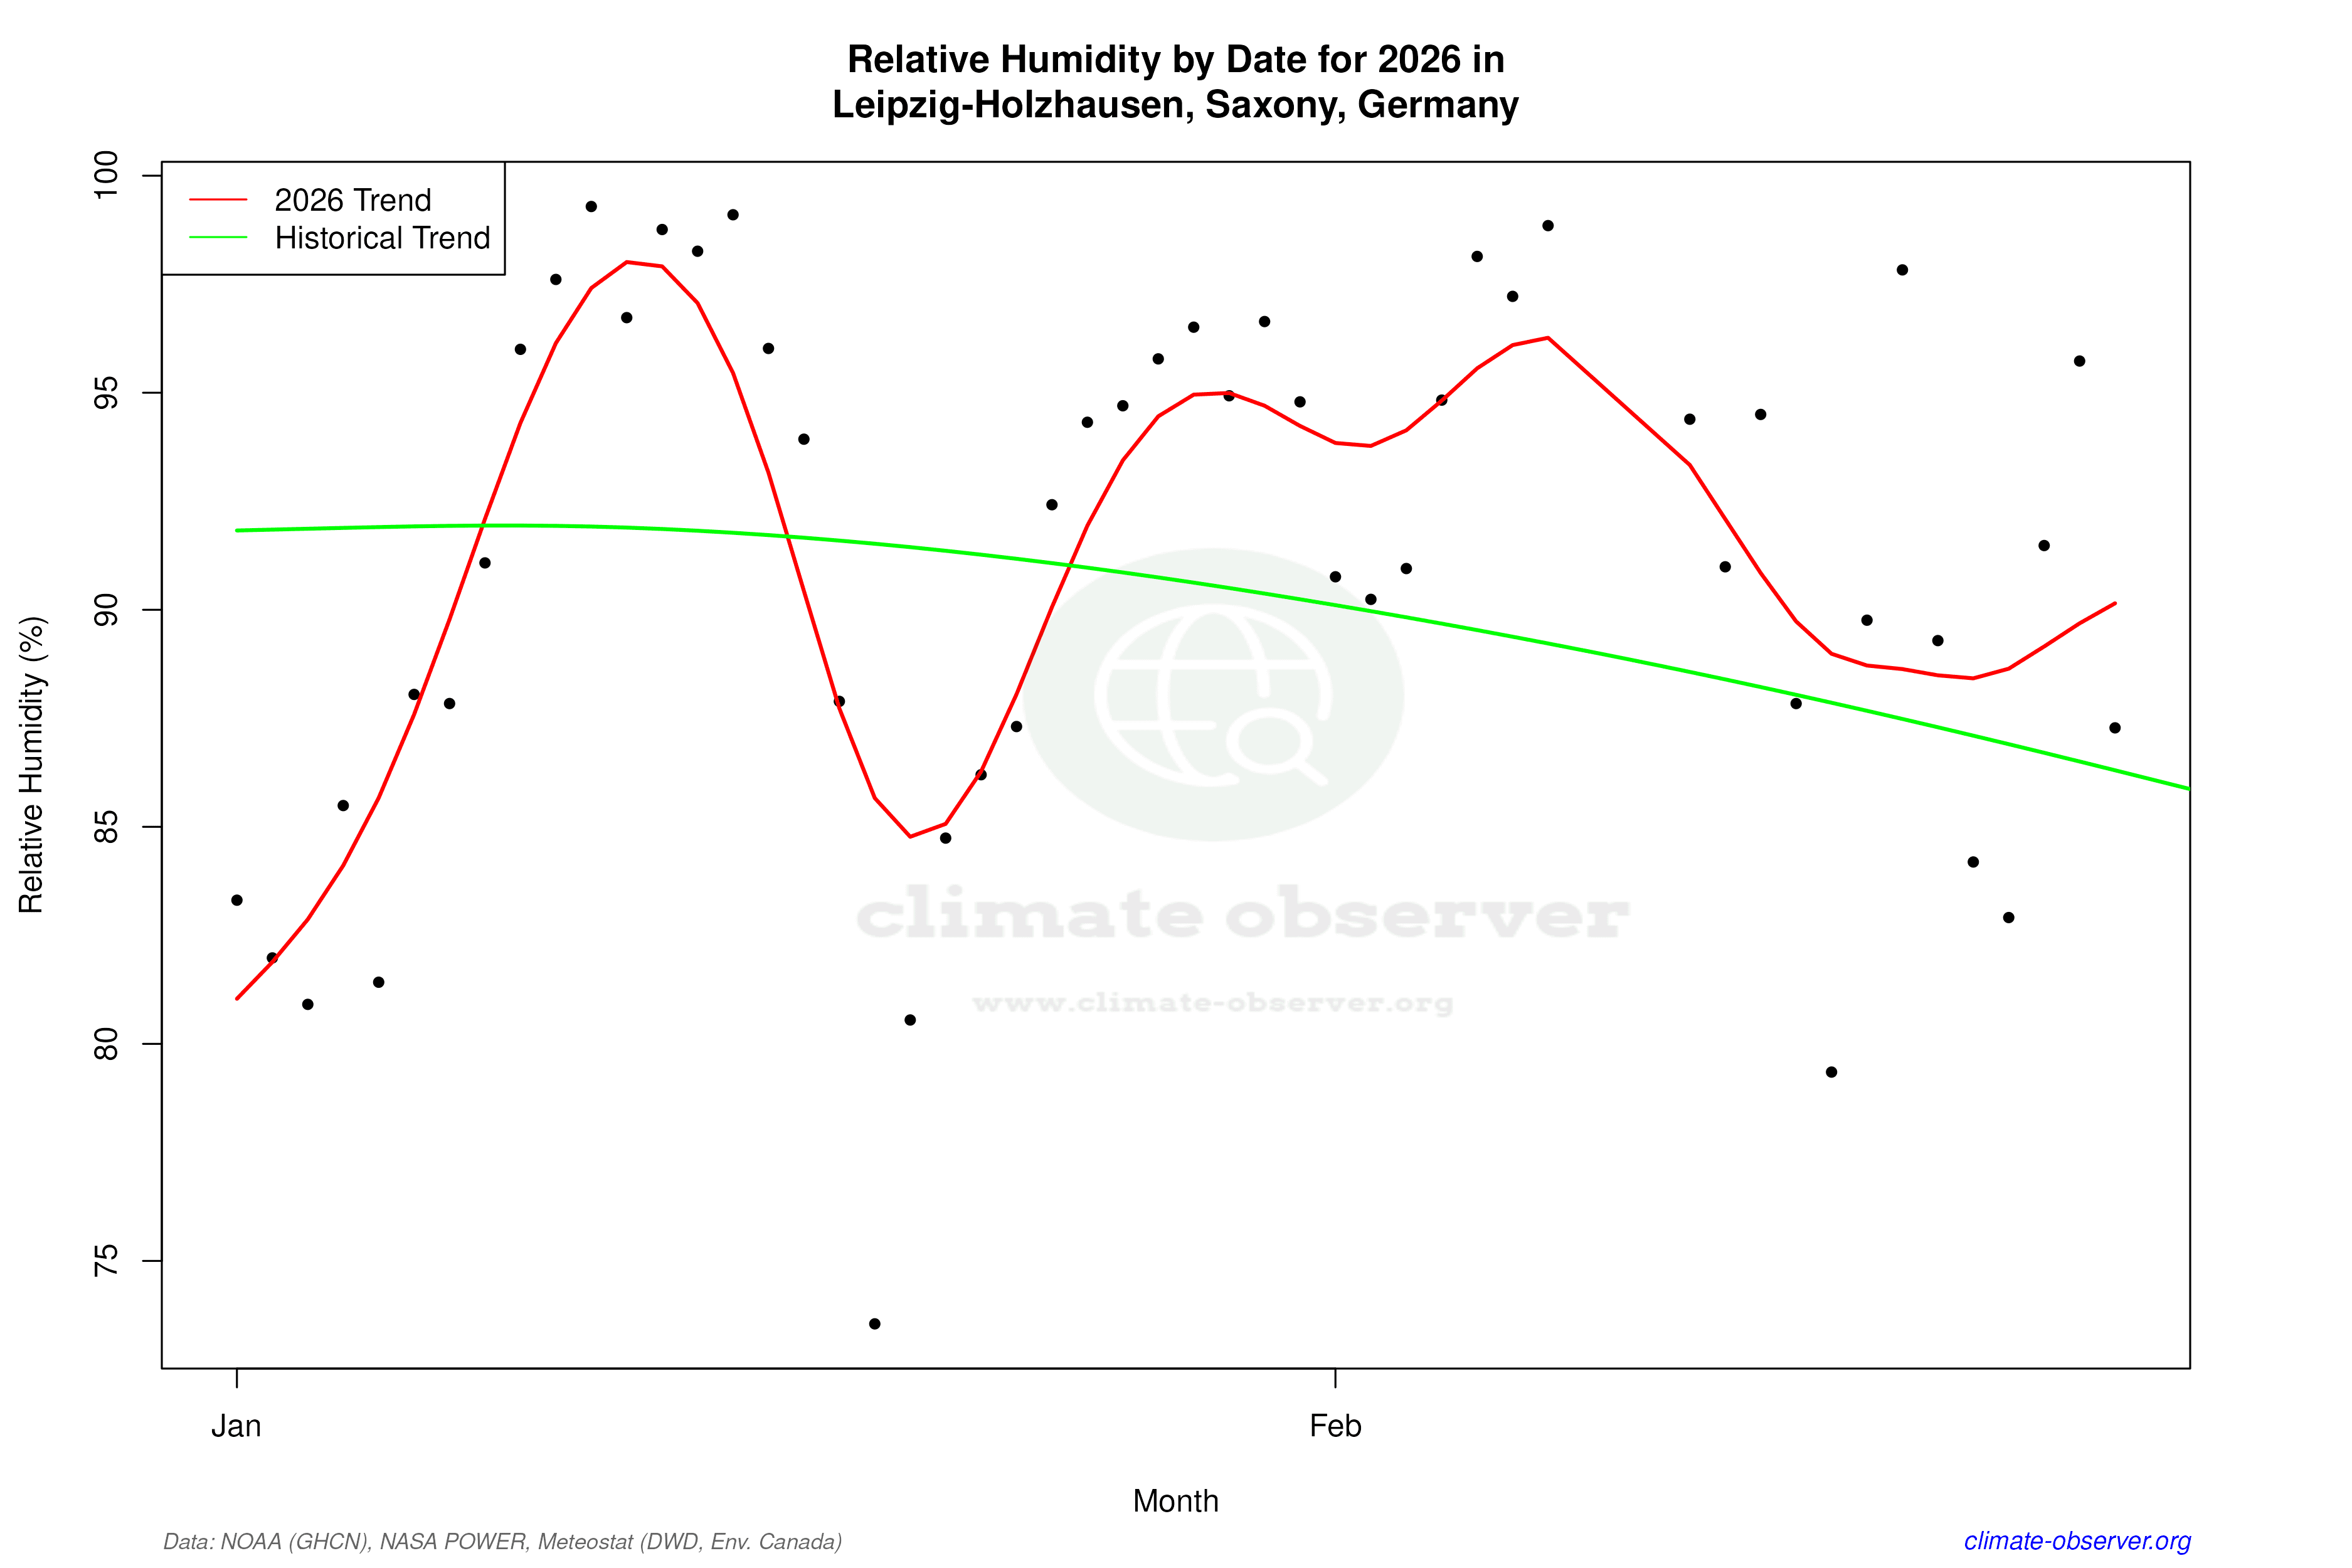
Remove WatermarksCurrent Year Climate Trends vs Historical
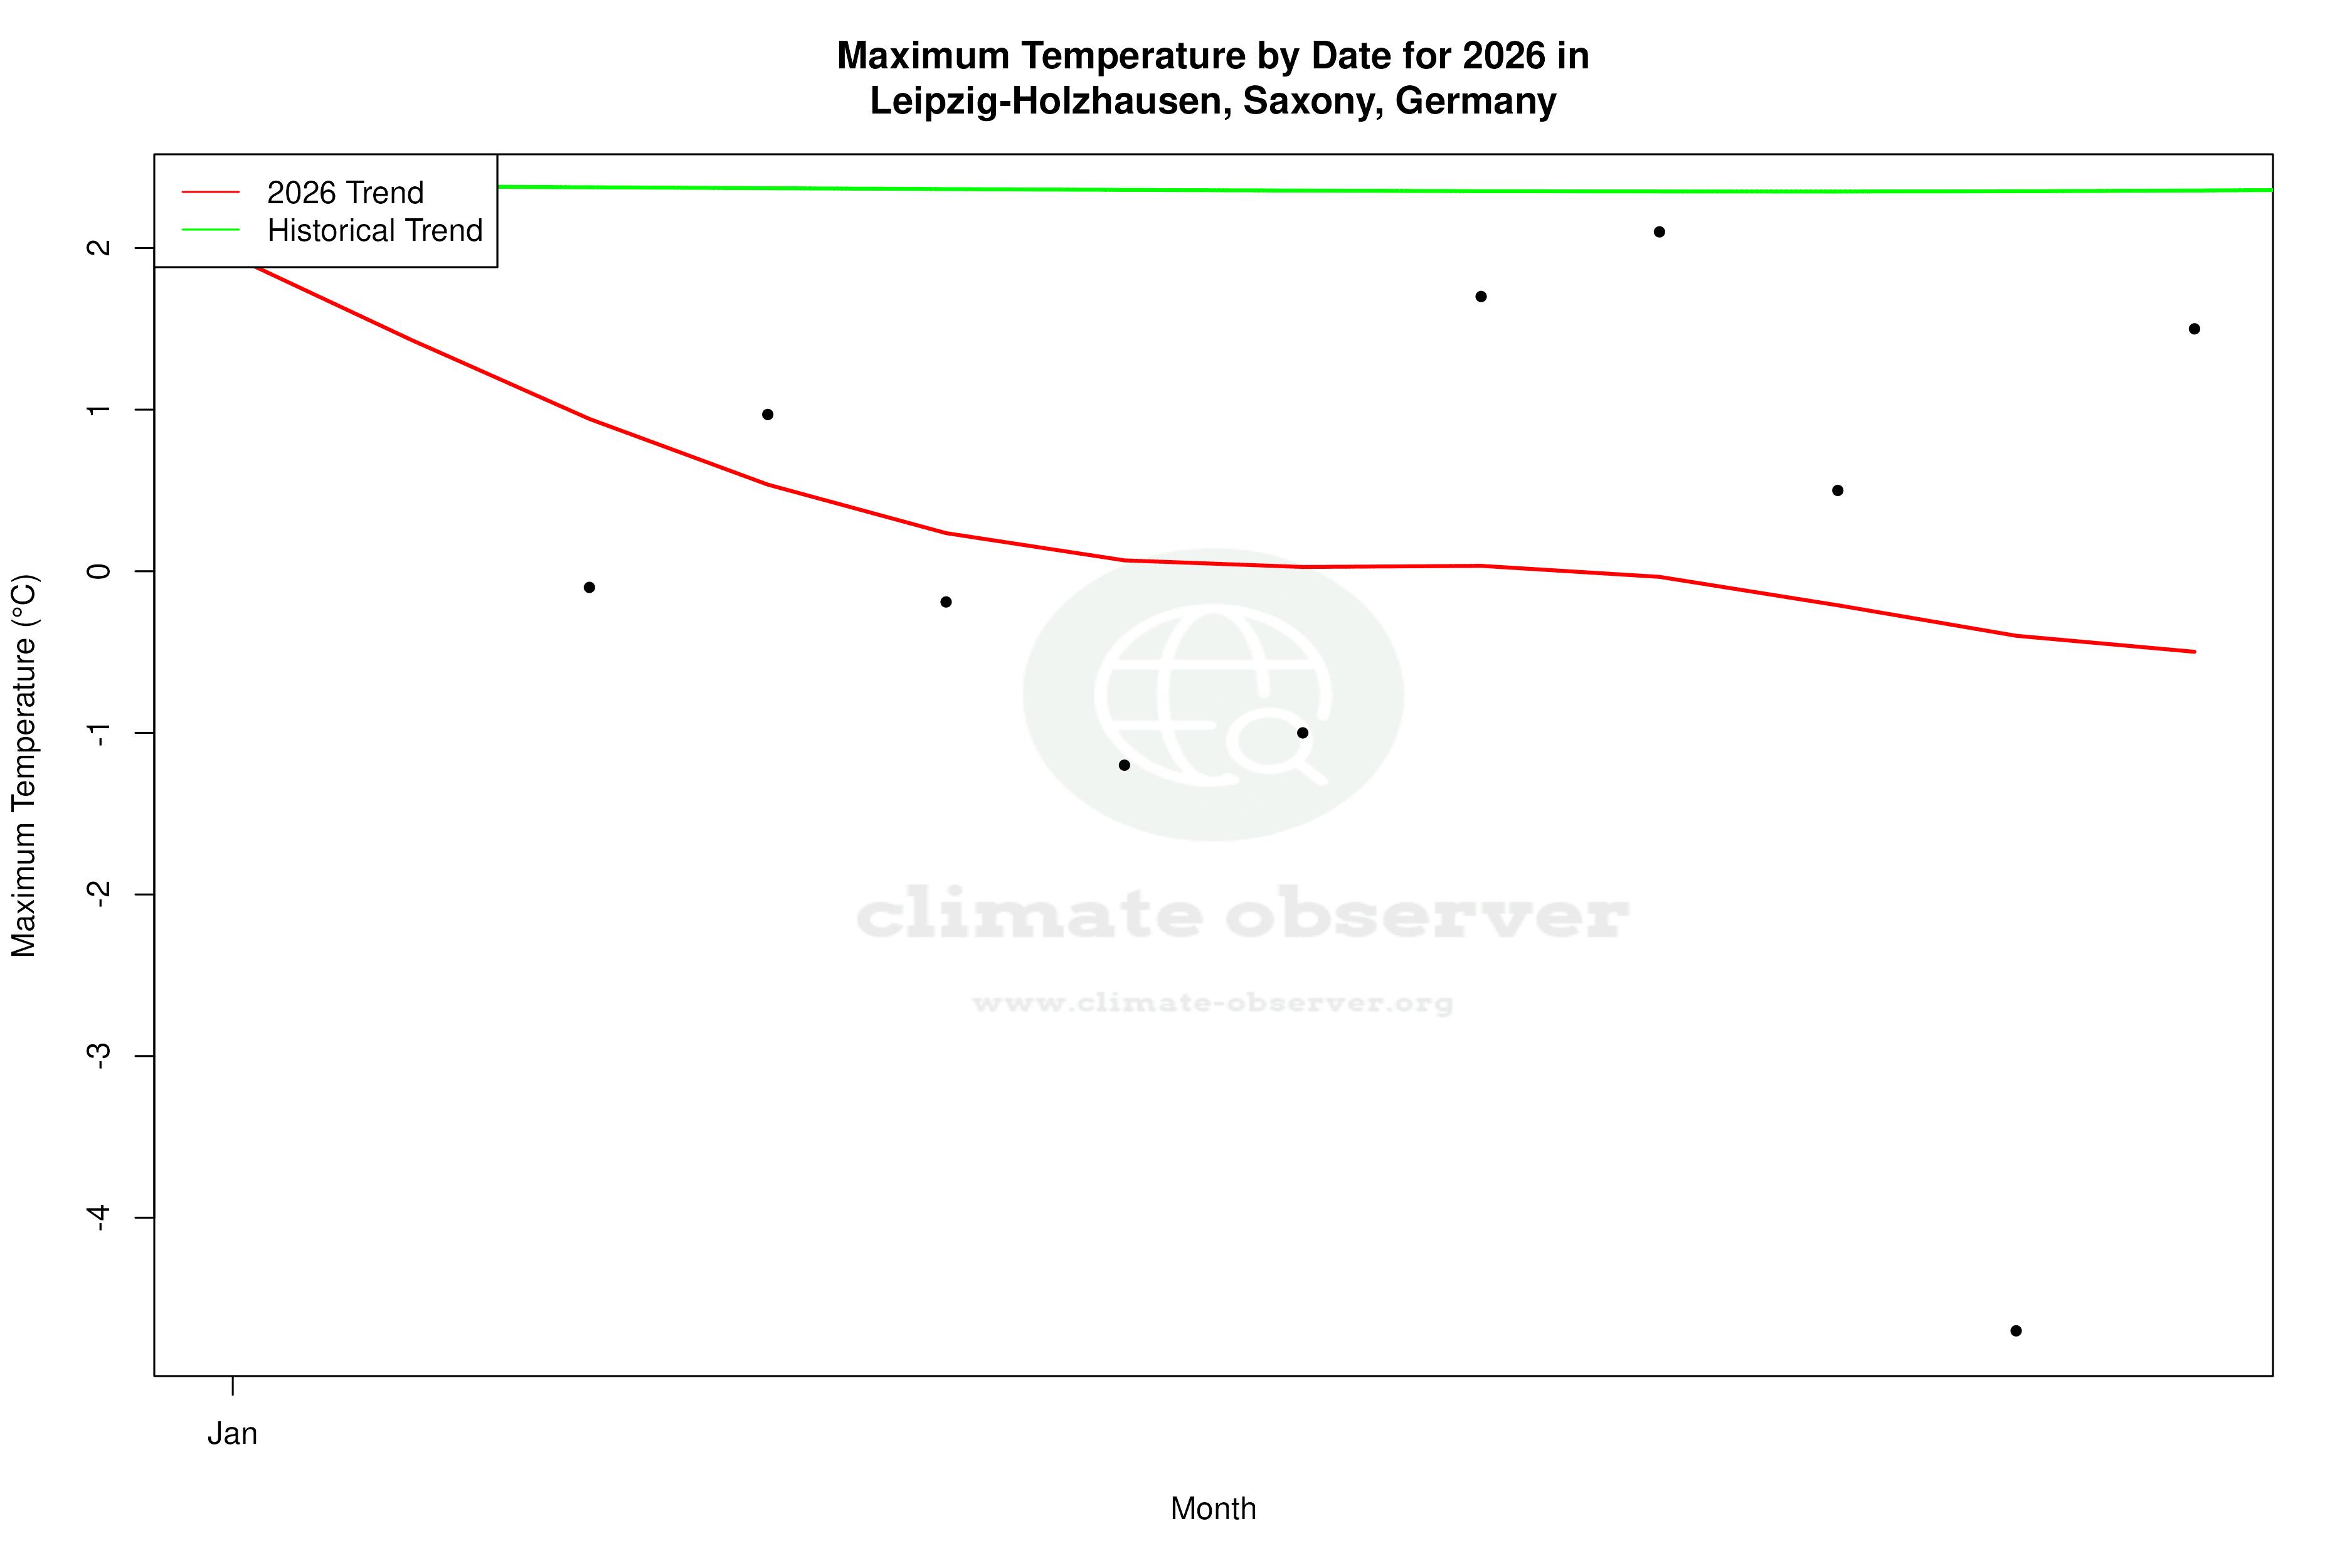


Max Temperature this Year | 1 of 6
Climate 12-Month Moving Averages
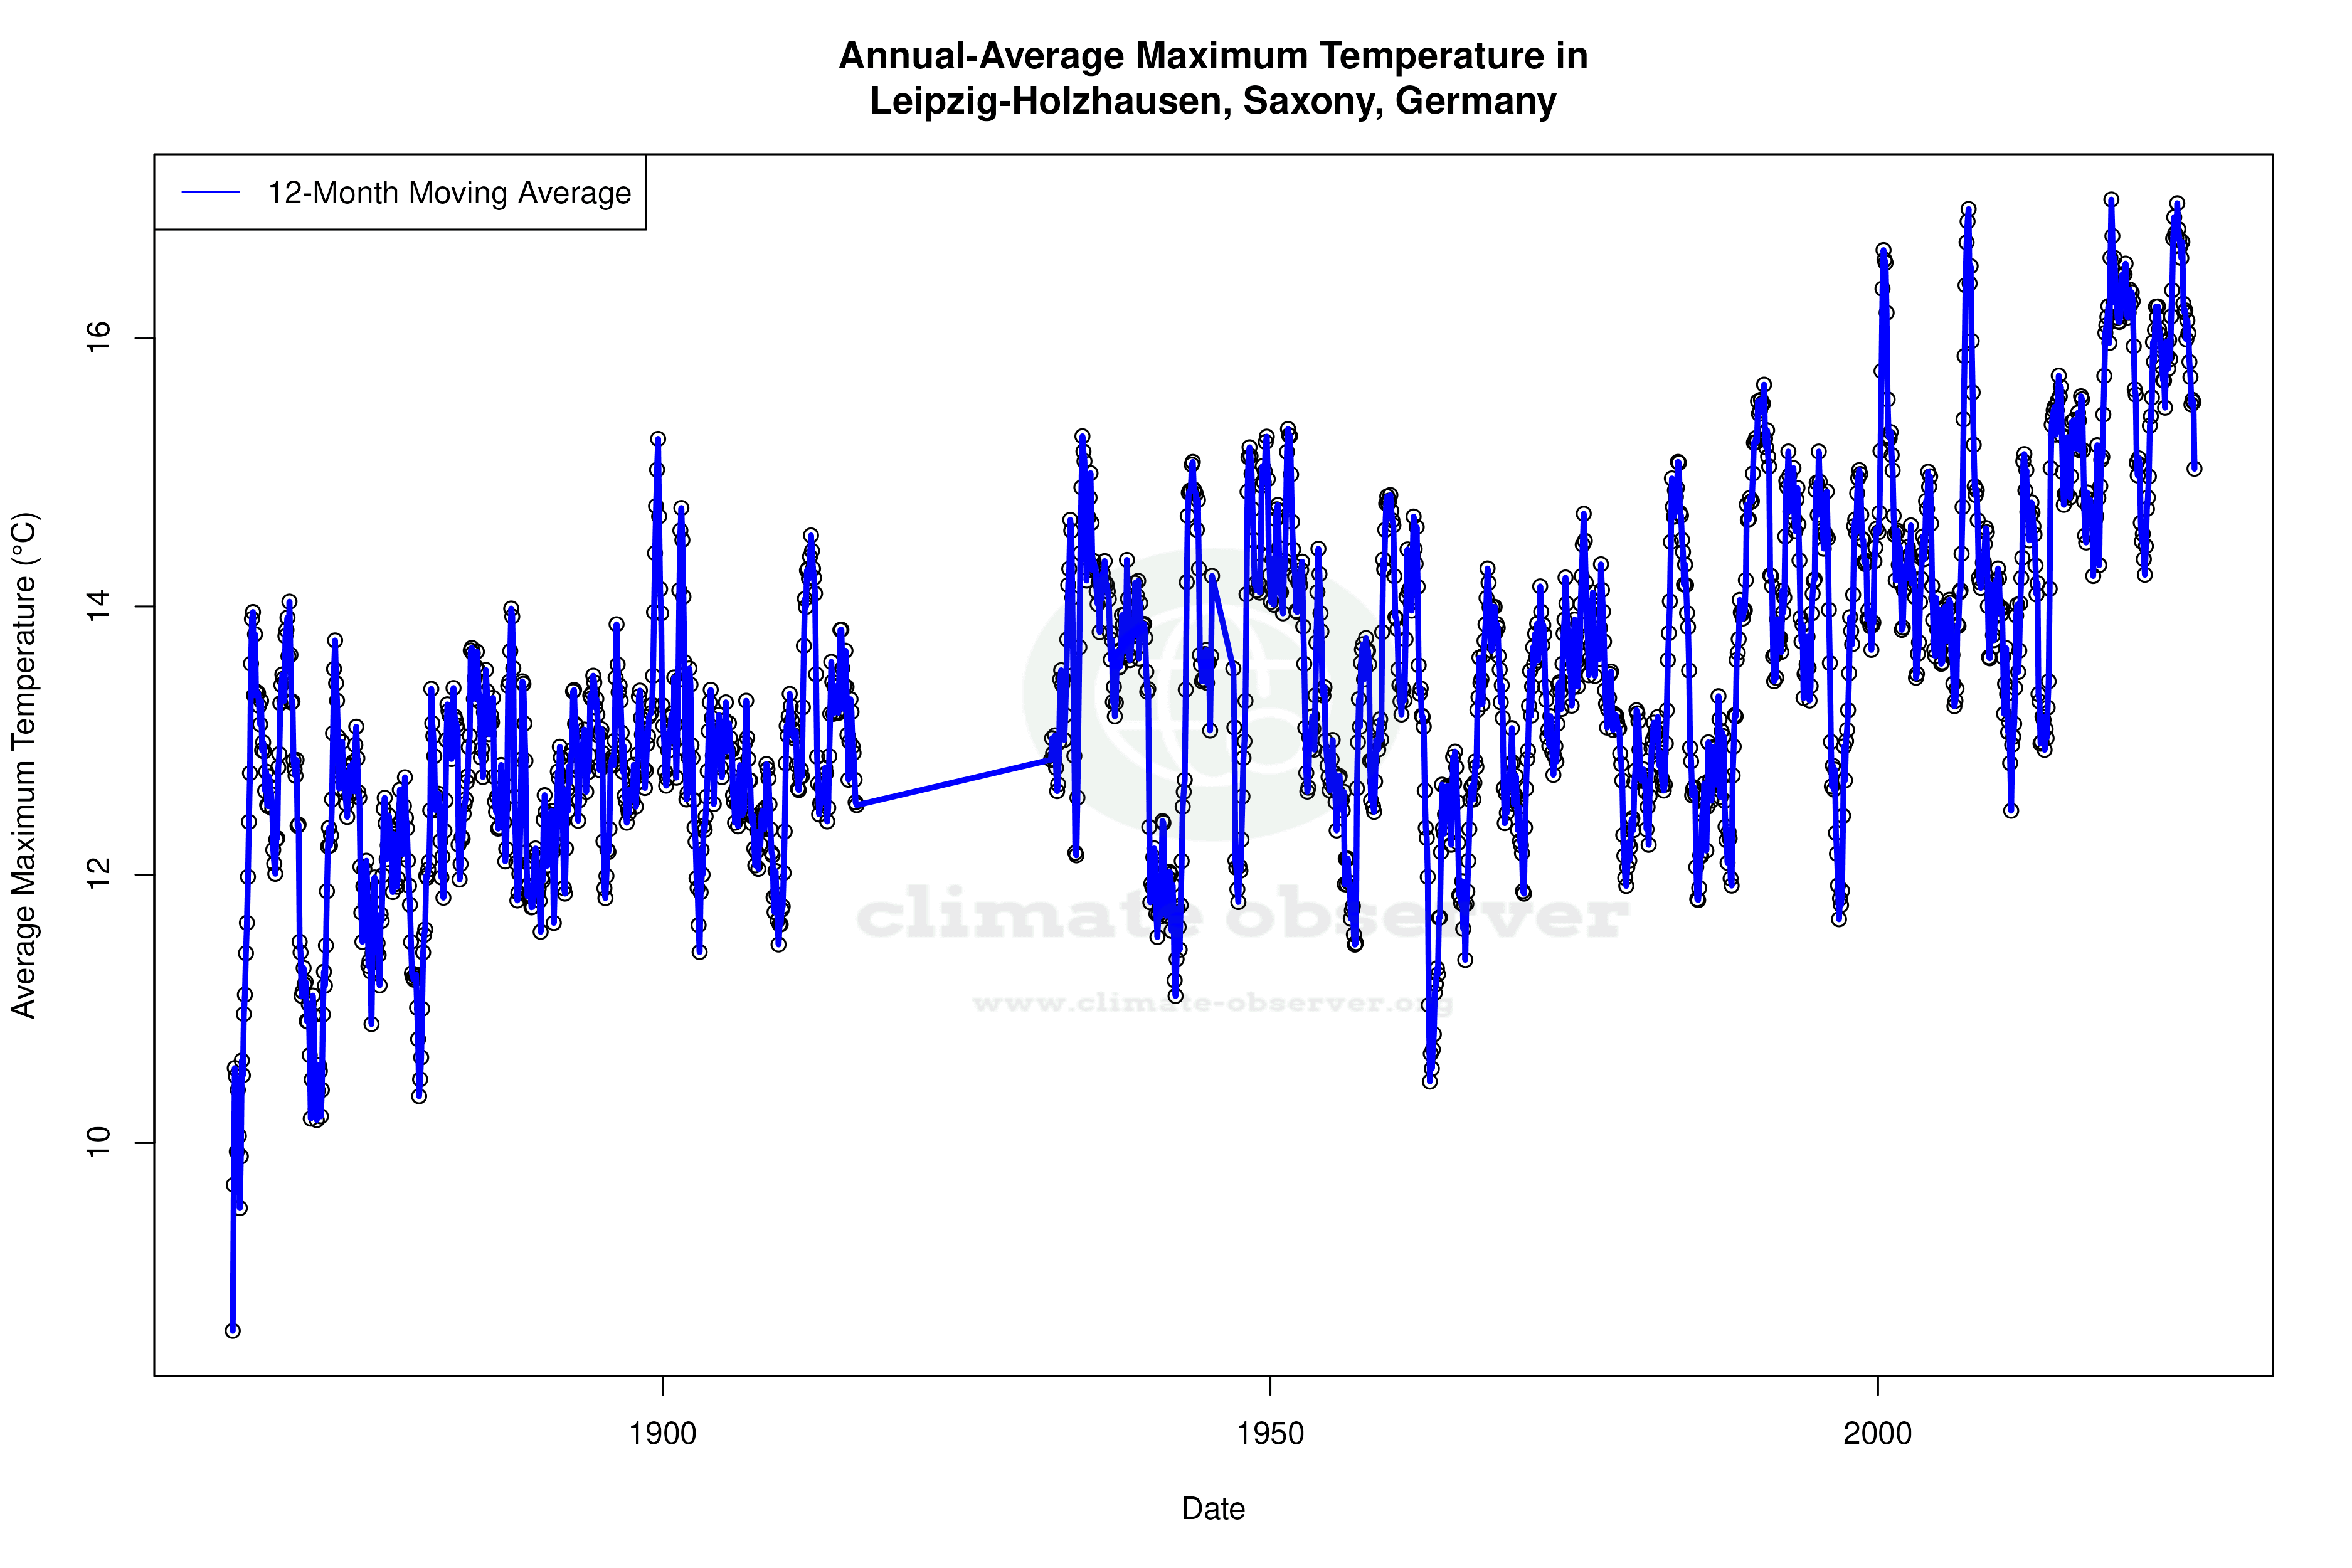
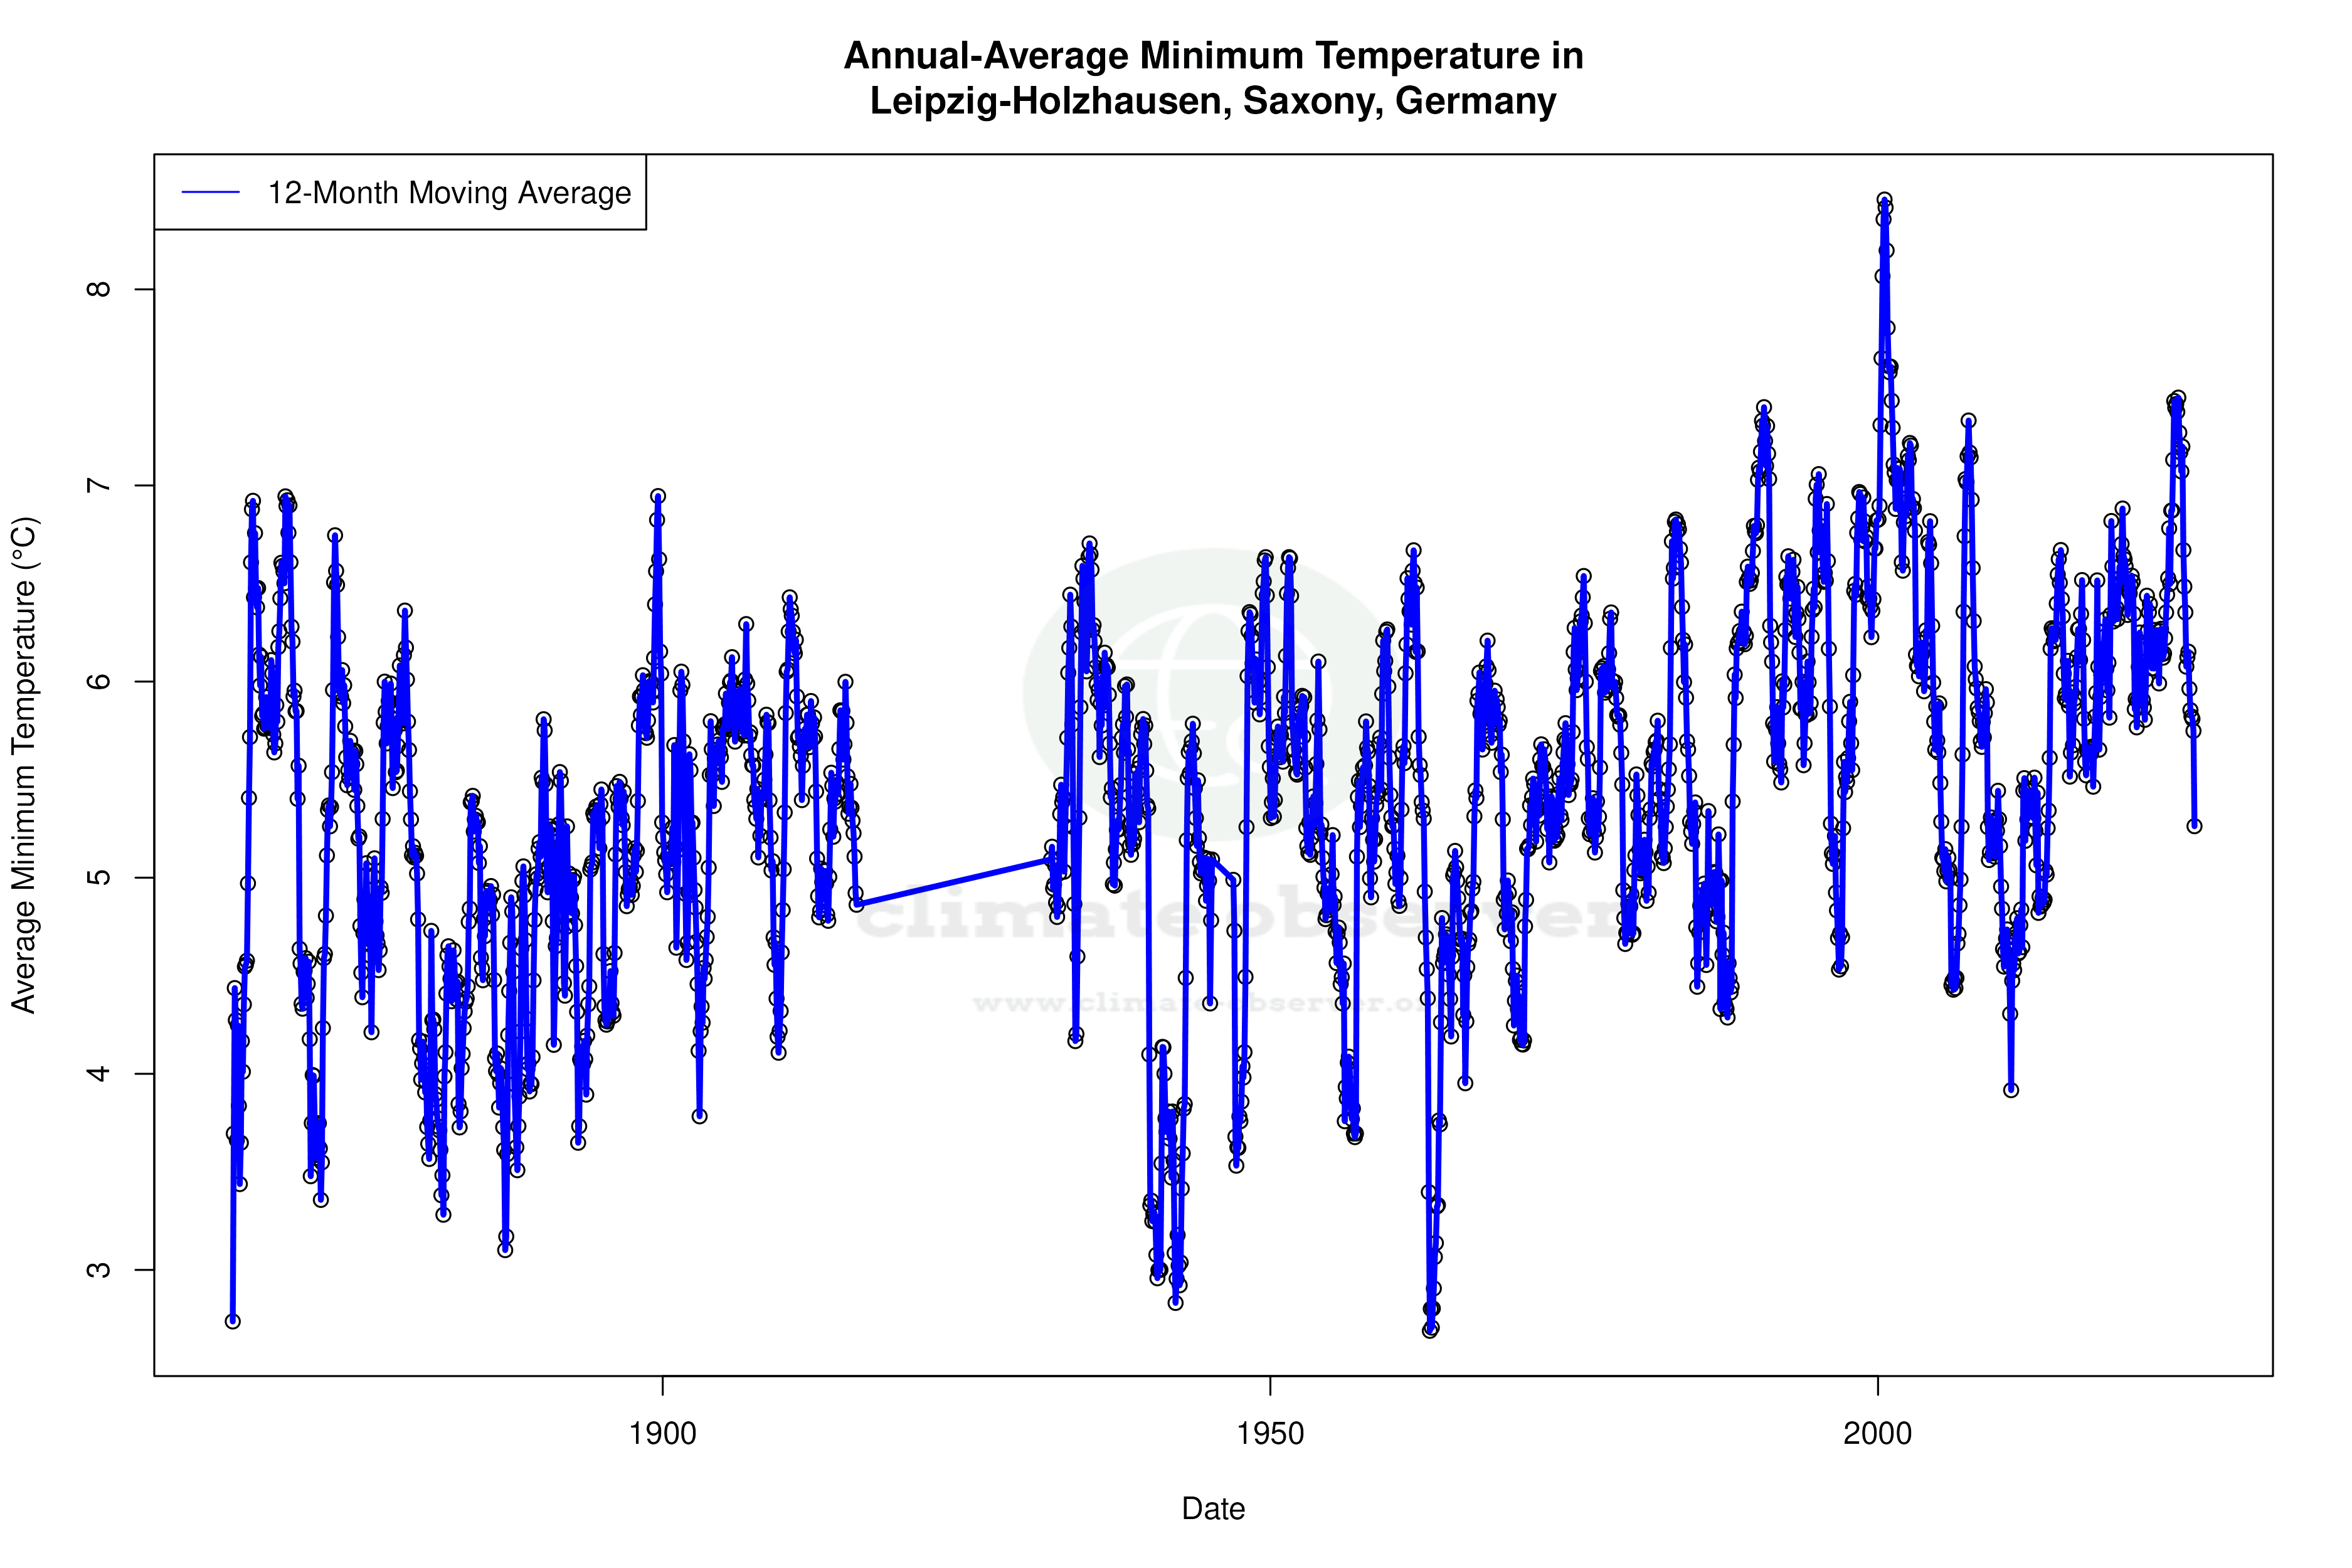


Max Temperature 12-Month MA | 1 of 6
Daily Data Points and Averages Throughout the Year


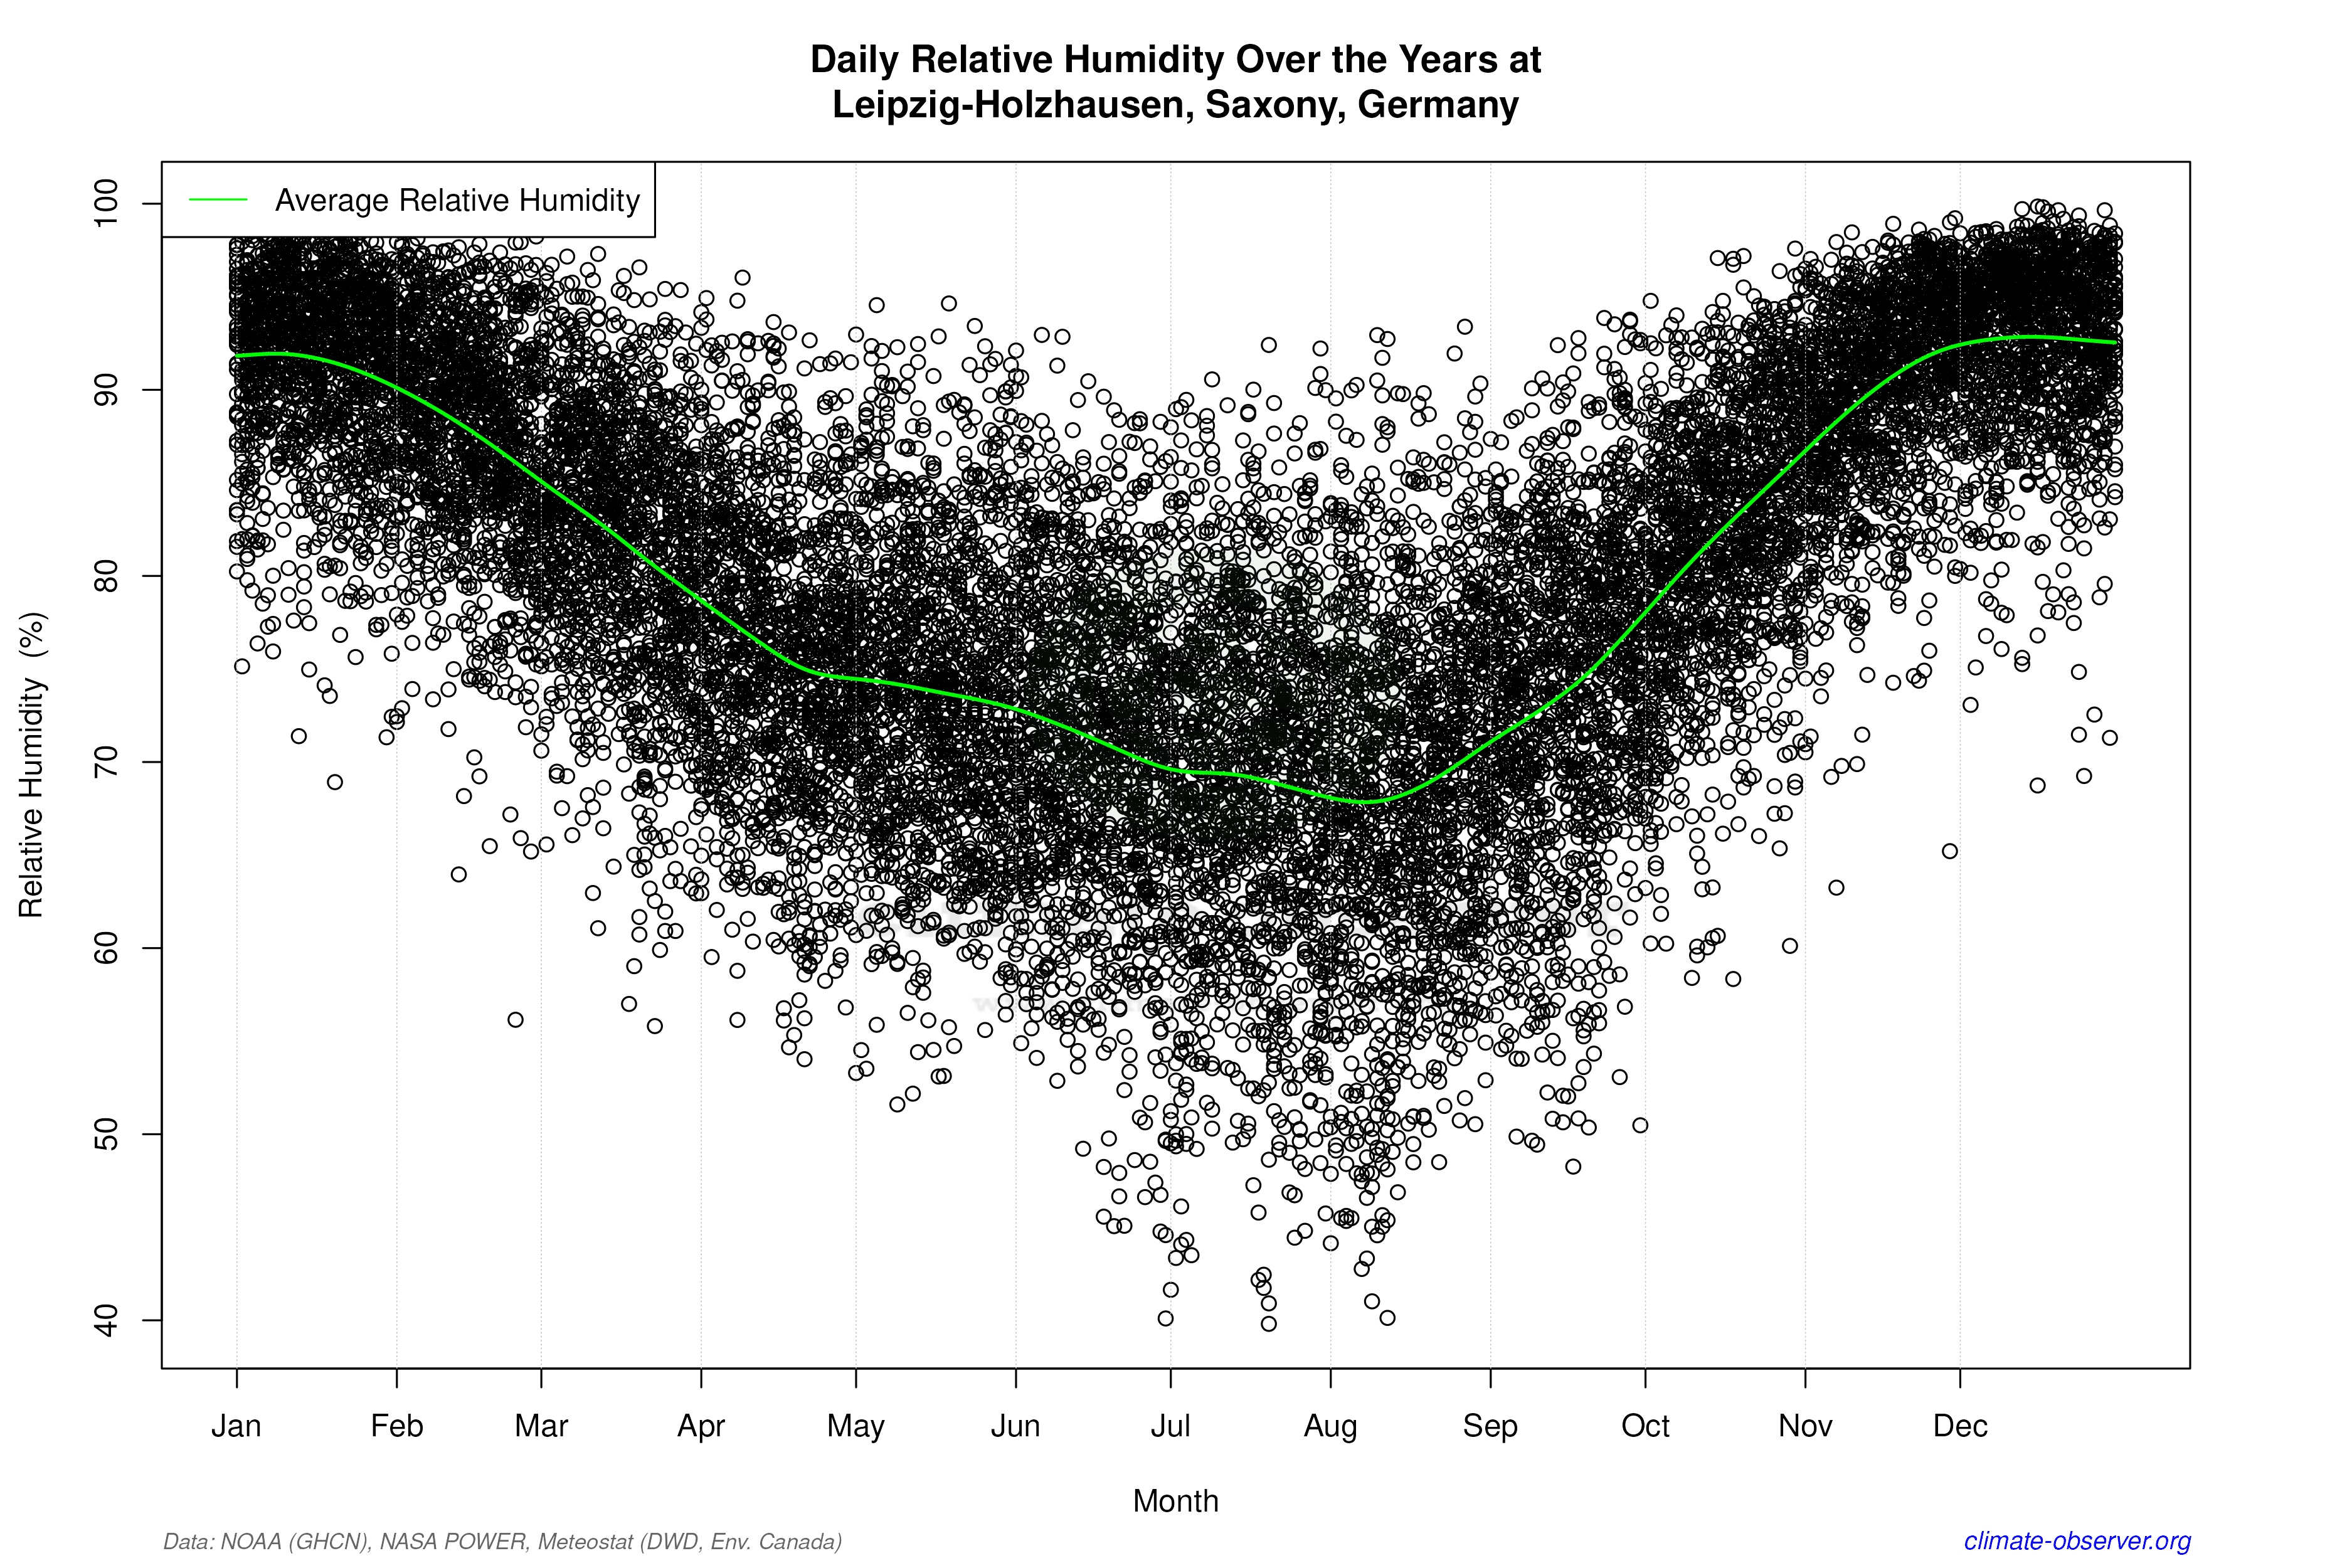

Average Max Temperature Throughout Year | 1 of 5
