Climate for Station: Braunschweig Wolfsburg, Lower Saxony, Germany
Loading live weather...
Climate Analysis & Overview
Braunschweig Wolfsburg is experiencing a warming trend, with both highs and lows rising over the past decade. The precipitation pattern has become more evenly distributed, reflecting a subtle shift in local climate dynamics. These changes align with Germany's broader climate goals of managing temperature increases and precipitation distribution.
Warming Trends in Braunschweig Wolfsburg
The climate station at Braunschweig Wolfsburg, located at 52.319°N, 10.556°E, is situated in a region characterised by a temperate oceanic climate (Cfb in the Köppen classification). This area is influenced by its proximity to the North Sea and the Harz Mountains, which moderate temperatures and precipitation. Over the past decade, the region has seen a warming trend, with average high temperatures increasing by 0.86°C (1.55°F) and lows by 0.47°C (0.84°F). This short-term trend is more pronounced than the all-time warming, where highs have risen by 0.41°C (0.74°F) and lows by 0.26°C (0.47°F). These figures suggest a consistent warming pattern, which could impact local ecosystems and agriculture.
Temperature Extremes and Records
Braunschweig Wolfsburg has experienced notable temperature extremes, with a record high of 38.3°C (100.9°F) and a record low of -25.0°C (-13.0°F). These records highlight the variability in the region's climate, which can be attributed to its geographical positioning and the influence of continental and maritime air masses. Such extremes are critical for understanding the potential impacts of climate change on infrastructure and human health.
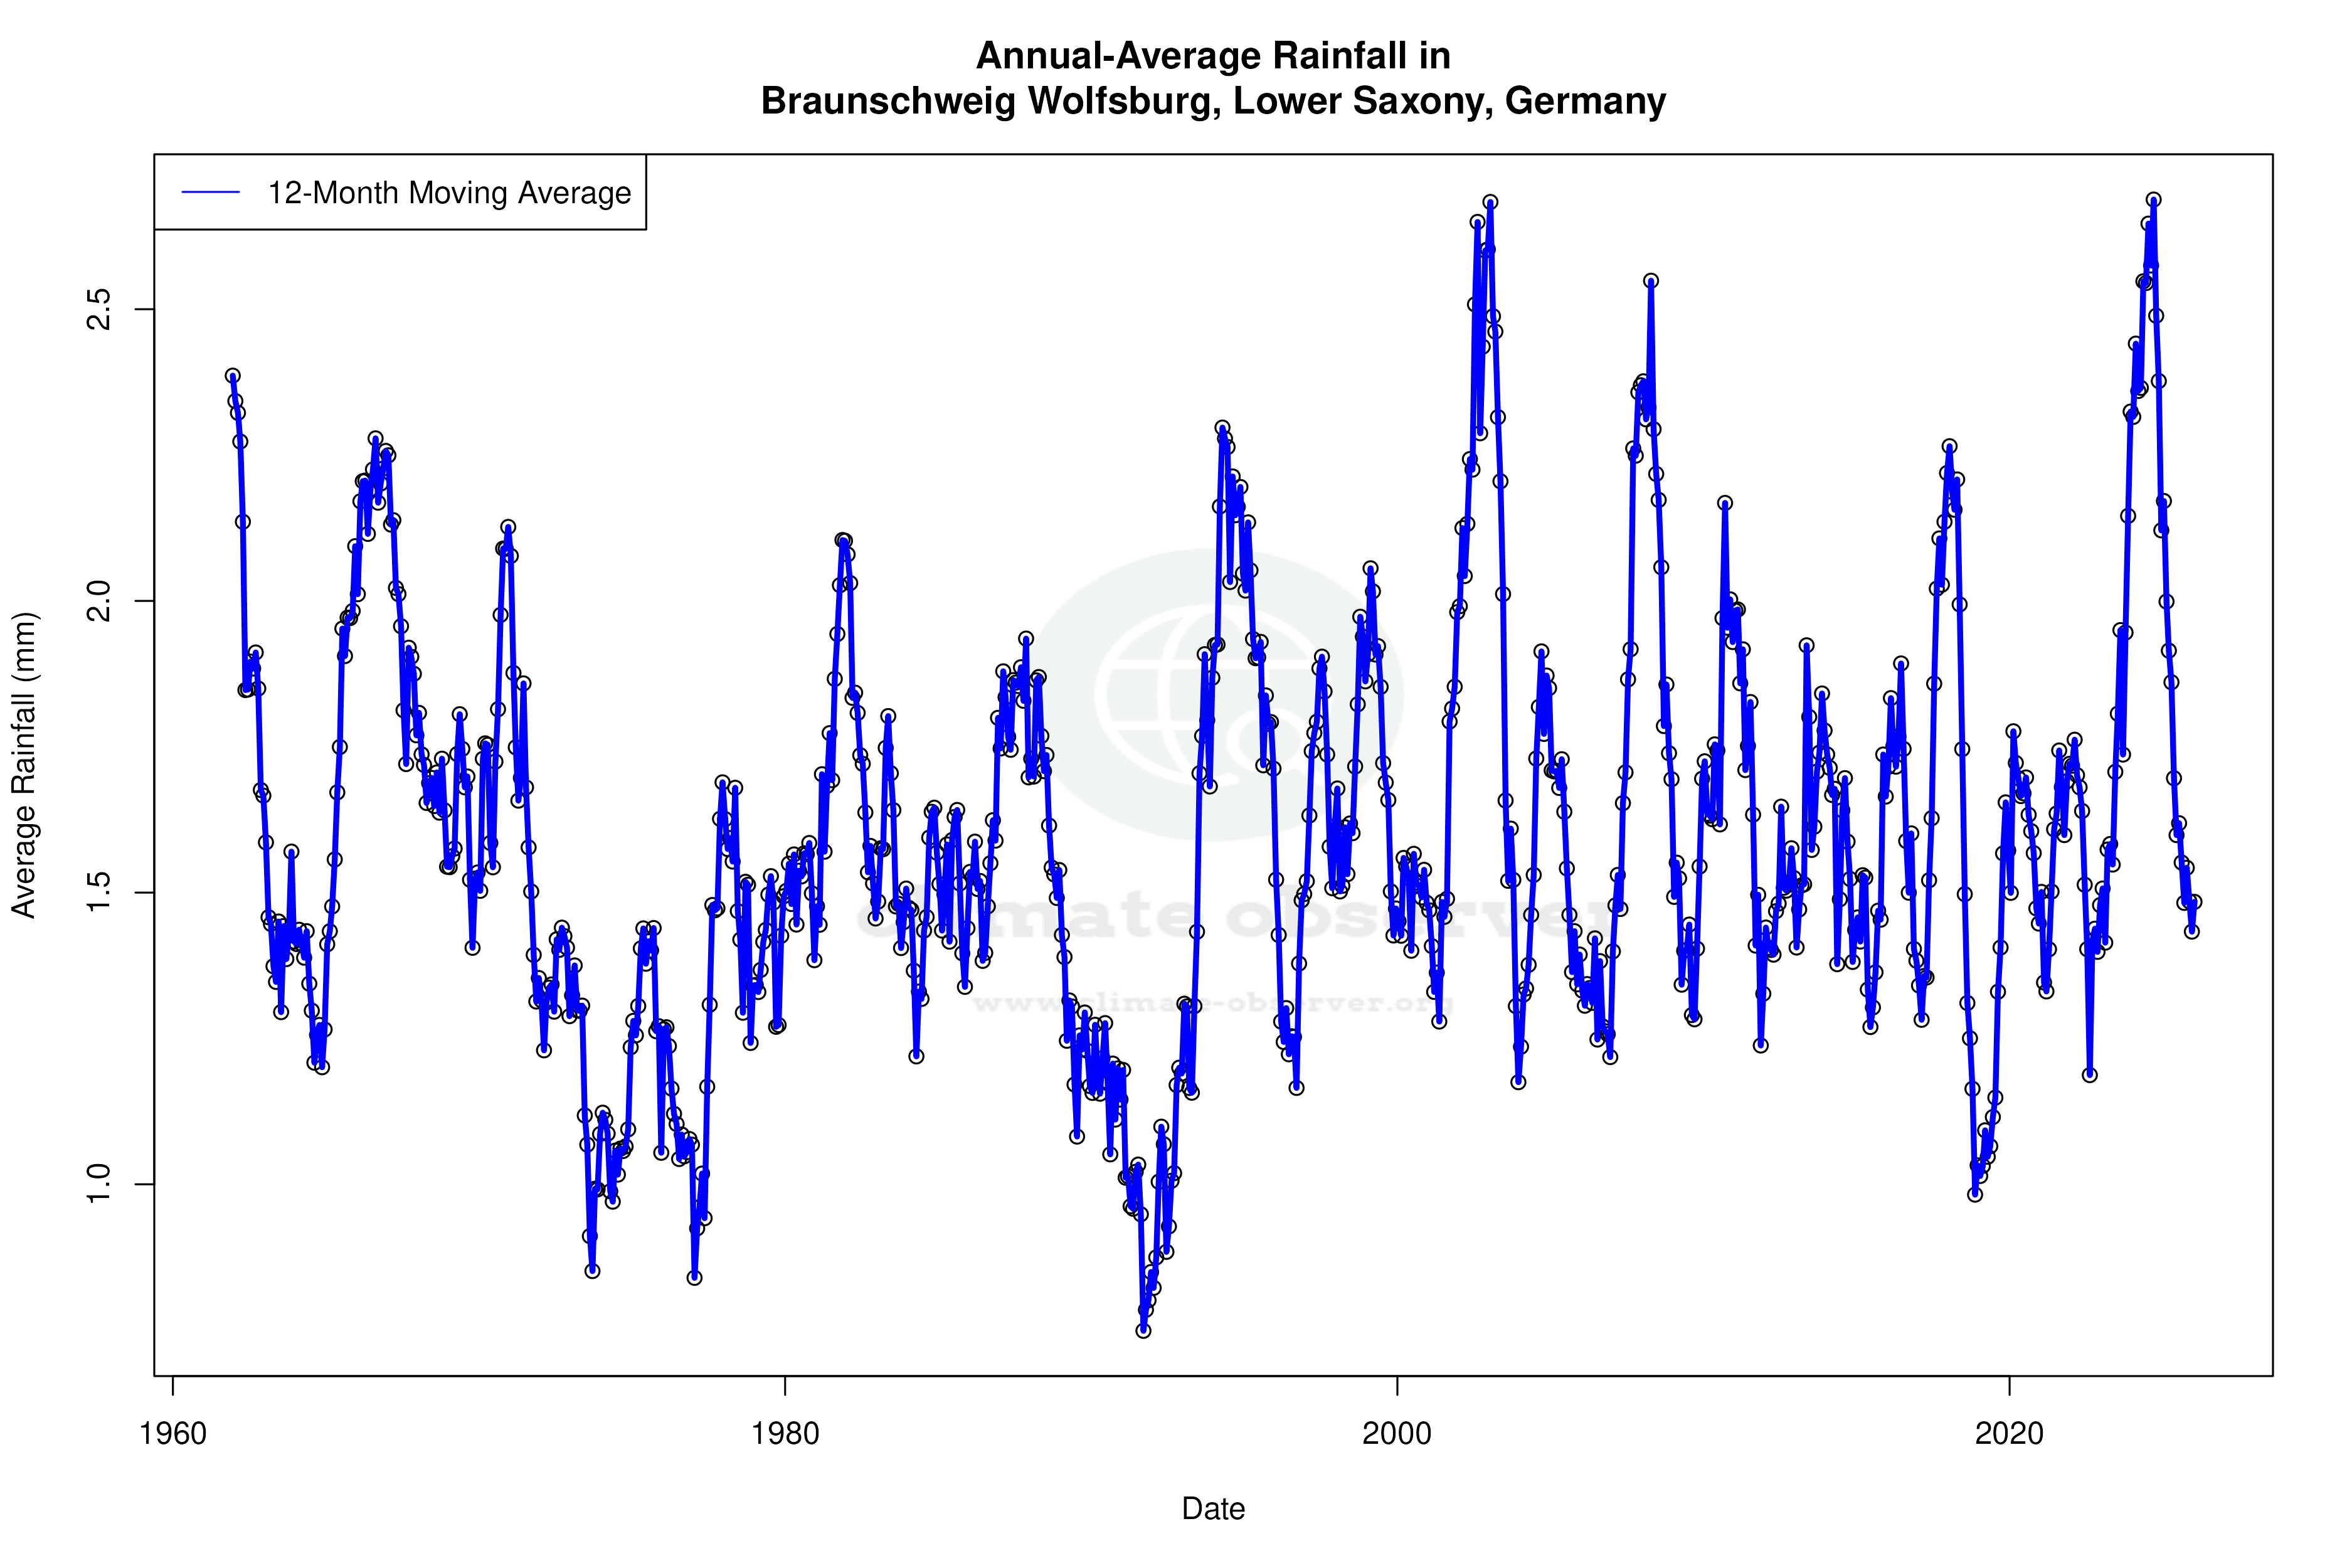
Precipitation Patterns and Distribution
The Precipitation Concentration Index (PCI) provides insights into how rainfall is distributed throughout the year. A decrease in PCI from a baseline of 10.85 to a current value of 9.65 indicates a more even distribution of precipitation events. This shift suggests that rainfall is becoming less concentrated in intense storms and more spread out over time, which could reduce the risk of flooding and soil erosion. This change aligns with Germany's climate adaptation strategies, which aim to mitigate the impacts of extreme weather events.
Regional Climate Context and Implications
The observed climatic changes at Braunschweig Wolfsburg are part of a broader regional trend in Germany, where efforts are underway to address rising temperatures and adapt to shifting precipitation patterns. These changes are crucial for planning future infrastructure and agricultural practices. The warming trend, coupled with a more even distribution of rainfall, may offer opportunities for extending the growing season and improving water management strategies. However, it also necessitates vigilance in monitoring potential adverse effects on biodiversity and water resources.
Station Statistics
10-Year Trend
High: +0.62 °C/decade
Low: +0.29 °C/decade
Rain: +0.40 mm/decade
25-Year Trend
High: +0.78 °C/decade
Low: +0.39 °C/decade
Rain: -0.04 mm/decade
50-Year Trend
High: +0.60 °C/decade
Low: +0.34 °C/decade
Rain: +0.06 mm/decade
All-Time Trend
High: +0.41 °C/decade
Low: +0.25 °C/decade
Rain: +0.03 mm/decade
Percentage Above-Average Days
Last 12 Months: 58.9%
This Year: 59.9%
Precipitation Concentration Index (PCI) ℹ️
Last 12 Months: 10.5
Historical Average: 11.1
Percentile Rank of Last 12 Months ℹ️
High: 89th percentile
Low: 71st percentile
Rain: 51st percentile
Change in Variance ℹ️
High: -1.9%
Low: -13.9%
Intraday: +16.1%
Data Coverage
83.7%
First Year of Data
1936
Station Location
Historical Weather Records
| Max High | Avg High | Min High | Max Avg | Avg Avg | Min Avg | Max Low | Avg Low | Min Low | Max Precipitation | Avg Precipitation | Max Snow | Avg Snow | |
|---|---|---|---|---|---|---|---|---|---|---|---|---|---|
| Record | 38.3 °C | — | -17.3 °C | 33.8 °C | — | -20.1 °C | 23.5 °C | — | -25.0 °C | 51.9 mm | — | — | — |
| January | 21.1 °C | 3.2 °C | -16.6 °C | 12.8 °C | 0.9 °C | -19.4 °C | 10.5 °C | -1.5 °C | -25.0 °C | 30.1 mm | 1.5 mm | — | — |
| February | 19.4 °C | 4.4 °C | -17.3 °C | 14.4 °C | 1.5 °C | -20.1 °C | 11.2 °C | -1.4 °C | -24.8 °C | 29.2 mm | 1.3 mm | — | — |
| March | 24.4 °C | 8.4 °C | -6.2 °C | 18.2 °C | 4.8 °C | -10.0 °C | 11.4 °C | 1.0 °C | -15.3 °C | 27.6 mm | 1.3 mm | — | — |
| April | 29.8 °C | 13.3 °C | 0.7 °C | 22.6 °C | 8.9 °C | -1.6 °C | 15.8 °C | 3.9 °C | -10.3 °C | 34.2 mm | 1.4 mm | — | — |
| May | 31.9 °C | 17.9 °C | 4.0 °C | 27.0 °C | 13.3 °C | 1.8 °C | 18.2 °C | 7.9 °C | -2.8 °C | 37.7 mm | 1.7 mm | — | — |
| June | 35.8 °C | 21.2 °C | 8.9 °C | 32.4 °C | 16.7 °C | 7.0 °C | 23.5 °C | 11.2 °C | 0.0 °C | 51.9 mm | 2.1 mm | — | — |
| July | 38.3 °C | 22.9 °C | 10.7 °C | 32.3 °C | 18.2 °C | 9.7 °C | 22.6 °C | 13.0 °C | 1.0 °C | 49.4 mm | 2.0 mm | — | — |
| August | 38.2 °C | 22.9 °C | 11.3 °C | 33.8 °C | 18.0 °C | 9.2 °C | 22.1 °C | 12.9 °C | 4.6 °C | 41.8 mm | 2.0 mm | — | — |
| September | 32.6 °C | 18.9 °C | 8.9 °C | 26.7 °C | 14.5 °C | 5.9 °C | 17.9 °C | 10.0 °C | -4.5 °C | 31.7 mm | 1.6 mm | — | — |
| October | 27.6 °C | 13.8 °C | 1.5 °C | 22.3 °C | 10.0 °C | -1.4 °C | 17.2 °C | 6.4 °C | -8.0 °C | 29.1 mm | 1.5 mm | — | — |
| November | 21.5 °C | 7.8 °C | -5.8 °C | 17.8 °C | 5.4 °C | -9.5 °C | 15.9 °C | 2.7 °C | -15.5 °C | 31.1 mm | 1.6 mm | — | — |
| December | 17.6 °C | 4.5 °C | -13.9 °C | 14.3 °C | 2.3 °C | -16.5 °C | 12.4 °C | -0.1 °C | -20.9 °C | 25.5 mm | 1.6 mm | — | — |
Data Visualisations
Remove WatermarksCurrent Year Climate Trends vs Historical


Max Temperature this Year | 1 of 6
Climate 12-Month Moving Averages


Max Temperature 12-Month MA | 1 of 6
Daily Data Points and Averages Throughout the Year


Average Max Temperature Throughout Year | 1 of 5
