Climate for Station: Andersen Afb Guam, Guam, Guam [United States]
Loading live weather...
Climate Analysis & Overview
Andersen AFB in Guam is experiencing a warming trend, with temperatures rising more significantly over the past decade compared to the all-time record. The precipitation pattern has become more evenly distributed, suggesting a shift in local climatic conditions. This aligns with broader regional climate goals aimed at understanding and adapting to changing weather patterns in the Pacific region.
Tropical Climate Dynamics
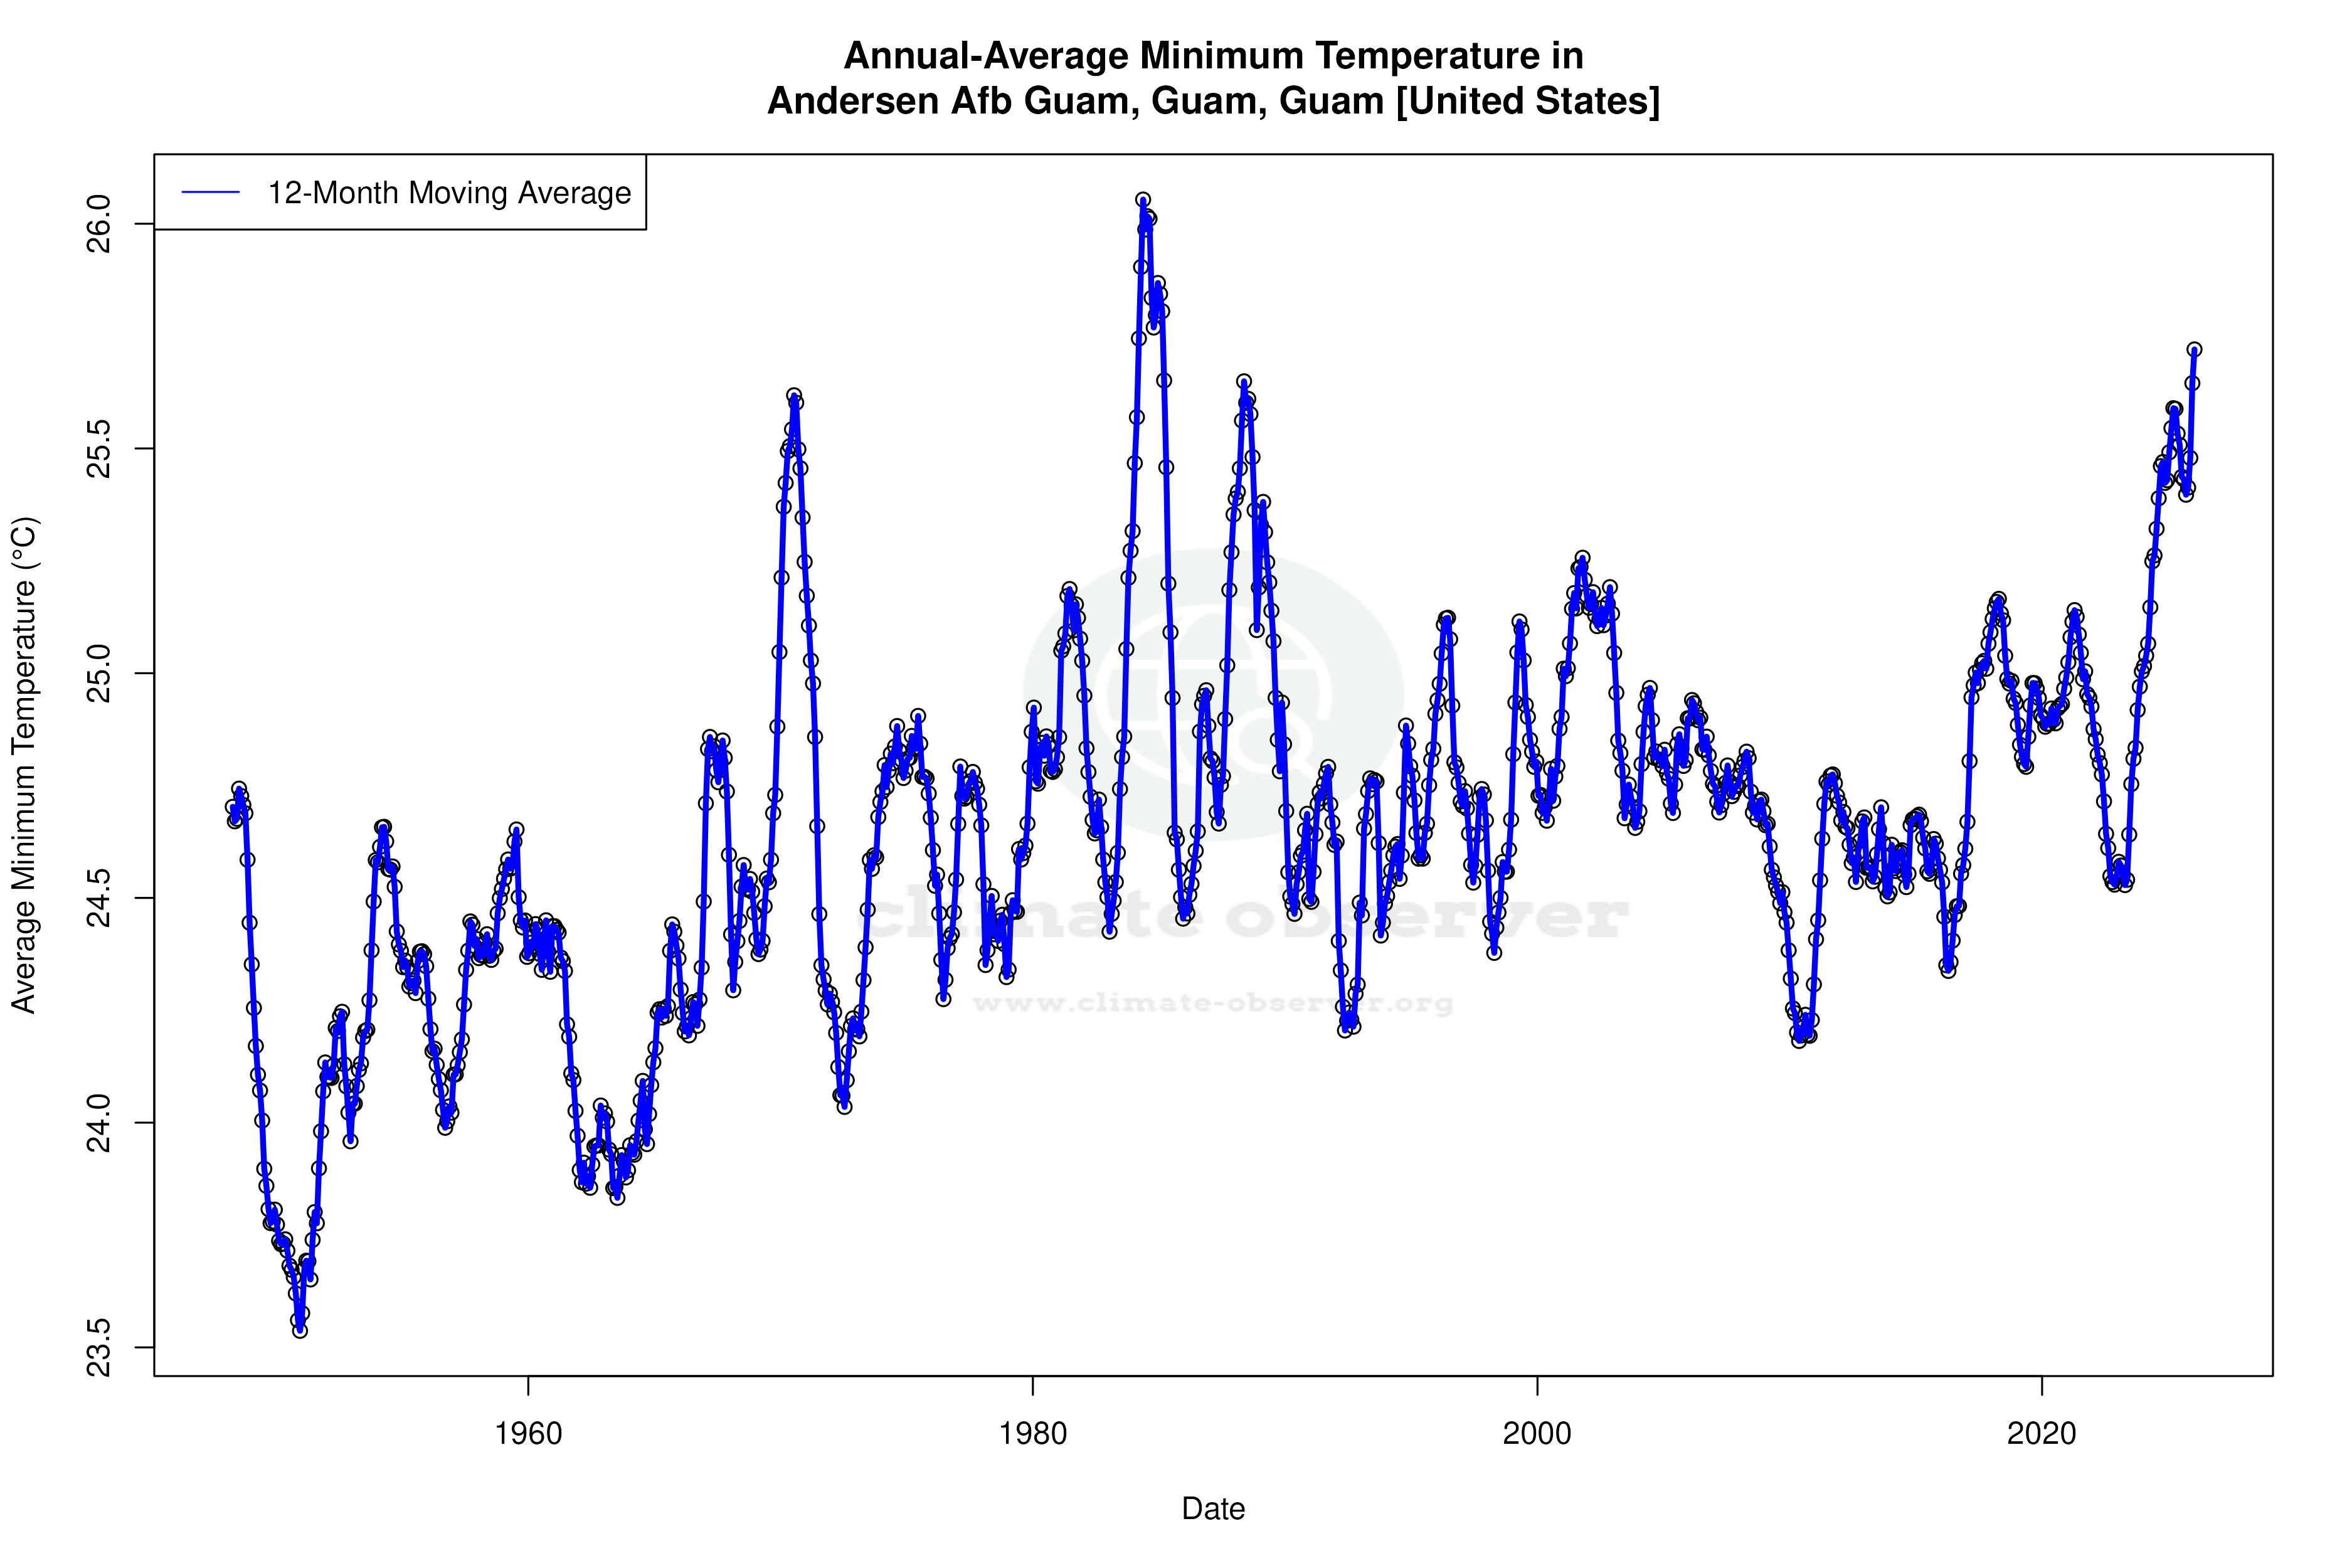
Located in the tropical region of the Pacific Ocean, Andersen AFB in Guam falls under the Köppen climate classification of 'Af', denoting a tropical rainforest climate. This classification is characterised by high temperatures and significant rainfall throughout the year. The geographical setting, being an island, means that the climate is heavily influenced by oceanic patterns and trade winds. The all-time temperature trends indicate a warming of 0.13°C (0.23°F) for highs and 0.10°C (0.18°F) for lows. This gradual increase is consistent with global warming patterns observed across many tropical regions.
Decadal Temperature Shifts
Over the past decade, the warming trend has accelerated, with high temperatures increasing by 0.22°C (0.40°F) and lows by 0.54°C (0.98°F). This more pronounced increase in low temperatures suggests that nights are warming faster than days, a phenomenon that can have significant ecological impacts. The record high of 34.4°C (93.9°F) and record low of 15.1°C (59.2°F) highlight the range of temperatures experienced, though extremes remain relatively stable compared to the rising average temperatures.
Precipitation Patterns and PCI
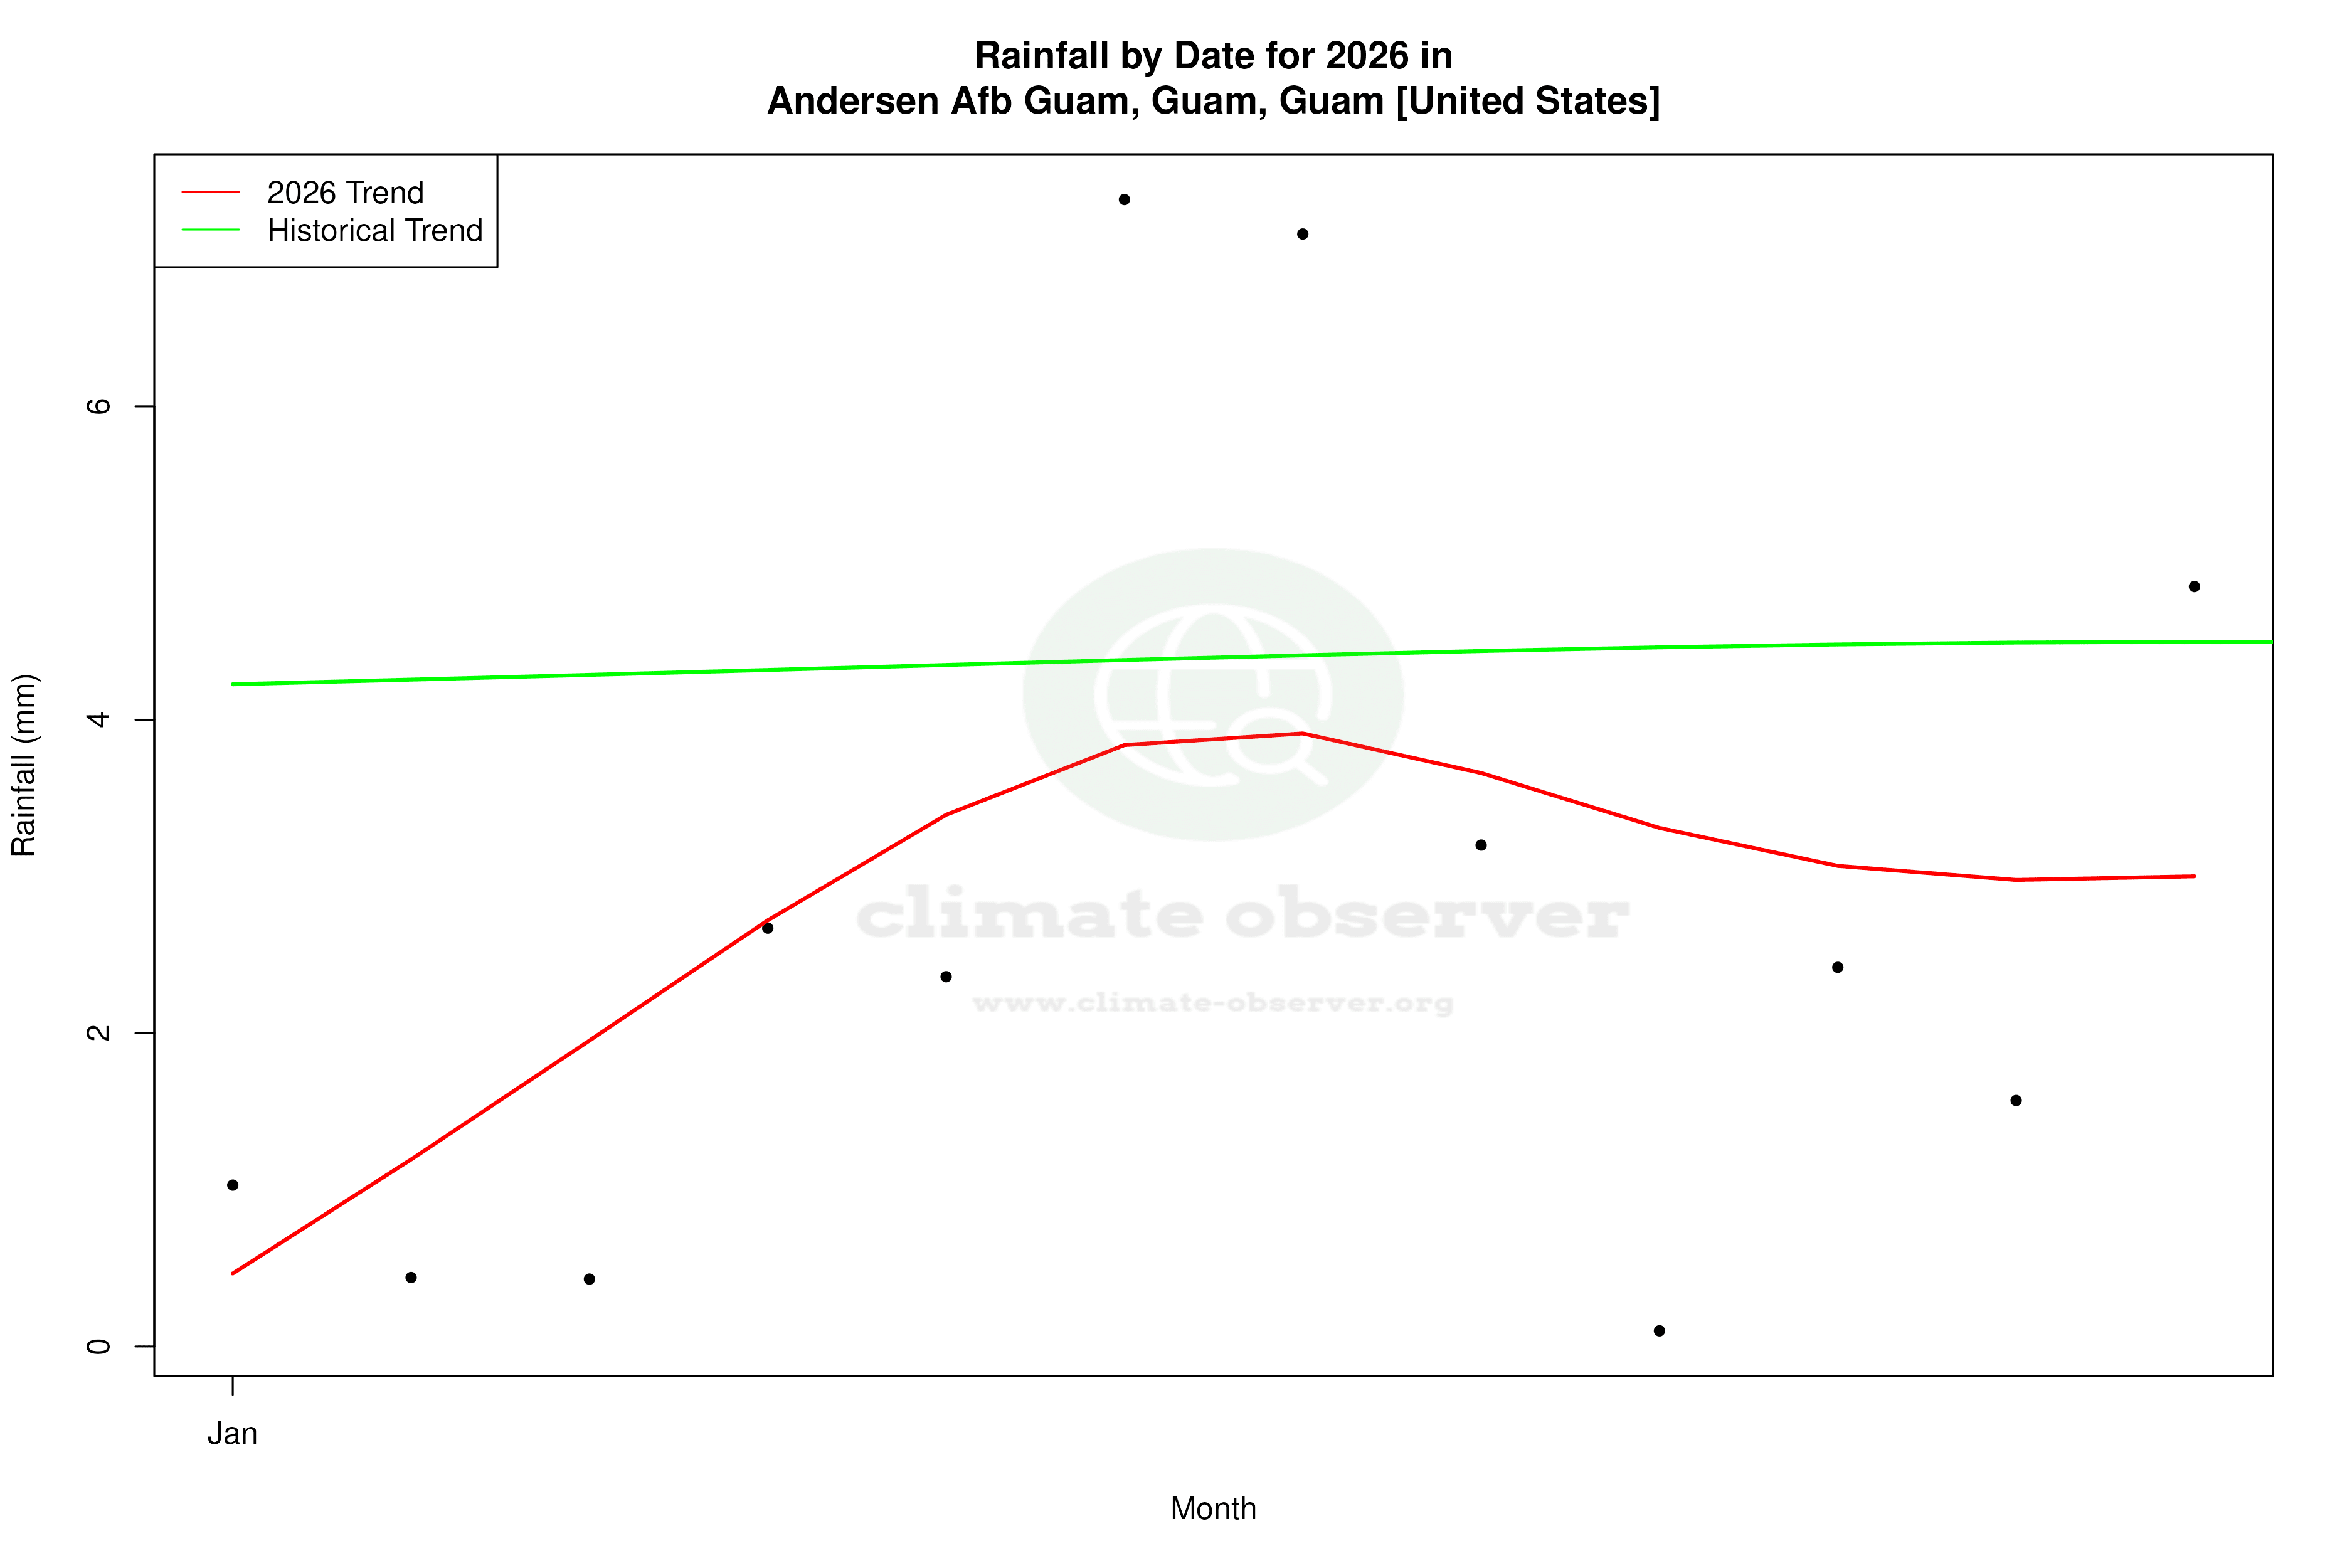
The Precipitation Concentration Index (PCI) has decreased from a baseline of 15.2 to a current value of 12.4, indicating that precipitation is becoming more evenly distributed throughout the year. This shift towards less concentrated rainfall events could have implications for water resource management and agricultural planning on the island. A lower PCI suggests a reduction in the intensity and frequency of heavy rainfall events, which can mitigate the risk of flooding and soil erosion.
Regional Climate Adaptation
These climatic changes are occurring in the context of Guam's regional climate goals, which focus on resilience and adaptation to the impacts of climate change. As part of the United States, Guam is committed to understanding these shifts to better prepare for future climatic conditions. Recent weather events, such as typhoons, underscore the importance of robust climate monitoring and adaptation strategies. The data from Andersen AFB provides valuable insights into the local manifestations of global climate trends, informing both local and broader Pacific regional climate initiatives.
Station Statistics
10-Year Trend
High: +0.08 °C/decade
Low: +0.58 °C/decade
Rain: +3.19 mm/decade
25-Year Trend
High: -0.14 °C/decade
Low: +0.08 °C/decade
Rain: +0.77 mm/decade
50-Year Trend
High: +0.16 °C/decade
Low: +0.02 °C/decade
Rain: +0.21 mm/decade
All-Time Trend
High: +0.12 °C/decade
Low: +0.10 °C/decade
Rain: +0.17 mm/decade
Percentage Above-Average Days
Last 12 Months: 66.8%
This Year: 78.9%
Precipitation Concentration Index (PCI) ℹ️
Last 12 Months: 9.4
Historical Average: 14.0
Percentile Rank of Last 12 Months ℹ️
High: 91st percentile
Low: 97th percentile
Rain: 69th percentile
Change in Variance ℹ️
High: -11.9%
Low: -7.6%
Intraday: -3.8%
Data Coverage
89.5%
First Year of Data
1945
Station Location
Historical Weather Records
| Max High | Avg High | Min High | Max Avg | Avg Avg | Min Avg | Max Low | Avg Low | Min Low | Max Precipitation | Avg Precipitation | Max Snow | Avg Snow | |
|---|---|---|---|---|---|---|---|---|---|---|---|---|---|
| Record | 34.4 °C | — | 22.8 °C | 30.1 °C | — | 22.7 °C | 30.0 °C | — | 15.1 °C | 464.8 mm | — | 0.0 mm | — |
| January | 31.1 °C | 28.0 °C | 22.8 °C | 28.6 °C | 26.4 °C | 23.2 °C | 28.2 °C | 24.1 °C | 15.6 °C | 160.3 mm | 4.4 mm | 0.0 mm | 0.0 mm |
| February | 33.9 °C | 28.1 °C | 23.9 °C | 28.3 °C | 26.2 °C | 22.9 °C | 27.7 °C | 23.9 °C | 16.7 °C | 200.2 mm | 3.7 mm | 0.0 mm | 0.0 mm |
| March | 33.0 °C | 28.4 °C | 23.9 °C | 28.9 °C | 26.6 °C | 22.7 °C | 27.2 °C | 24.1 °C | 15.1 °C | 71.1 mm | 2.8 mm | 0.0 mm | 0.0 mm |
| April | 32.8 °C | 29.0 °C | 24.4 °C | 29.4 °C | 27.2 °C | 24.6 °C | 28.9 °C | 24.6 °C | 20.6 °C | 227.6 mm | 3.3 mm | 0.0 mm | 0.0 mm |
| May | 34.4 °C | 29.4 °C | 25.0 °C | 30.0 °C | 27.7 °C | 24.9 °C | 30.0 °C | 25.2 °C | 21.1 °C | 242.1 mm | 4.1 mm | 0.0 mm | 0.0 mm |
| June | 33.9 °C | 29.7 °C | 25.0 °C | 30.1 °C | 27.9 °C | 24.7 °C | 28.3 °C | 25.3 °C | 21.1 °C | 98.0 mm | 5.4 mm | 0.0 mm | 0.0 mm |
| July | 33.4 °C | 29.4 °C | 24.4 °C | 29.7 °C | 27.5 °C | 24.2 °C | 28.9 °C | 24.9 °C | 20.0 °C | 131.3 mm | 9.3 mm | 0.0 mm | 0.0 mm |
| August | 34.1 °C | 29.3 °C | 22.8 °C | 29.4 °C | 27.3 °C | 24.1 °C | 27.8 °C | 24.6 °C | 20.0 °C | 244.9 mm | 12.6 mm | 0.0 mm | 0.0 mm |
| September | 33.9 °C | 29.4 °C | 24.4 °C | 29.6 °C | 27.2 °C | 24.0 °C | 28.9 °C | 24.6 °C | 19.8 °C | 238.8 mm | 12.6 mm | 0.0 mm | 0.0 mm |
| October | 33.9 °C | 29.2 °C | 23.9 °C | 29.7 °C | 27.3 °C | 23.7 °C | 29.4 °C | 24.8 °C | 20.0 °C | 464.8 mm | 11.2 mm | 0.0 mm | 0.0 mm |
| November | 32.8 °C | 29.1 °C | 25.6 °C | 29.4 °C | 27.4 °C | 24.9 °C | 28.4 °C | 25.1 °C | 21.1 °C | 154.2 mm | 7.5 mm | 0.0 mm | 0.0 mm |
| December | 32.2 °C | 28.6 °C | 25.0 °C | 29.4 °C | 27.0 °C | 24.3 °C | 28.9 °C | 24.7 °C | 17.8 °C | 167.4 mm | 4.8 mm | 0.0 mm | 0.0 mm |
Data Visualisations
Remove WatermarksCurrent Year Climate Trends vs Historical

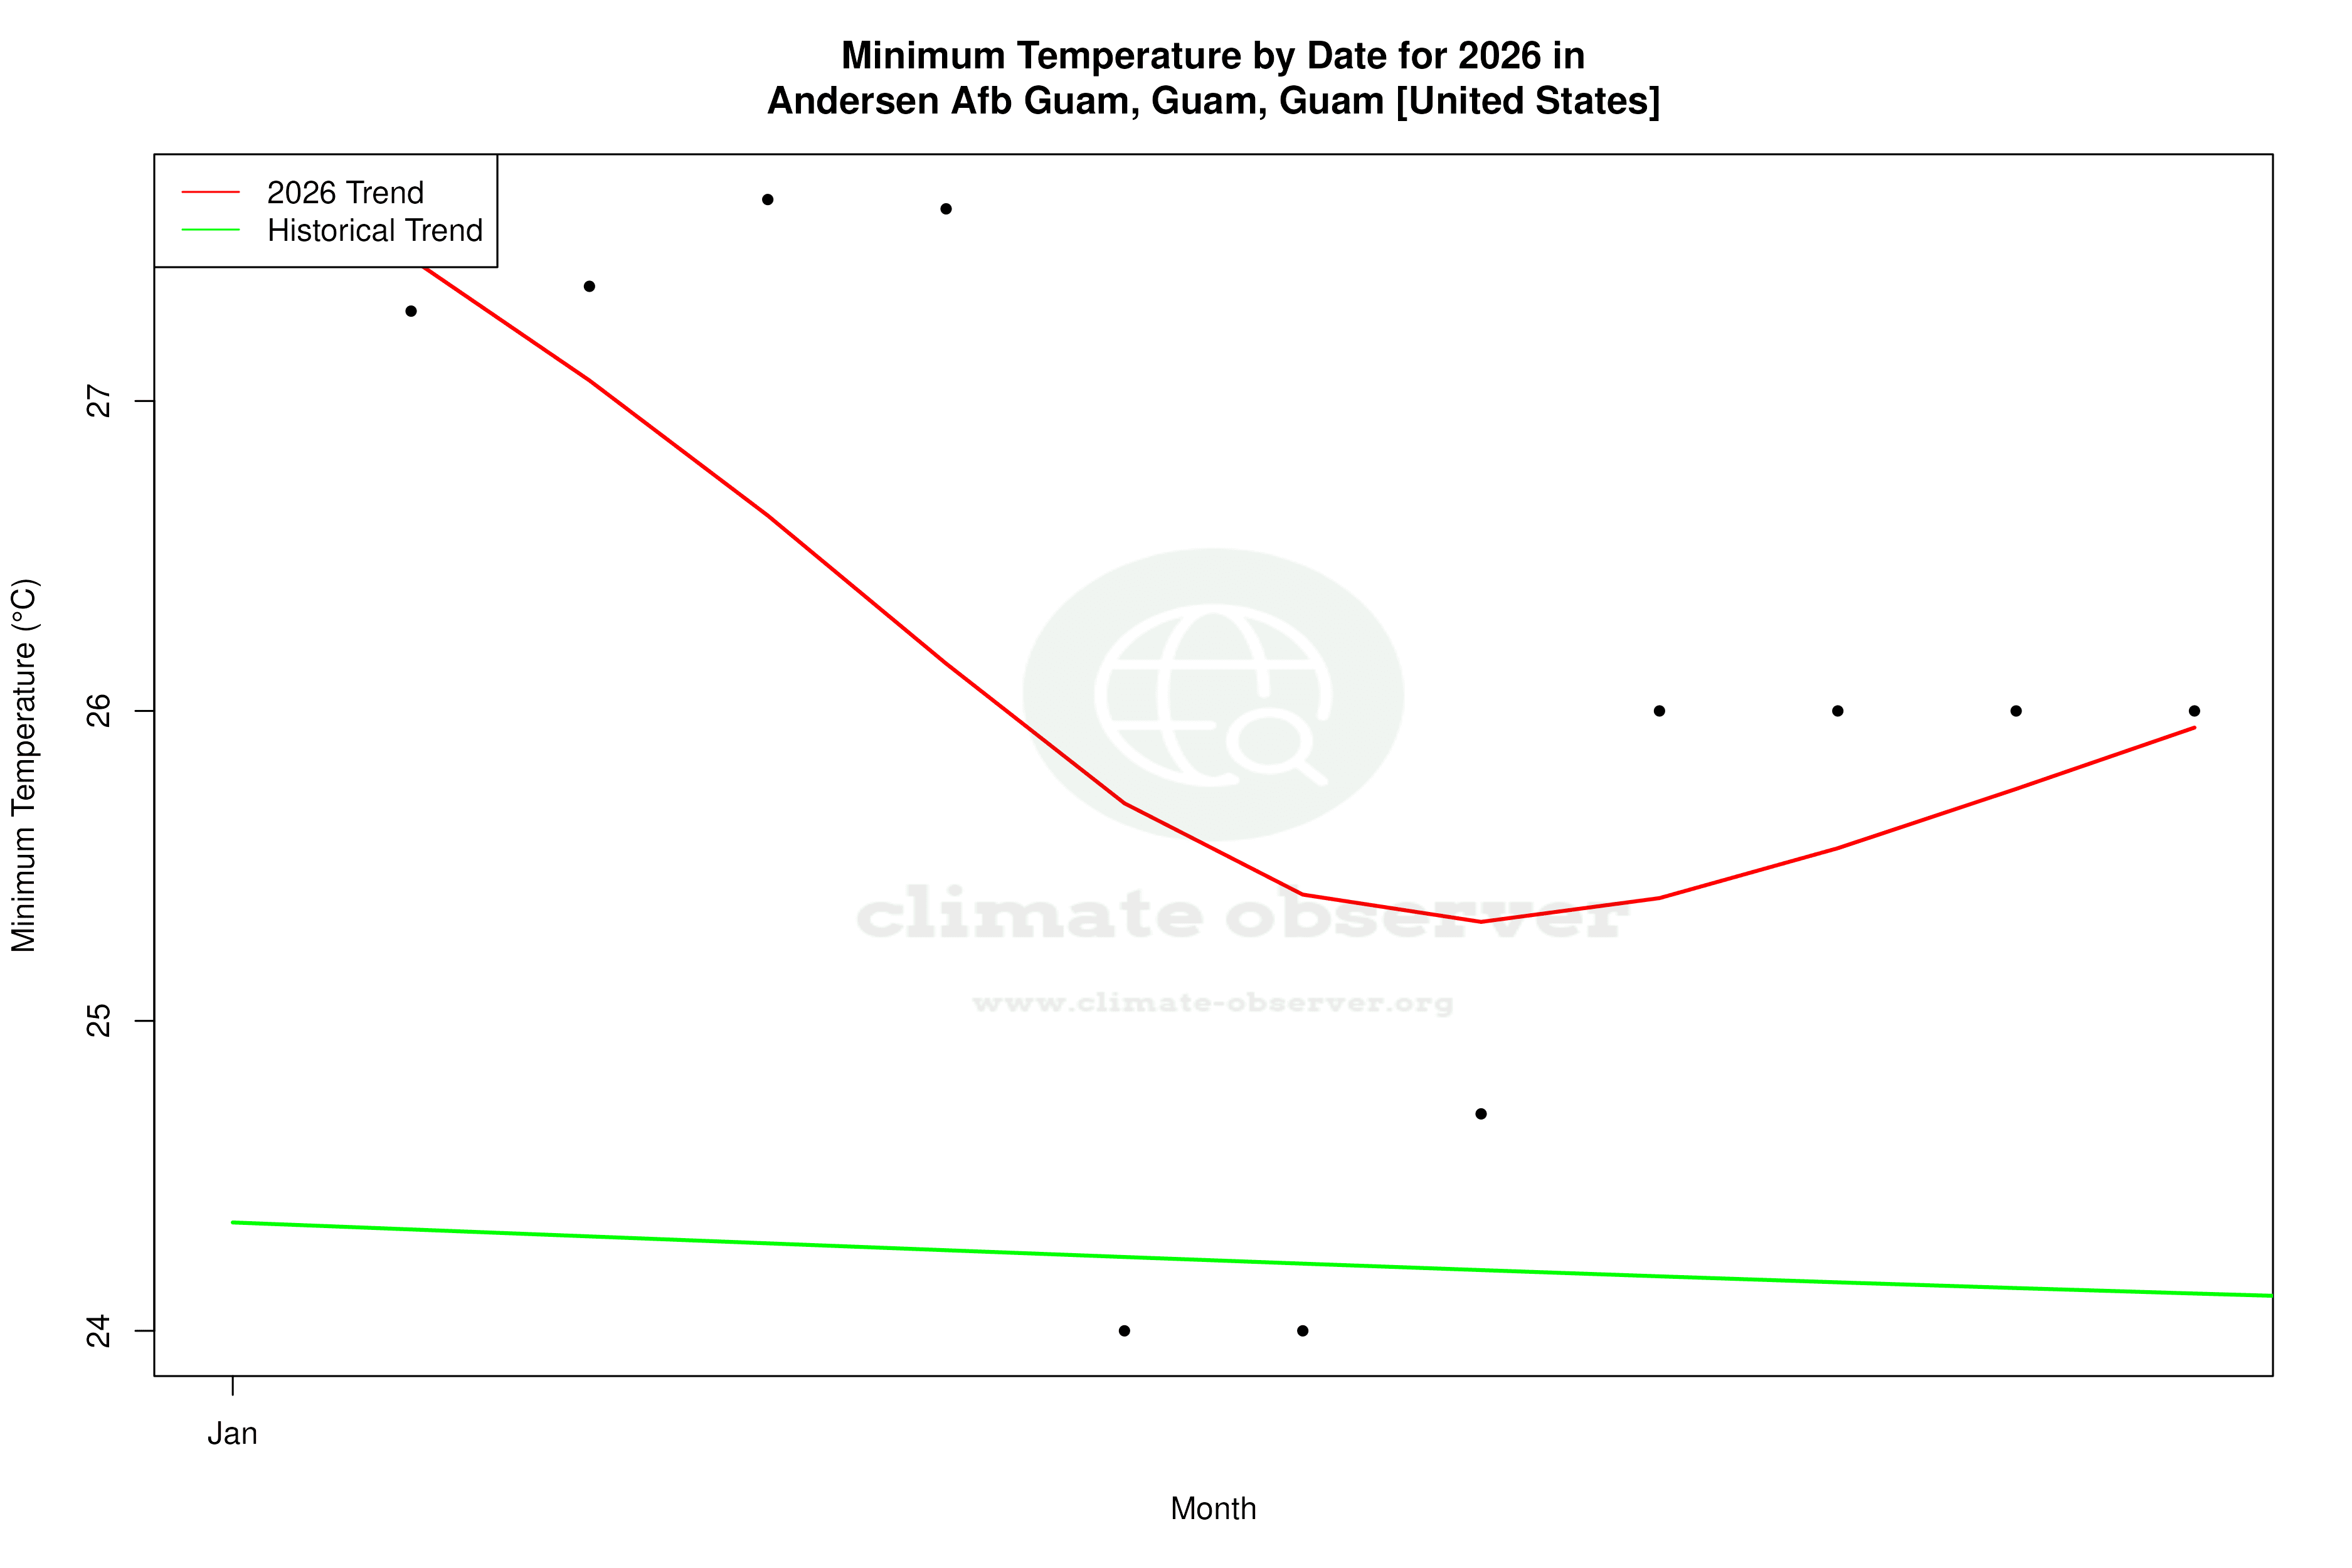


Max Temperature this Year | 1 of 6
Climate 12-Month Moving Averages
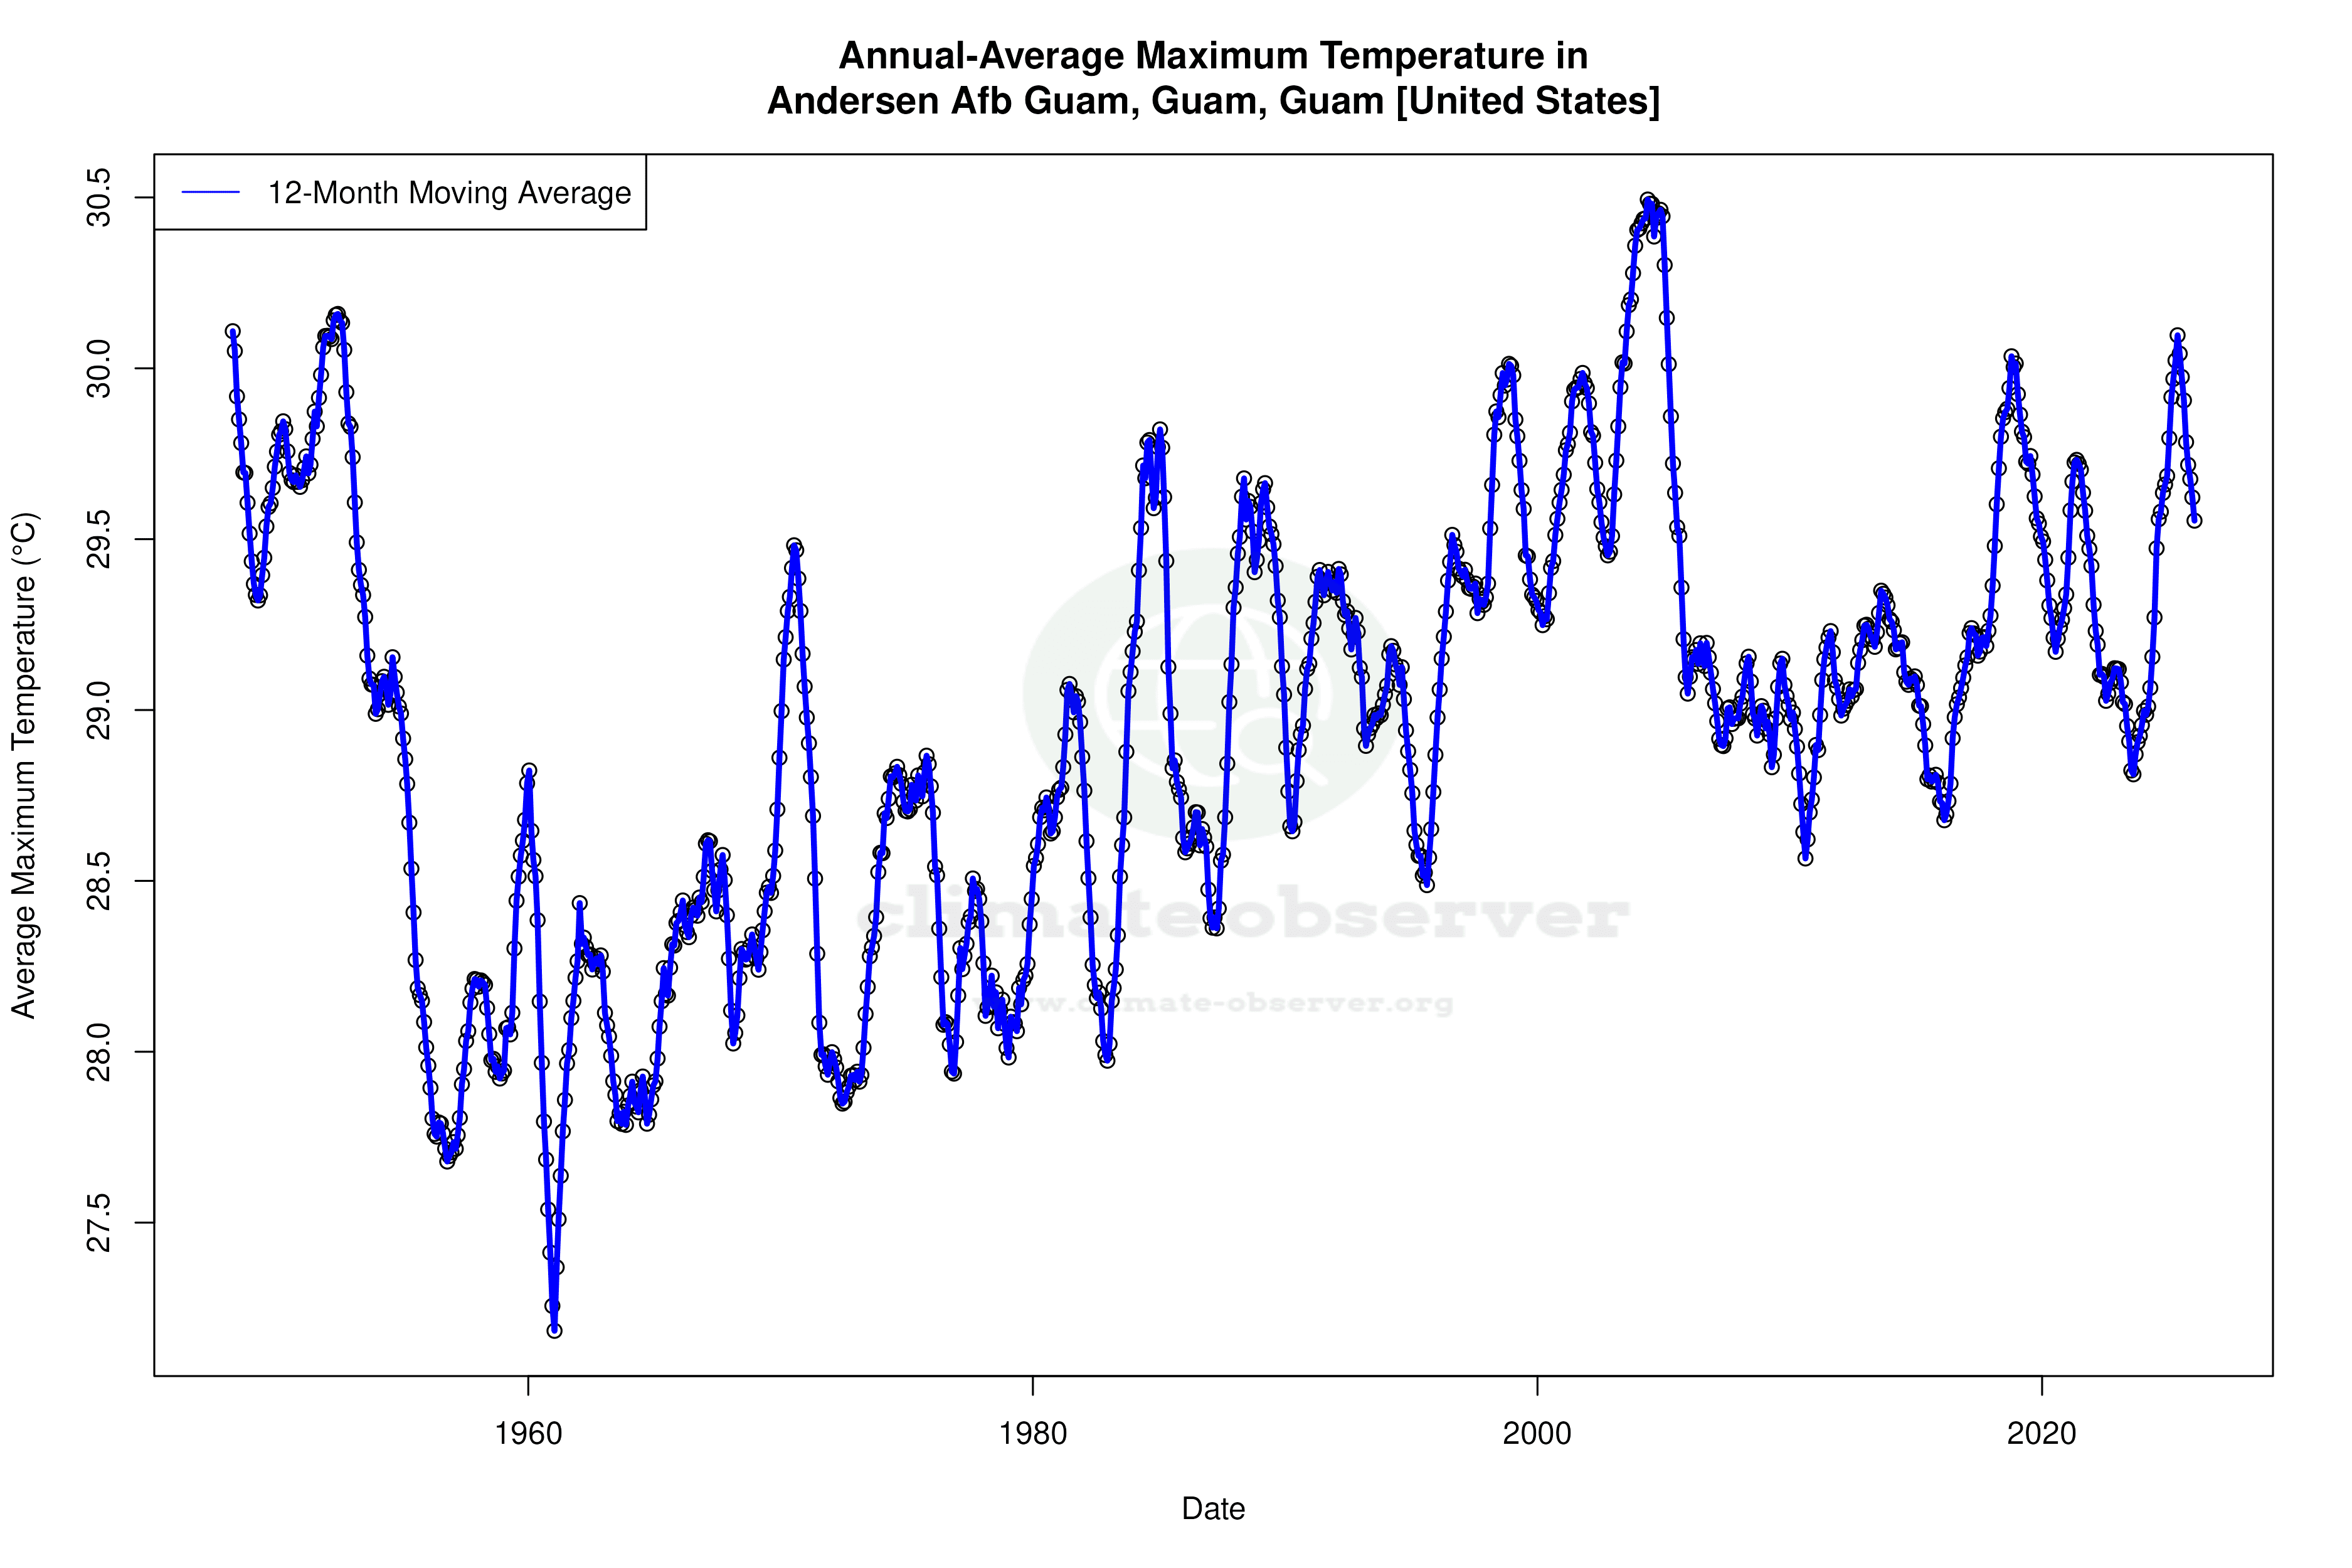


Max Temperature 12-Month MA | 1 of 6
Daily Data Points and Averages Throughout the Year


Average Max Temperature Throughout Year | 1 of 5
