Climate for Station: Larissa, Thessaly–Central Greece, Greece
Loading live weather...
Climate Analysis & Overview
Larissa, located in the heart of Thessaly, Greece, is experiencing a warming trend, with significant rises in both high and low temperatures over the past decade. The region's precipitation has become more evenly distributed, indicating shifts in local climatic patterns.
Köppen Classification and Geographic Influence
Larissa falls under the Köppen climate classification of Csa, which is characterised by hot, dry summers and mild, wet winters. Nestled in the fertile plains of Thessaly, the city is shielded by the Pindus mountain range to the west and the Aegean Sea to the east. This geographical setting influences its climate, often leading to temperature extremes and variable precipitation patterns.
Temperature Trends: A Warming Landscape
Over the past decade, Larissa has experienced a notable warming trend. The average high temperatures have increased by 1.01°C (1.82°F), while the lows have risen by 0.55°C (0.99°F). These changes are more pronounced than the all-time trends, which show a rise of 0.23°C (0.41°F) for highs and 0.21°C (0.38°F) for lows. This suggests an acceleration in warming, potentially linked to broader regional climate dynamics and anthropogenic influences.
Precipitation Patterns: A Shift Towards Even Distribution
The Precipitation Concentration Index (PCI) for Larissa has decreased from a baseline of 13.8 to a current value of 11.0. This indicates that precipitation events are becoming more evenly distributed throughout the year, a trend that could mitigate the risks of droughts and floods. Such a shift towards a more balanced precipitation regime could be beneficial for the agricultural activities that dominate the region.
Record Extremes: A City of Contrasts
Larissa's climate is marked by its record temperature extremes. The highest recorded temperature is 45.4°C (113.7°F), while the lowest is -21.6°C (-6.9°F). These extremes highlight the city's susceptibility to intense heatwaves and severe cold spells, which are exacerbated by its continental climate influences and geographical positioning.
Regional Climate Goals and Recent Events
Greece has been actively pursuing climate goals aimed at reducing carbon emissions and enhancing renewable energy usage. Recent weather events, such as heatwaves and unseasonal rainfall, underscore the urgency of these initiatives. Larissa's climate profile, with its warming trends and evolving precipitation patterns, reflects the broader challenges and opportunities faced by the region in adapting to climate change.
Station Statistics
10-Year Trend
High: +0.99 °C/decade
Low: +0.87 °C/decade
Rain: +0.34 mm/decade
25-Year Trend
High: +0.72 °C/decade
Low: +0.08 °C/decade
Rain: +0.06 mm/decade
50-Year Trend
High: +0.44 °C/decade
Low: +0.38 °C/decade
Rain: +0.00 mm/decade
All-Time Trend
High: +0.23 °C/decade
Low: +0.22 °C/decade
Rain: -0.01 mm/decade
Percentage Above-Average Days
Last 12 Months: 48.2%
This Year: 51.9%
Precipitation Concentration Index (PCI) ℹ️
Last 12 Months: 11.0
Historical Average: 14.2
Percentile Rank of Last 12 Months ℹ️
High: 92nd percentile
Low: 95th percentile
Rain: 76th percentile
Change in Variance ℹ️
High: -4.6%
Low: +8.5%
Intraday: -11.1%
Data Coverage
96.0%
First Year of Data
1955
Station Location
Historical Weather Records
| Max High | Avg High | Min High | Max Avg | Avg Avg | Min Avg | Max Low | Avg Low | Min Low | Max Precipitation | Avg Precipitation | Max Snow | Avg Snow | |
|---|---|---|---|---|---|---|---|---|---|---|---|---|---|
| Record | 45.4 °C | — | -10.0 °C | 35.4 °C | — | -11.9 °C | 27.5 °C | — | -21.6 °C | 141.1 mm | — | — | — |
| January | 22.8 °C | 10.2 °C | -8.6 °C | 17.2 °C | 4.9 °C | -11.9 °C | 14.0 °C | 0.6 °C | -21.6 °C | 61.6 mm | 1.1 mm | — | — |
| February | 25.2 °C | 12.4 °C | -1.3 °C | 15.9 °C | 6.7 °C | -4.9 °C | 12.5 °C | 1.6 °C | -12.0 °C | 31.9 mm | 1.2 mm | — | — |
| March | 34.8 °C | 15.4 °C | 0.0 °C | 22.6 °C | 9.4 °C | -2.7 °C | 17.0 °C | 3.5 °C | -7.0 °C | 38.7 mm | 1.3 mm | — | — |
| April | 32.4 °C | 20.1 °C | 8.0 °C | 23.0 °C | 13.4 °C | 2.6 °C | 15.6 °C | 6.7 °C | -4.4 °C | 47.6 mm | 1.1 mm | — | — |
| May | 40.0 °C | 26.1 °C | 11.6 °C | 29.8 °C | 18.8 °C | 9.1 °C | 23.0 °C | 11.4 °C | 1.4 °C | 67.8 mm | 1.2 mm | — | — |
| June | 44.6 °C | 31.4 °C | 18.5 °C | 32.9 °C | 24.0 °C | 14.3 °C | 24.8 °C | 16.0 °C | 3.0 °C | 45.0 mm | 0.8 mm | — | — |
| July | 45.4 °C | 33.7 °C | 18.6 °C | 35.4 °C | 26.3 °C | 14.1 °C | 27.5 °C | 18.5 °C | 11.0 °C | 109.5 mm | 0.6 mm | — | — |
| August | 45.0 °C | 33.1 °C | 20.0 °C | 32.9 °C | 25.6 °C | 16.7 °C | 25.6 °C | 18.0 °C | 10.0 °C | 49.9 mm | 0.4 mm | — | — |
| September | 40.4 °C | 28.6 °C | 14.6 °C | 29.7 °C | 21.4 °C | 12.8 °C | 24.0 °C | 14.5 °C | 5.0 °C | 141.1 mm | 1.2 mm | — | — |
| October | 36.8 °C | 22.5 °C | 6.6 °C | 25.6 °C | 16.1 °C | 5.4 °C | 19.0 °C | 10.3 °C | -2.0 °C | 86.0 mm | 1.6 mm | — | — |
| November | 29.6 °C | 16.2 °C | 4.8 °C | 20.4 °C | 10.7 °C | 0.3 °C | 15.6 °C | 6.1 °C | -7.0 °C | 53.6 mm | 1.7 mm | — | — |
| December | 23.4 °C | 11.3 °C | -10.0 °C | 17.7 °C | 6.2 °C | -10.4 °C | 14.6 °C | 2.2 °C | -20.6 °C | 64.8 mm | 1.7 mm | — | — |
Data Visualisations
Remove WatermarksCurrent Year Climate Trends vs Historical

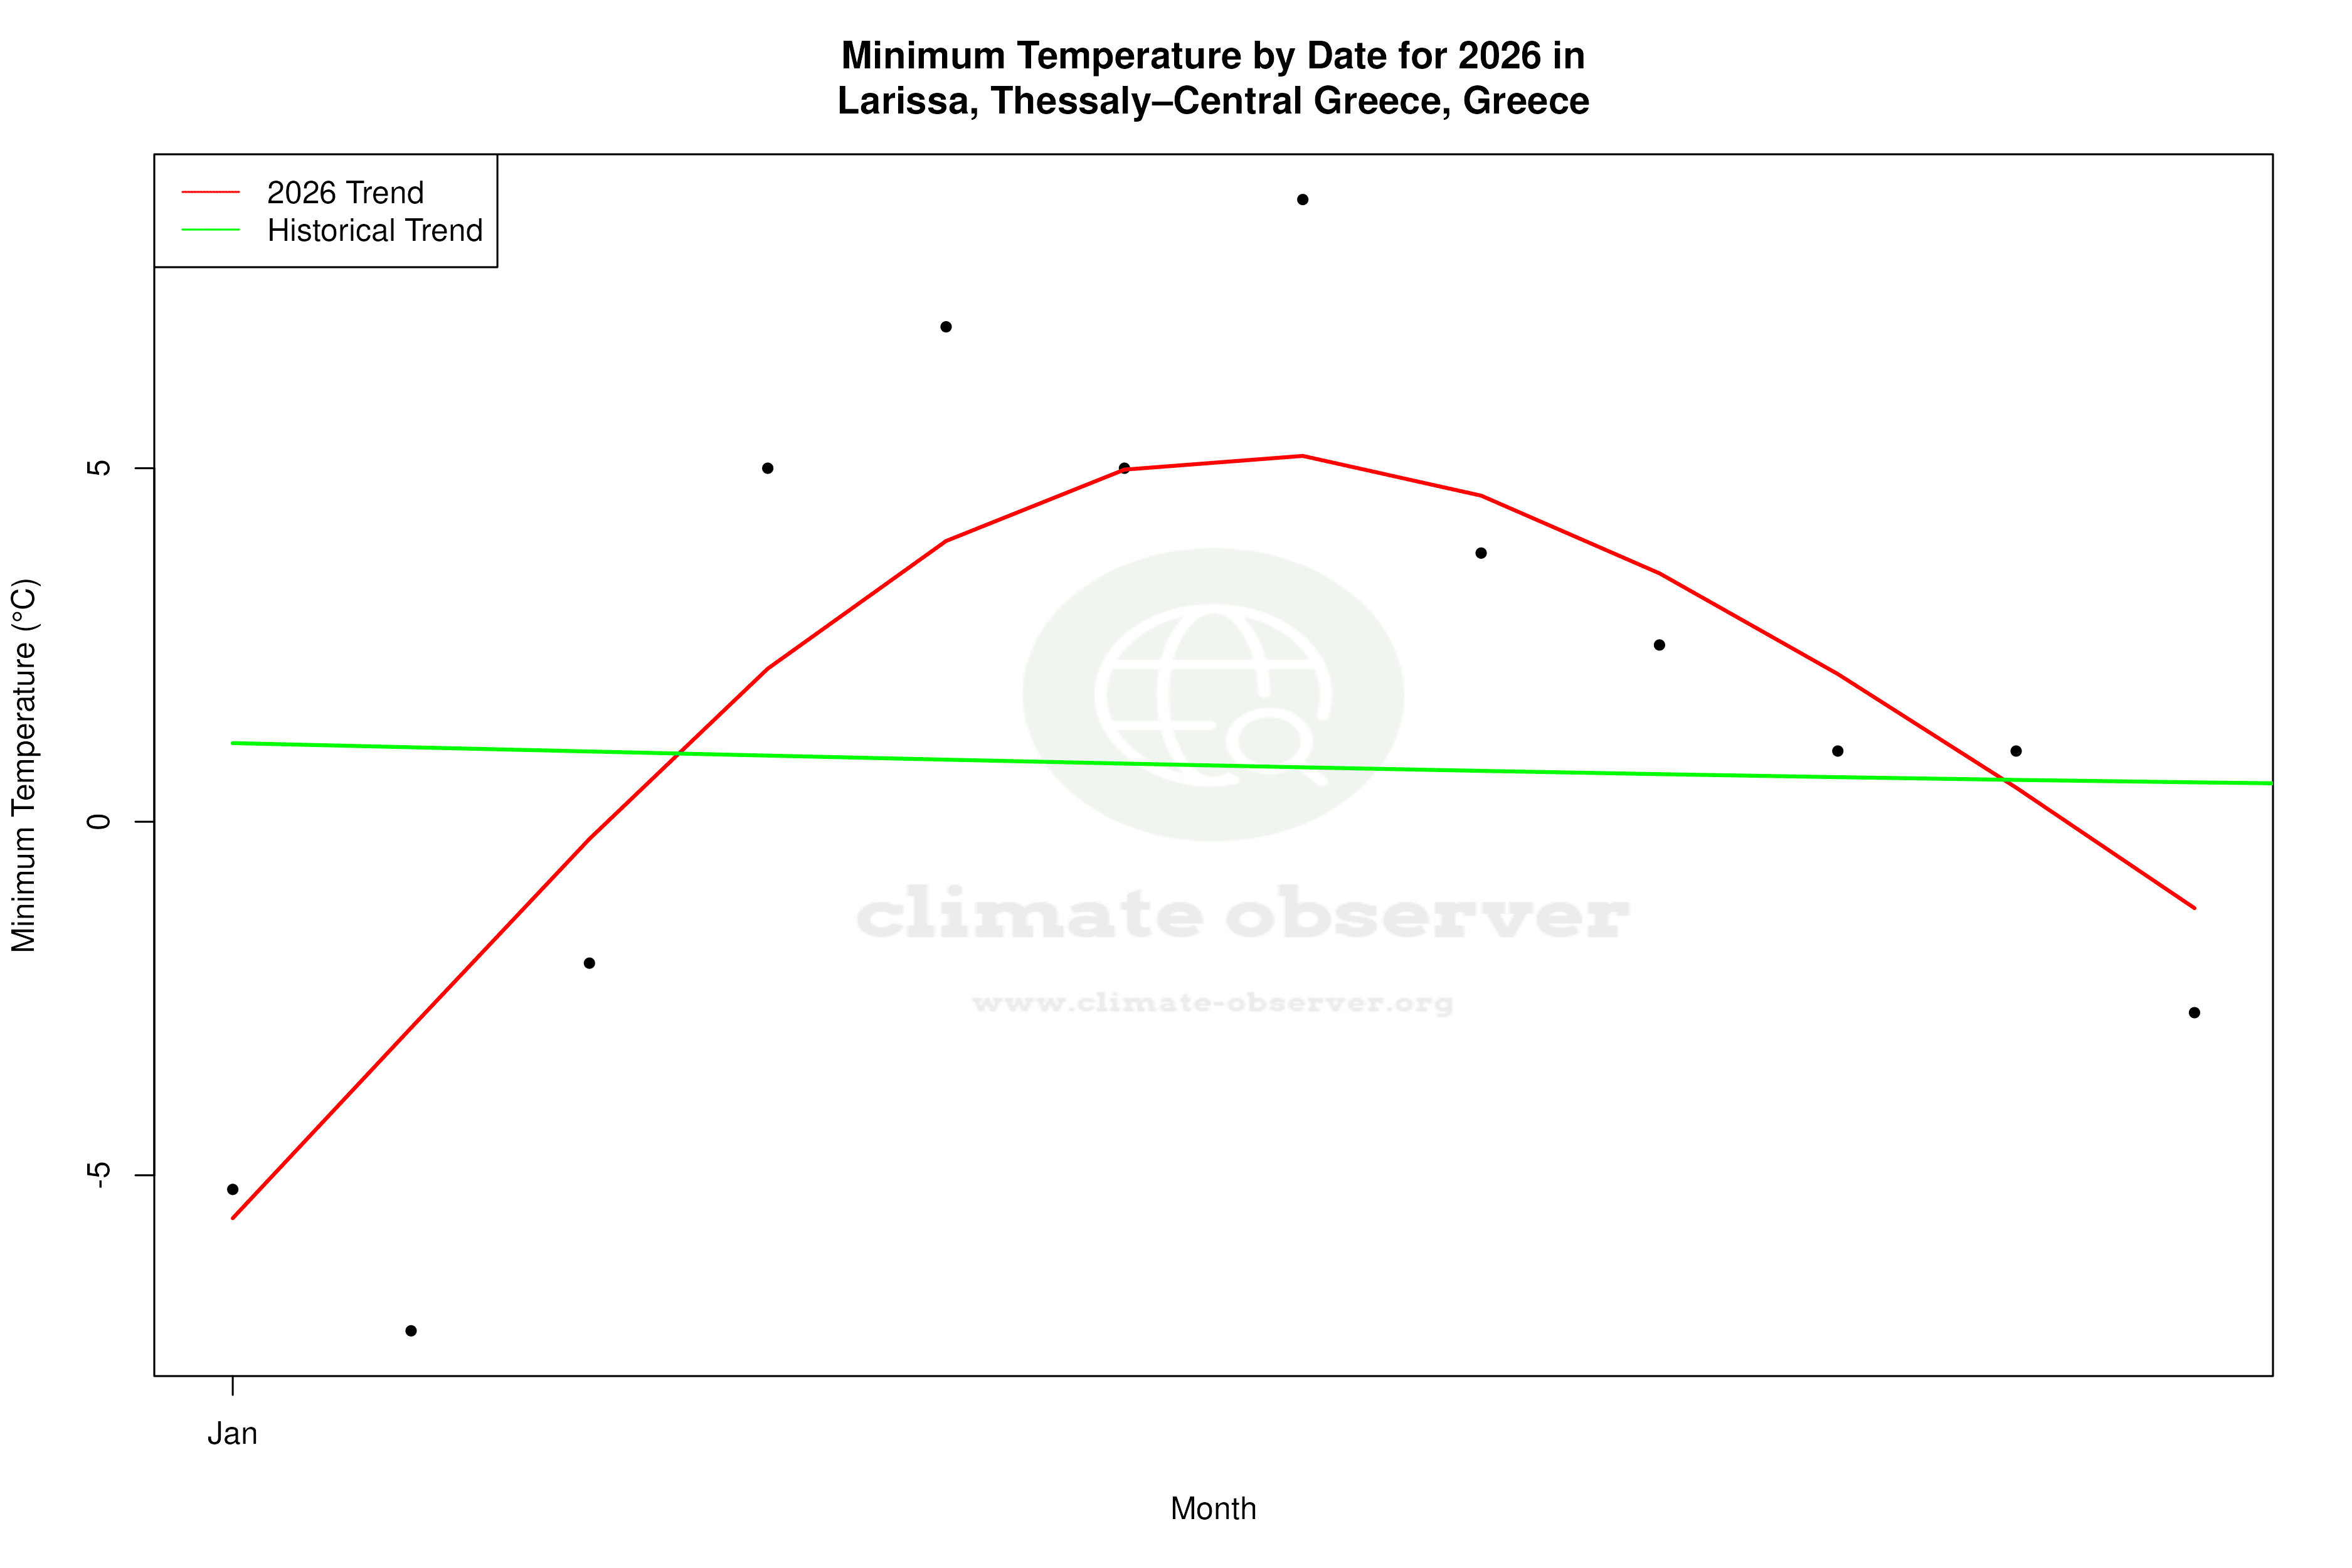


Max Temperature this Year | 1 of 6
Climate 12-Month Moving Averages


Max Temperature 12-Month MA | 1 of 6
Daily Data Points and Averages Throughout the Year


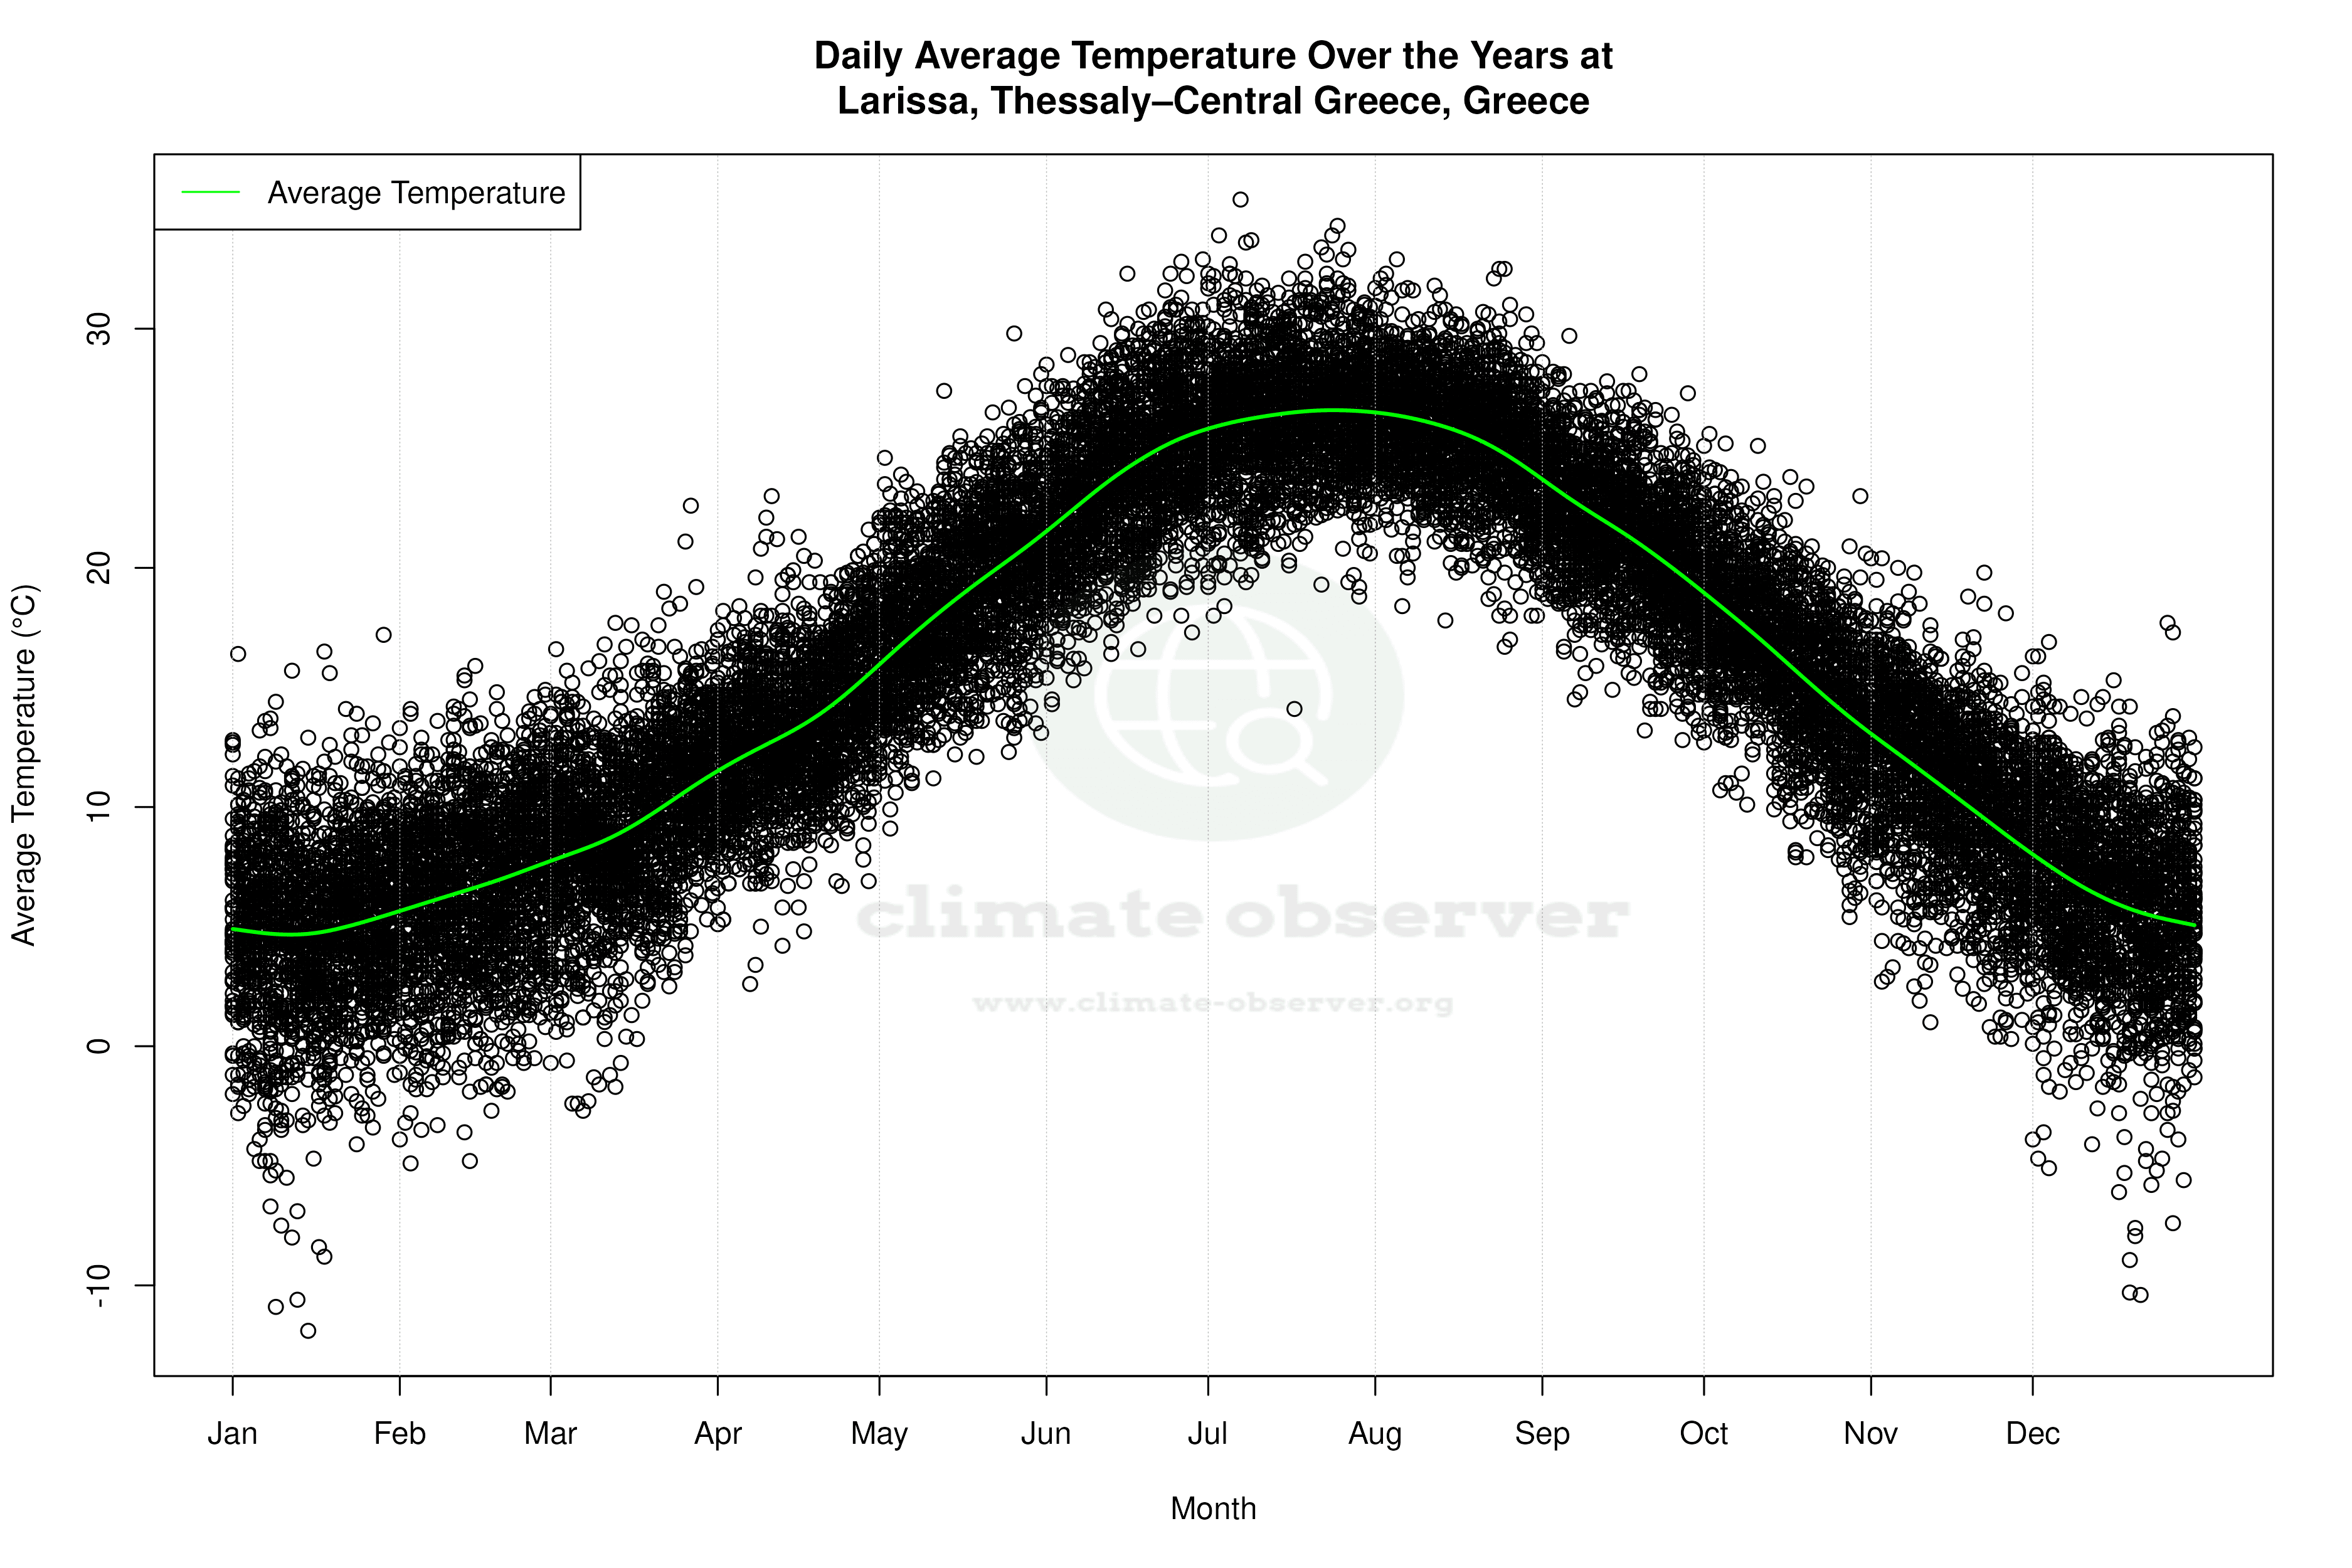


Average Max Temperature Throughout Year | 1 of 5
