Climate for Station: Hellinikon, Attica, Greece
Loading live weather...
Climate Analysis & Overview
The Hellinikon area is experiencing a marked warming trend, with recent data showing significant increases in both high and low temperatures over the past decade. Precipitation patterns have become more evenly distributed, indicating a shift towards less concentrated rainfall events.
Mediterranean Climate Dynamics
Hellinikon, located in the Attica region of Greece, falls under the Mediterranean climate classification, characterised by hot, dry summers and mild, wet winters. This climate is influenced by its proximity to the Aegean Sea, which moderates temperatures but also contributes to humidity levels. The area's all-time temperature trends reveal a 0.26°C (0.47°F) rise in high temperatures and a 0.12°C (0.22°F) increase in low temperatures. These trends suggest a gradual warming over the years, aligning with broader regional climate patterns.
Decadal Temperature Surge
In recent years, Hellinikon has experienced a more pronounced warming trend. Over the past decade, high temperatures have increased by 1.64°C (2.95°F), while low temperatures have risen by 1.82°C (3.28°F). This significant rise in both high and low temperature intervals suggests an accelerated warming phase, potentially influenced by urban heat island effects and global climate change. Such rapid changes can have implications for local agriculture, energy consumption, and public health.
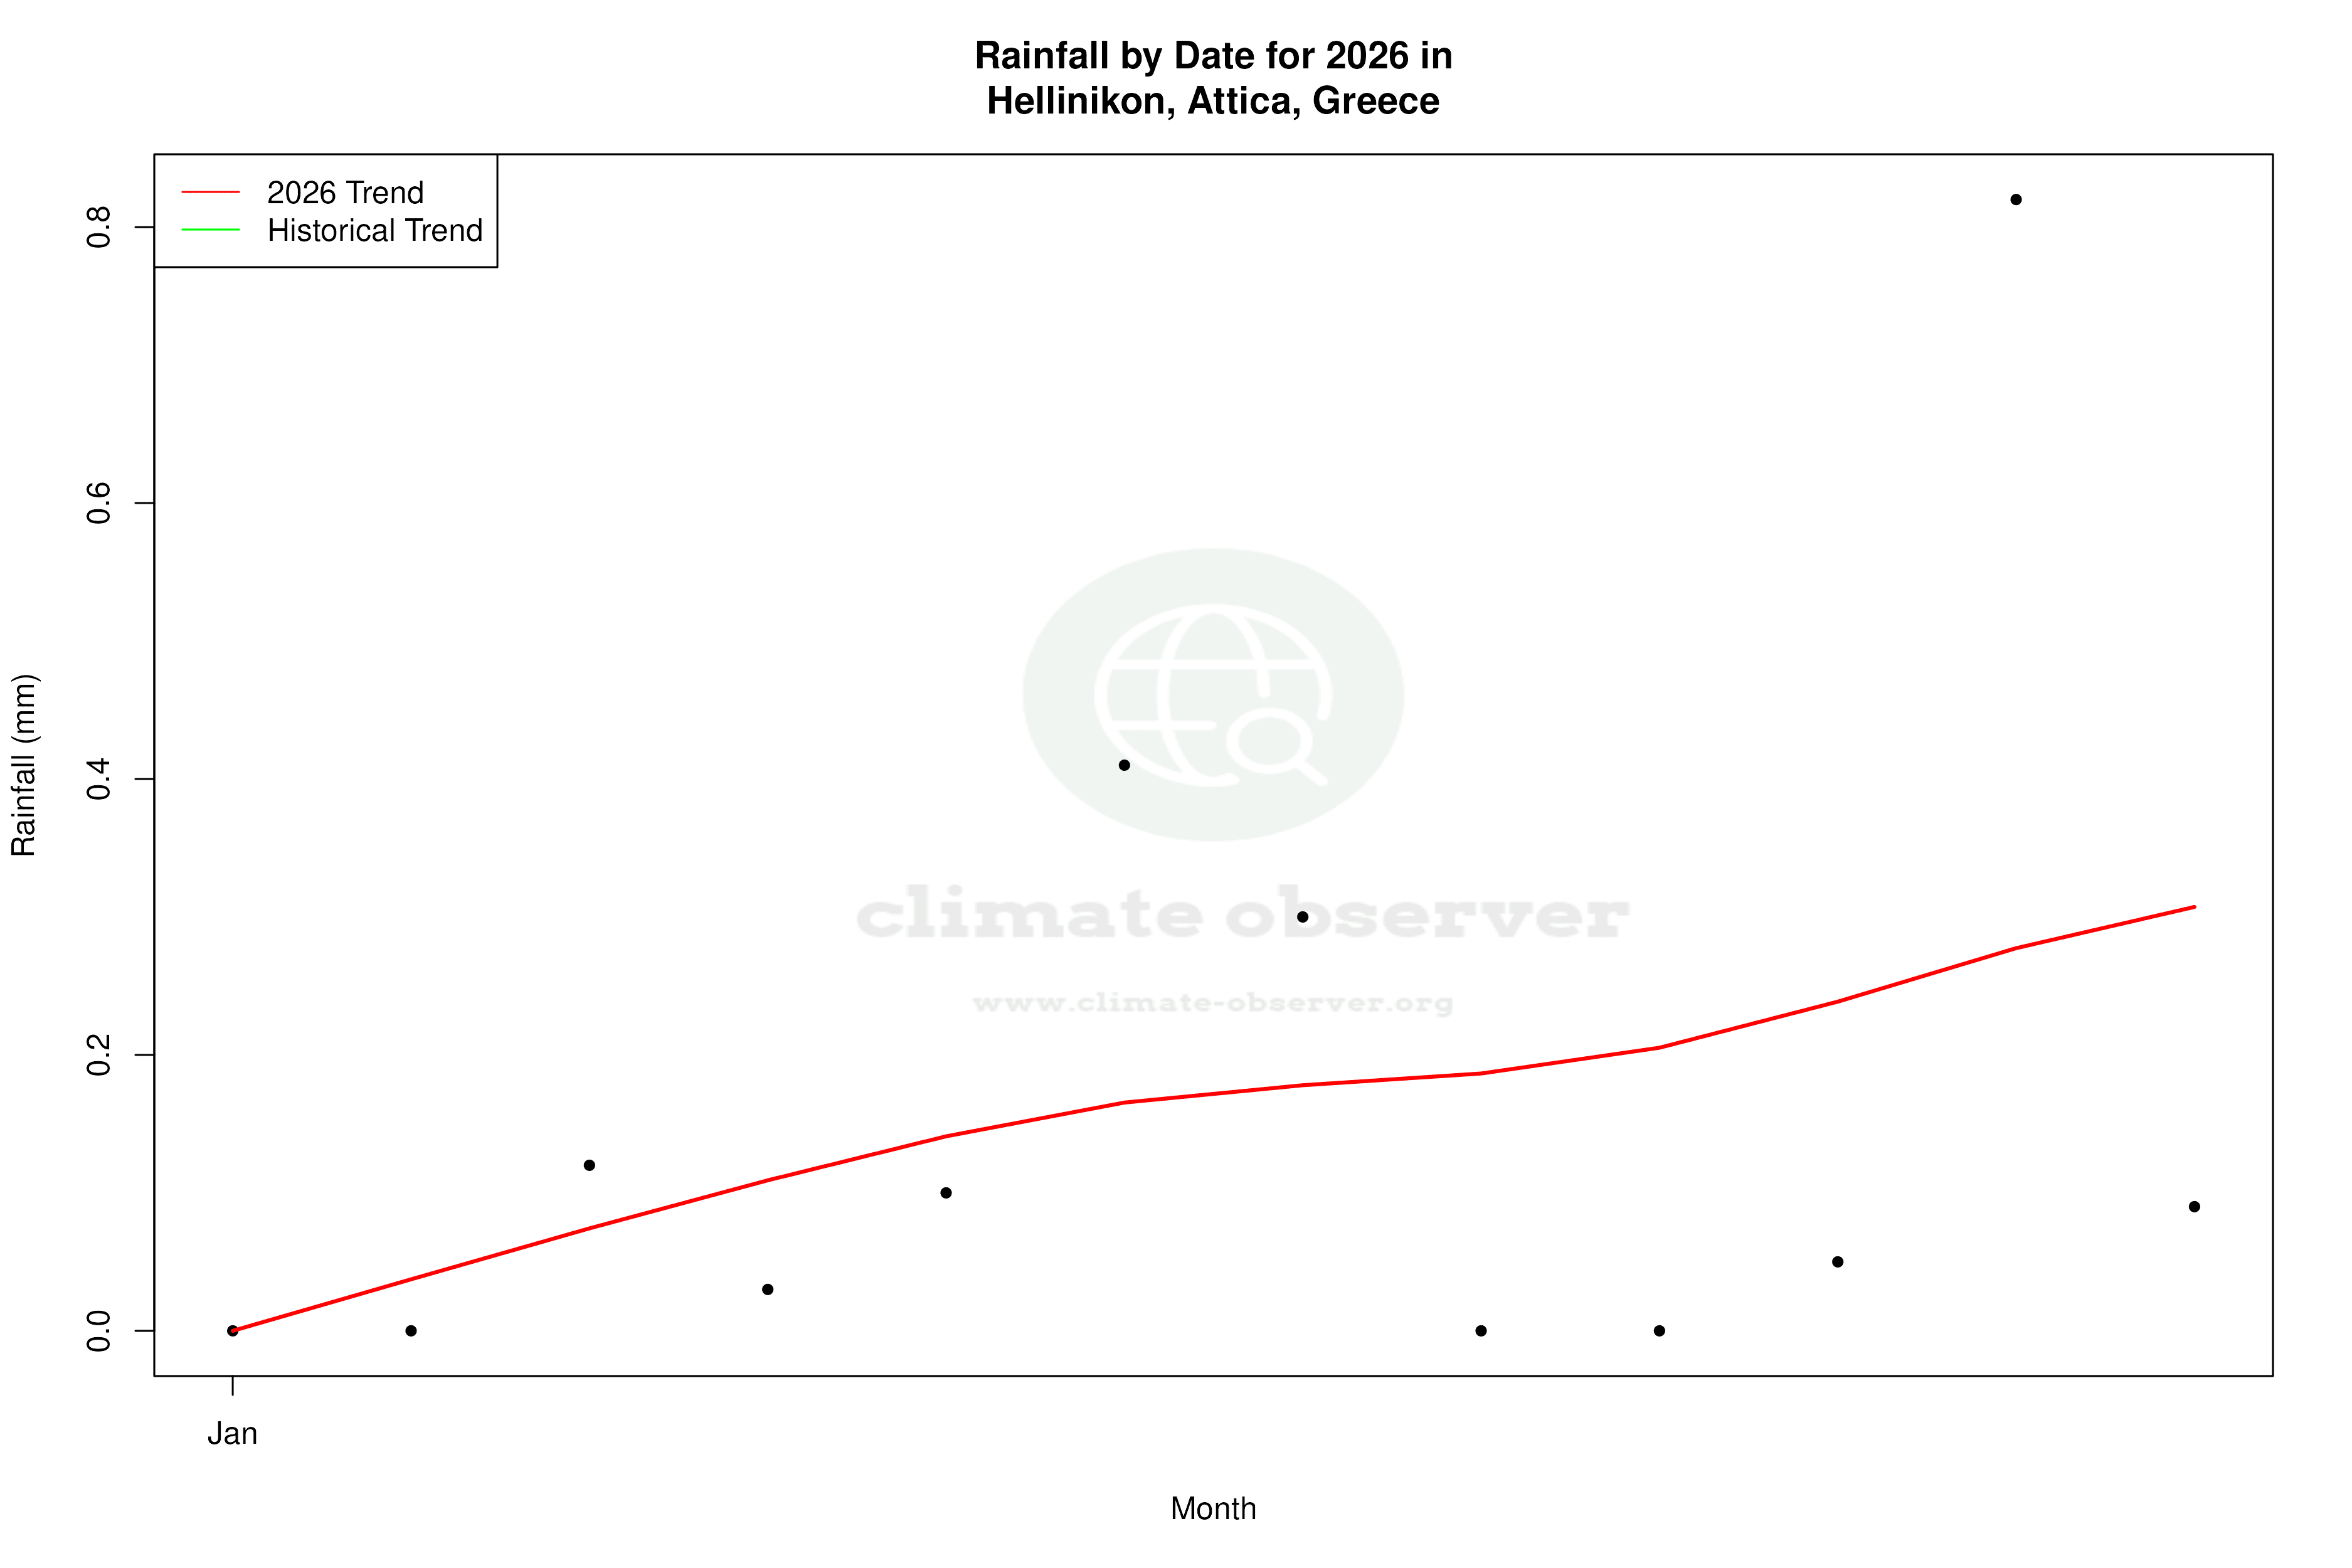
Precipitation Patterns Shift
The Precipitation Concentration Index (PCI) for Hellinikon has decreased from a baseline of 16.6 to a current value of 12.7. This indicates that rainfall is now more evenly distributed throughout the year, reducing the likelihood of intense, concentrated rainfall events that can lead to flooding. A PCI below 10 is considered very even, so the current value suggests a moderate shift towards more regular precipitation patterns. This change could benefit water management and agricultural planning in the region.
Extreme Weather Records
Hellinikon's temperature records highlight the extremes that the area can experience. The highest recorded temperature is 43.0°C (109.4°F), while the lowest is -4.2°C (24.4°F). These extremes underscore the variability inherent in the Mediterranean climate, where summer heatwaves can be intense, and winter cold spells, although rare, can occur.
Climate Goals and Challenges
Greece has been actively pursuing climate goals aimed at reducing carbon emissions and enhancing renewable energy use. The warming trends observed in Hellinikon underscore the urgency of these initiatives. Recent weather events, such as heatwaves and droughts, have highlighted the need for adaptive strategies to mitigate the impacts of climate change on local communities and ecosystems. The data from Hellinikon serves as a microcosm of the broader challenges facing the region as it navigates the complexities of a changing climate.
Station Statistics
10-Year Trend
High: +1.63 °C/decade
Low: +1.81 °C/decade
Rain: -0.23 mm/decade
25-Year Trend
High: +0.91 °C/decade
Low: +0.77 °C/decade
Rain: -0.14 mm/decade
50-Year Trend
High: +0.59 °C/decade
Low: +0.34 °C/decade
Rain: -0.05 mm/decade
All-Time Trend
High: +0.26 °C/decade
Low: +0.12 °C/decade
Rain: -0.02 mm/decade
Percentage Above-Average Days
Last 12 Months: 52.9%
This Year: 62.5%
Precipitation Concentration Index (PCI) ℹ️
Last 12 Months: 18.0
Historical Average: 19.6
Percentile Rank of Last 12 Months ℹ️
High: 98th percentile
Low: 98th percentile
Rain: 7th percentile
Change in Variance ℹ️
High: +9.1%
Low: +2.6%
Intraday: +3.2%
Data Coverage
97.7%
First Year of Data
1955
Station Location
Historical Weather Records
| Max High | Avg High | Min High | Max Avg | Avg Avg | Min Avg | Max Low | Avg Low | Min Low | Max Precipitation | Avg Precipitation | Max Snow | Avg Snow | |
|---|---|---|---|---|---|---|---|---|---|---|---|---|---|
| Record | 43.0 °C | — | -0.2 °C | 36.5 °C | — | -2.0 °C | 32.0 °C | — | -4.2 °C | 91.5 mm | — | — | — |
| January | 22.4 °C | 13.7 °C | 1.0 °C | 19.1 °C | 10.1 °C | -0.9 °C | 17.3 °C | 7.0 °C | -2.9 °C | 66.8 mm | 1.6 mm | — | — |
| February | 24.2 °C | 14.3 °C | -0.2 °C | 18.3 °C | 10.5 °C | -2.0 °C | 16.0 °C | 7.2 °C | -4.2 °C | 54.5 mm | 1.4 mm | — | — |
| March | 27.0 °C | 16.3 °C | 2.0 °C | 21.9 °C | 12.4 °C | 0.6 °C | 18.6 °C | 8.6 °C | -1.8 °C | 91.5 mm | 1.2 mm | — | — |
| April | 32.0 °C | 20.0 °C | 10.2 °C | 26.3 °C | 15.8 °C | 7.1 °C | 20.6 °C | 11.7 °C | 0.6 °C | 68.7 mm | 0.7 mm | — | — |
| May | 37.0 °C | 24.8 °C | 15.4 °C | 28.3 °C | 20.3 °C | 11.2 °C | 23.8 °C | 15.9 °C | 8.0 °C | 25.2 mm | 0.4 mm | — | — |
| June | 42.6 °C | 29.7 °C | 18.6 °C | 34.6 °C | 25.0 °C | 16.2 °C | 29.7 °C | 20.5 °C | 11.5 °C | 22.4 mm | 0.2 mm | — | — |
| July | 42.0 °C | 32.6 °C | 23.0 °C | 36.5 °C | 28.0 °C | 19.2 °C | 31.7 °C | 23.3 °C | 15.5 °C | 35.9 mm | 0.2 mm | — | — |
| August | 43.0 °C | 32.6 °C | 25.0 °C | 34.8 °C | 27.9 °C | 21.4 °C | 32.0 °C | 23.3 °C | 16.0 °C | 70.2 mm | 0.2 mm | — | — |
| September | 39.0 °C | 28.6 °C | 15.2 °C | 31.4 °C | 24.2 °C | 13.1 °C | 26.9 °C | 19.9 °C | 10.4 °C | 40.4 mm | 0.4 mm | — | — |
| October | 34.0 °C | 23.6 °C | 11.2 °C | 28.0 °C | 19.5 °C | 9.1 °C | 24.0 °C | 15.8 °C | 5.4 °C | 80.9 mm | 1.3 mm | — | — |
| November | 28.6 °C | 19.1 °C | 7.4 °C | 22.9 °C | 15.4 °C | 4.4 °C | 20.8 °C | 12.2 °C | 1.4 °C | 77.8 mm | 1.9 mm | — | — |
| December | 22.8 °C | 15.2 °C | 3.8 °C | 20.7 °C | 11.8 °C | 1.8 °C | 18.8 °C | 8.8 °C | -1.8 °C | 59.6 mm | 2.0 mm | — | — |
Data Visualisations
Remove WatermarksCurrent Year Climate Trends vs Historical


Max Temperature this Year | 1 of 6
Climate 12-Month Moving Averages


Max Temperature 12-Month MA | 1 of 6
Daily Data Points and Averages Throughout the Year

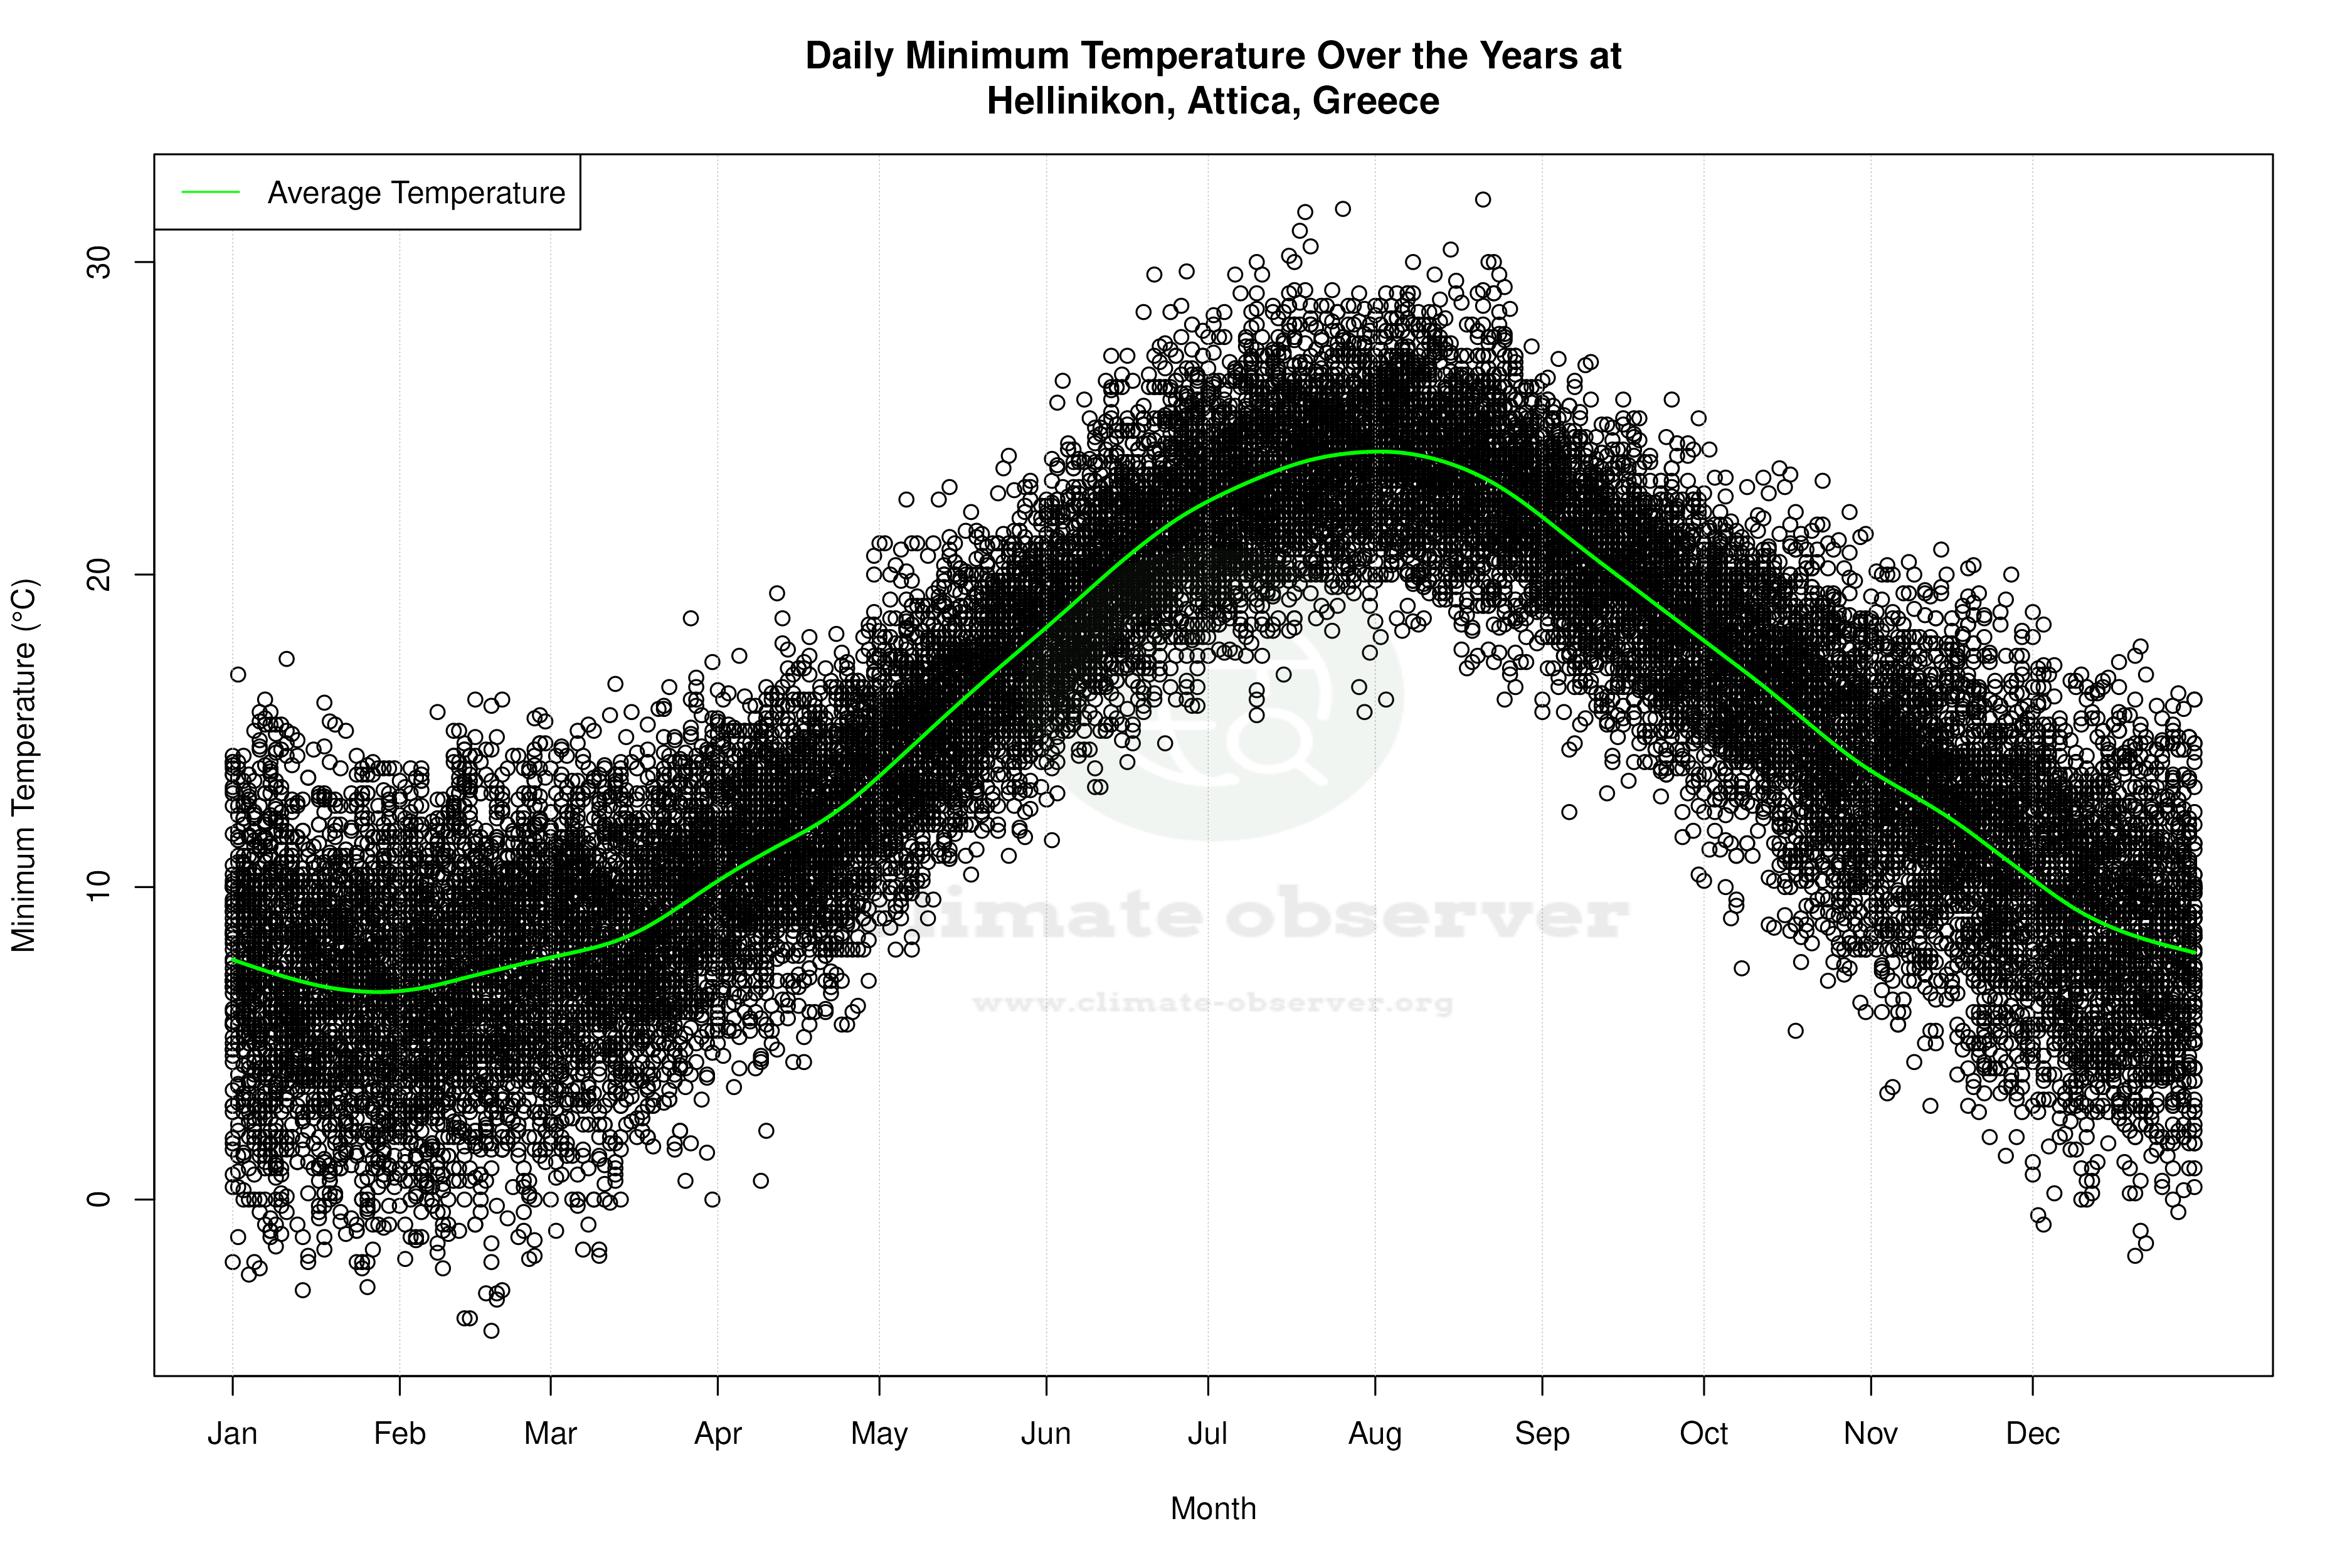


Average Max Temperature Throughout Year | 1 of 5
