Climate for Station: Budapest, Central Hungary, Hungary
Loading live weather...
Climate Analysis & Overview
Budapest's climate is characterised by a warming trend, with significant increases in both high and low temperatures over the past decade. The precipitation pattern has become more evenly distributed, reflecting a shift towards less concentrated rainfall events. These changes align with Hungary's broader climate goals of adapting to and mitigating climate change impacts.
Warming Trends in Budapest
Budapest, located at 47.51°N, 19.02°E, experiences a humid continental climate (Köppen classification Dfb), marked by cold winters and warm summers. Over the past decade, the city has witnessed a notable warming trend, with high temperatures increasing by 0.33°C (0.59°F) and low temperatures by 0.67°C (1.21°F). This trend is more pronounced than the all-time warming trend, where highs have risen by 0.18°C (0.32°F) and lows by 0.20°C (0.36°F). The Danube River, which flows through the city, moderates these temperatures slightly, but the overall warming is consistent with broader regional patterns.
Temperature Extremes and Records
Budapest has recorded extreme temperatures, with a maximum of 40.1°C (104.2°F) and a minimum of -21.8°C (-7.2°F). These records highlight the city's capacity for thermal extremes, which can strain infrastructure and impact public health. The warming trends suggest that such extremes may become more frequent, necessitating adaptive measures in urban planning and public policy.
Shifts in Precipitation Patterns
The Precipitation Concentration Index (PCI) for Budapest has decreased from a baseline of 12.1 to a current value of 9.9, indicating a more even distribution of rainfall throughout the year. This shift suggests a reduction in the intensity of individual rainfall events, which can mitigate flood risks and benefit agricultural practices. However, it also requires adjustments in water management strategies to ensure sufficient water supply during drier periods.
Implications for Regional Climate Goals
Hungary has set ambitious climate goals, focusing on reducing greenhouse gas emissions and enhancing resilience to climate impacts. The warming trends and changes in precipitation patterns observed in Budapest are critical data points for these efforts. The city's adaptation strategies must consider both the increased temperature extremes and the evolving precipitation dynamics to effectively address the challenges posed by climate change.
Station Statistics
10-Year Trend
High: +0.05 °C/decade
Low: +0.47 °C/decade
Rain: -0.38 mm/decade
25-Year Trend
High: +1.03 °C/decade
Low: +0.61 °C/decade
Rain: -0.05 mm/decade
50-Year Trend
High: +0.65 °C/decade
Low: +0.47 °C/decade
Rain: +0.06 mm/decade
All-Time Trend
High: +0.18 °C/decade
Low: +0.20 °C/decade
Rain: -0.01 mm/decade
Percentage Above-Average Days
Last 12 Months: 53.2%
This Year: 58.8%
Precipitation Concentration Index (PCI) ℹ️
Last 12 Months: 10.9
Historical Average: 11.7
Percentile Rank of Last 12 Months ℹ️
High: 90th percentile
Low: 90th percentile
Rain: 9th percentile
Change in Variance ℹ️
High: -4.8%
Low: -1.5%
Intraday: -13.6%
Data Coverage
85.7%
First Year of Data
1901
Station Location
Historical Weather Records
| Max High | Avg High | Min High | Max Avg | Avg Avg | Min Avg | Max Low | Avg Low | Min Low | Max Precipitation | Avg Precipitation | Max Snow | Avg Snow | |
|---|---|---|---|---|---|---|---|---|---|---|---|---|---|
| Record | 40.1 °C | — | -18.1 °C | 32.9 °C | — | -17.3 °C | 26.6 °C | — | -21.8 °C | 93.9 mm | — | — | — |
| January | 18.1 °C | 2.5 °C | -18.1 °C | 11.8 °C | -0.0 °C | -17.3 °C | 11.2 °C | -2.4 °C | -21.7 °C | 33.5 mm | 1.2 mm | — | — |
| February | 20.1 °C | 5.2 °C | -16.6 °C | 14.3 °C | 2.0 °C | -13.3 °C | 12.8 °C | -0.9 °C | -21.8 °C | 40.0 mm | 1.3 mm | — | — |
| March | 25.4 °C | 11.0 °C | -5.2 °C | 17.0 °C | 6.6 °C | -8.3 °C | 14.4 °C | 2.7 °C | -14.1 °C | 37.1 mm | 1.2 mm | — | — |
| April | 31.3 °C | 17.0 °C | 3.2 °C | 22.8 °C | 11.7 °C | 1.3 °C | 18.0 °C | 7.2 °C | -4.6 °C | 44.4 mm | 1.5 mm | — | — |
| May | 34.0 °C | 22.2 °C | 7.6 °C | 26.3 °C | 16.6 °C | 4.1 °C | 21.2 °C | 11.7 °C | 0.0 °C | 93.9 mm | 2.1 mm | — | — |
| June | 39.6 °C | 25.7 °C | 11.9 °C | 32.9 °C | 20.2 °C | 9.9 °C | 26.6 °C | 15.1 °C | 3.0 °C | 78.0 mm | 2.3 mm | — | — |
| July | 40.1 °C | 27.9 °C | 14.1 °C | 32.3 °C | 22.1 °C | 13.3 °C | 26.6 °C | 16.9 °C | 8.9 °C | 64.3 mm | 1.9 mm | — | — |
| August | 39.1 °C | 27.5 °C | 13.4 °C | 30.8 °C | 21.7 °C | 11.4 °C | 26.0 °C | 16.3 °C | 7.0 °C | 71.0 mm | 1.6 mm | — | — |
| September | 35.2 °C | 22.8 °C | 8.6 °C | 25.7 °C | 16.8 °C | 6.6 °C | 24.1 °C | 12.5 °C | 1.2 °C | 62.1 mm | 1.6 mm | — | — |
| October | 30.8 °C | 16.4 °C | 0.5 °C | 20.3 °C | 11.2 °C | -1.4 °C | 18.6 °C | 7.7 °C | -9.5 °C | 46.0 mm | 1.5 mm | — | — |
| November | 22.8 °C | 8.8 °C | -4.6 °C | 16.7 °C | 5.3 °C | -9.6 °C | 15.3 °C | 3.4 °C | -11.9 °C | 41.9 mm | 1.9 mm | — | — |
| December | 19.2 °C | 4.0 °C | -15.5 °C | 13.6 °C | 1.1 °C | -12.6 °C | 10.6 °C | -0.4 °C | -19.1 °C | 37.3 mm | 1.5 mm | — | — |
Data Visualisations
Remove WatermarksCurrent Year Climate Trends vs Historical


Max Temperature this Year | 1 of 6
Climate 12-Month Moving Averages


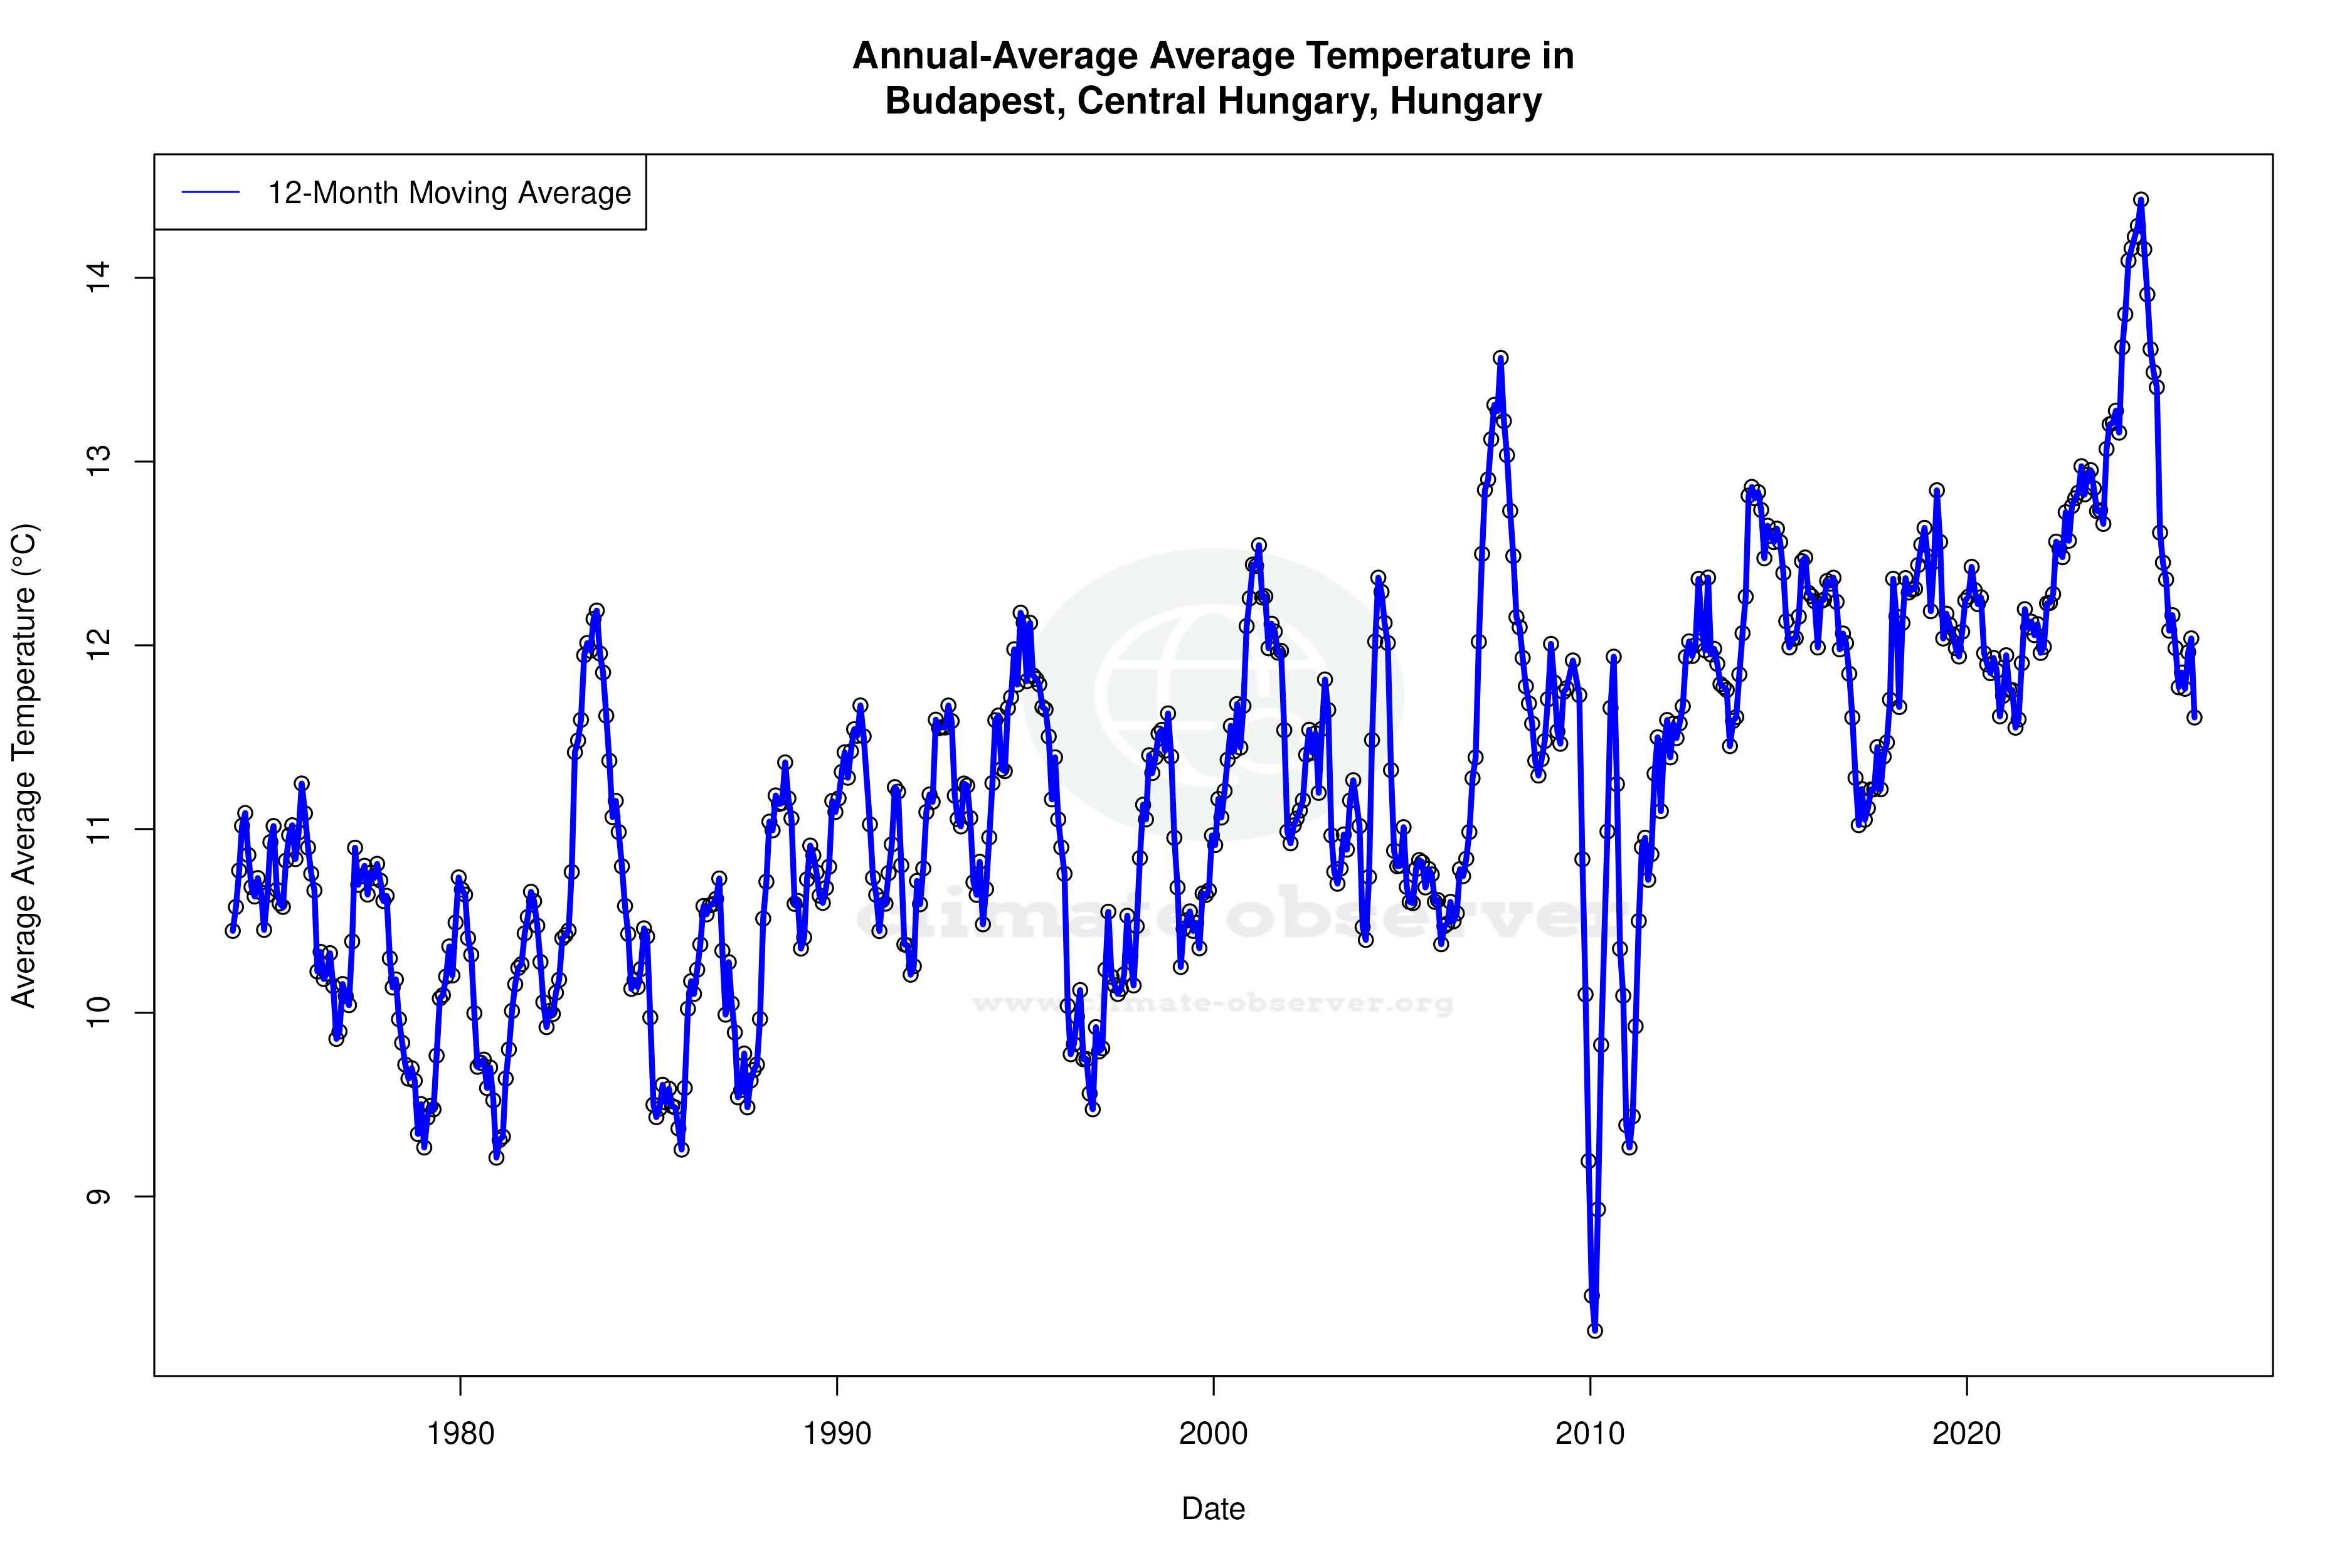


Max Temperature 12-Month MA | 1 of 6
Daily Data Points and Averages Throughout the Year


Average Max Temperature Throughout Year | 1 of 5
