Climate for Station: Szombathely, Western Transdanubia, Hungary
Loading live weather...
Climate Analysis & Overview
Szombathely is experiencing a notable warming trend, with significant increases in both high and low temperatures over the past decade. The precipitation pattern has become more evenly distributed, suggesting changes in local weather dynamics. These shifts are occurring within the context of Hungary's broader climate goals of reducing greenhouse gas emissions and adapting to climate change impacts.
Continental Climate Dynamics
Szombathely, situated in the western part of Hungary, exhibits a humid continental climate (Köppen classification Dfb), characterised by cold winters and warm summers. The city's climate is influenced by its proximity to the Alps, which moderates temperatures and affects precipitation patterns. Over the past ten years, Szombathely has experienced a warming trend with high temperatures increasing by 1.18°C (2.12°F) and low temperatures by 0.70°C (1.26°F). These recent trends are more pronounced than the all-time trends, which show a rise of 0.19°C (0.34°F) for highs and 0.11°C (0.20°F) for lows, indicating an acceleration in warming.
Temperature Extremes and Records
Temperature extremes in Szombathely have been notable, with the highest recorded temperature reaching 39.7°C (103.5°F), while the lowest plummeted to -24.0°C (-11.2°F). These records highlight the city's capacity for significant thermal variation, a characteristic of continental climates. The increasing trend in temperatures suggests that such extremes may become more frequent or intense, aligning with Hungary's need to adapt to changing climate conditions.
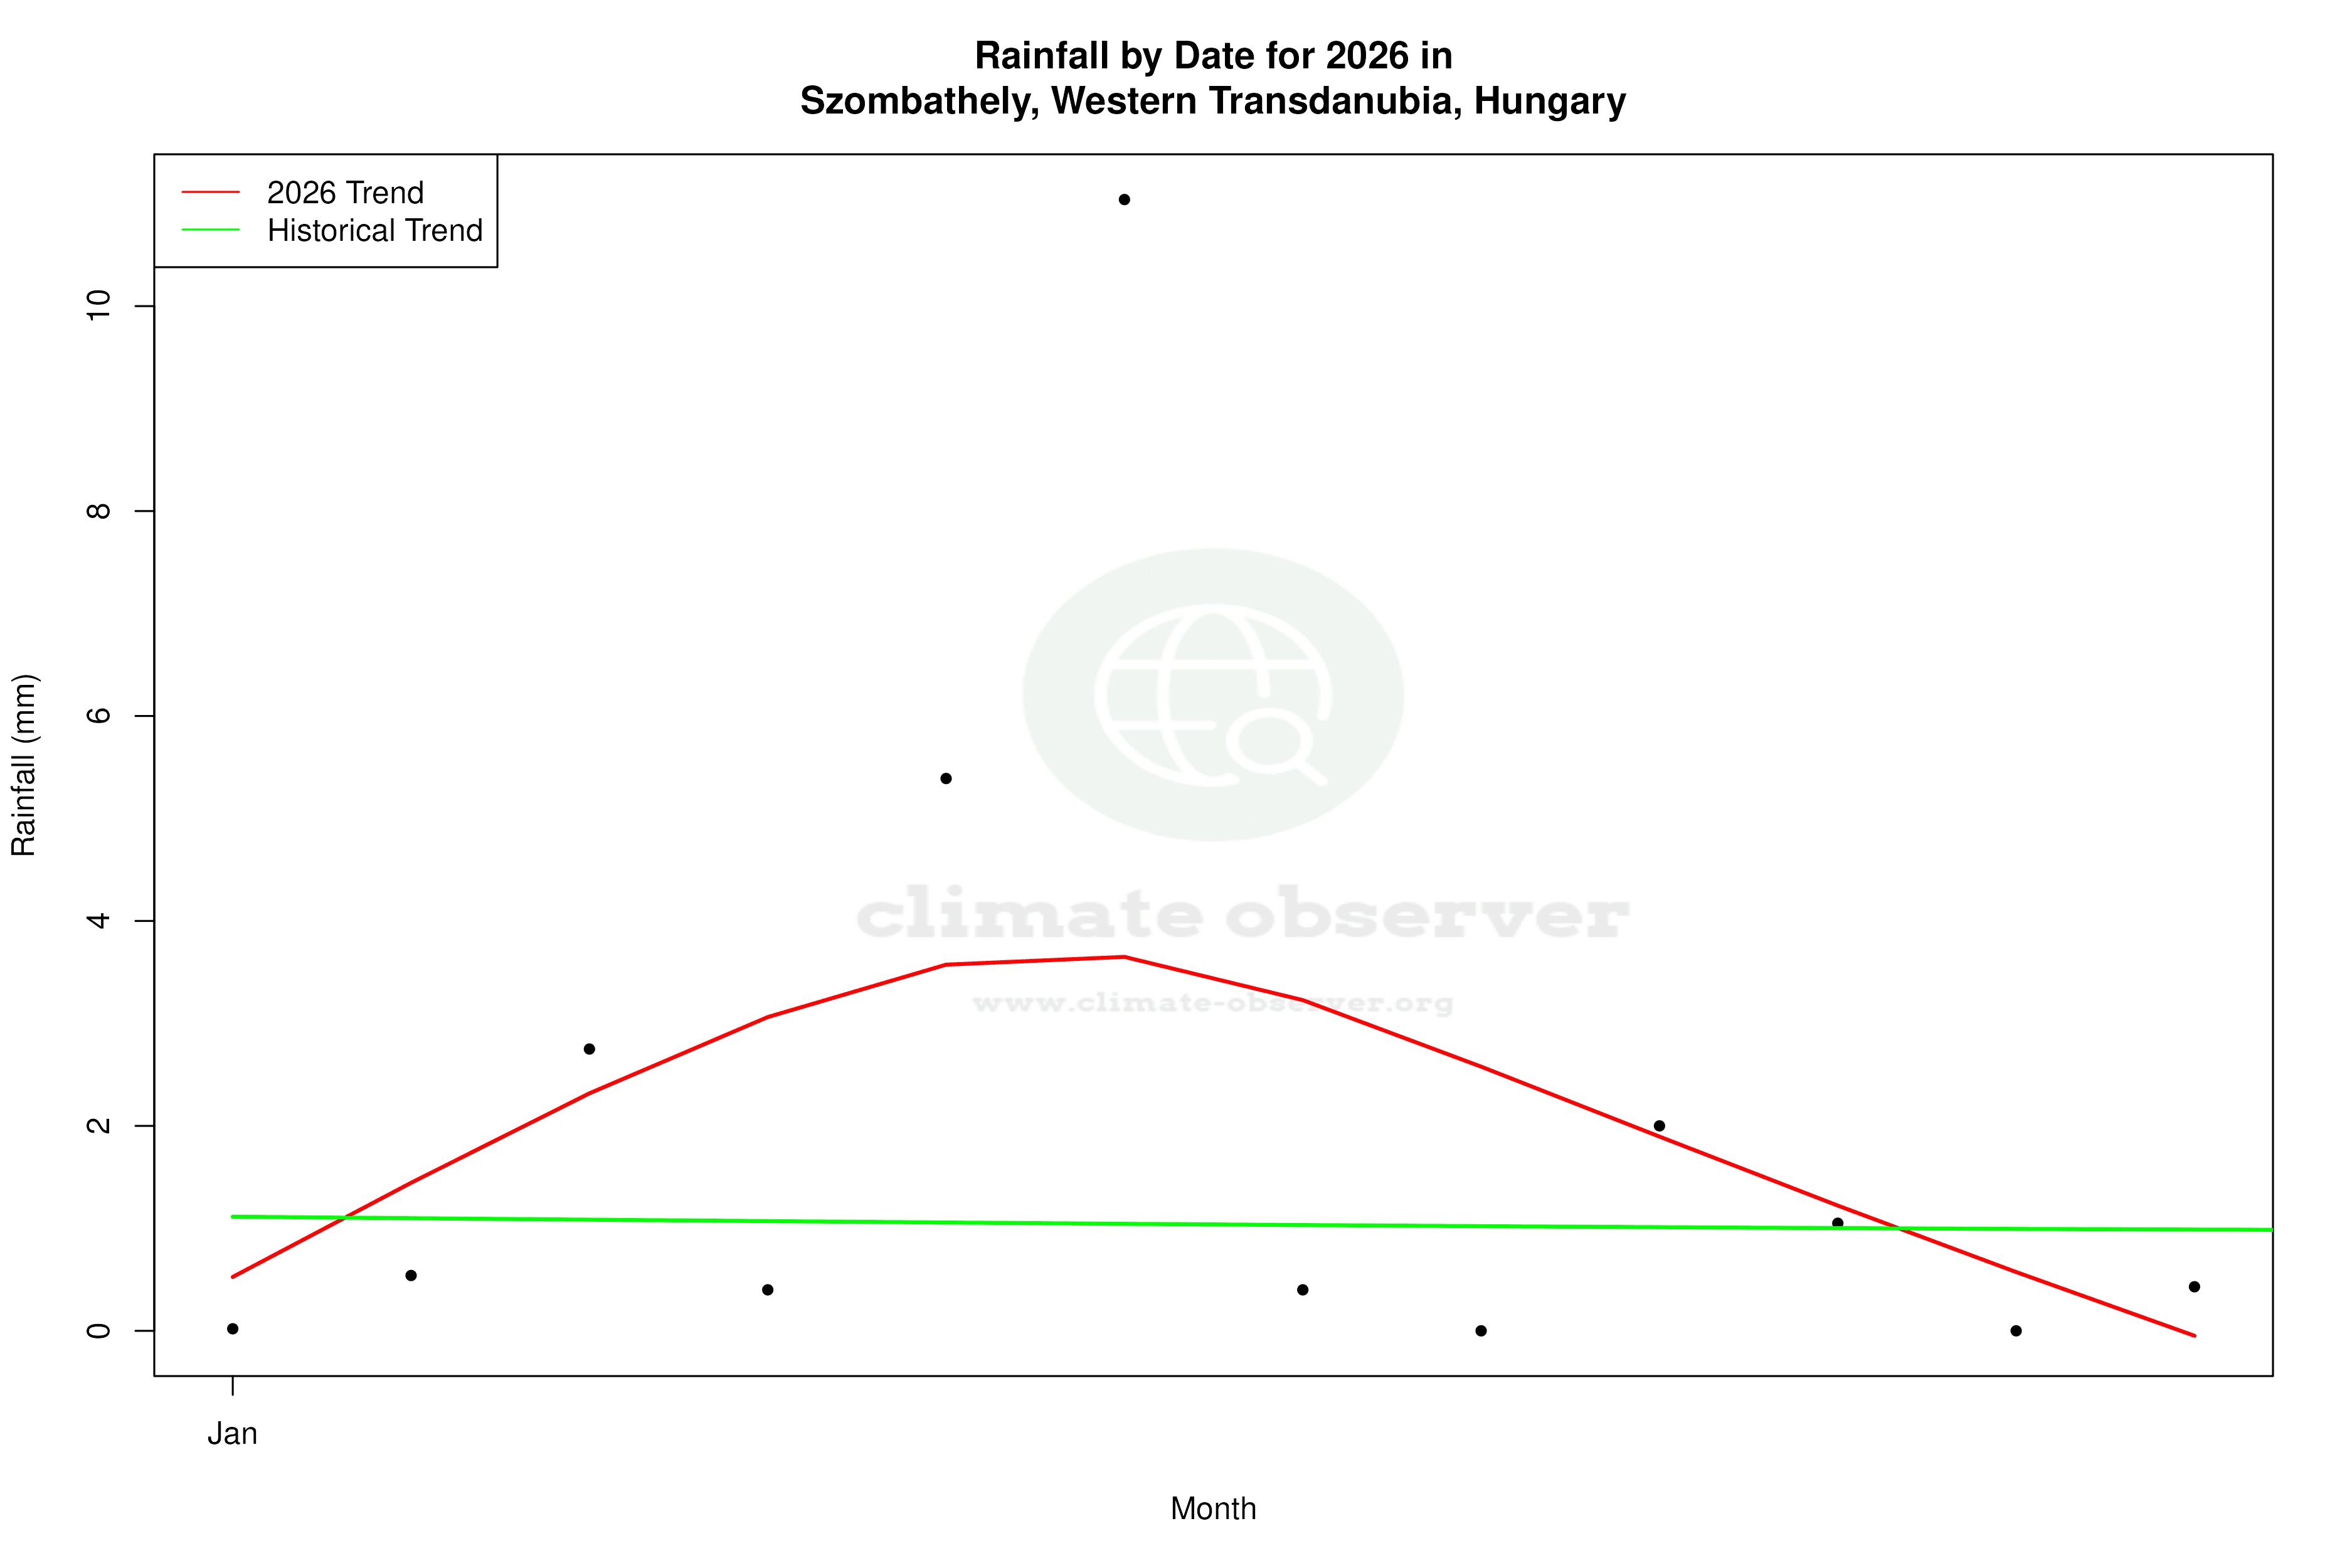
Precipitation Patterns and Distribution
The Precipitation Concentration Index (PCI) for Szombathely has decreased from a baseline of 11.9 to a current value of 8.9, indicating a more even distribution of rainfall throughout the year. This shift suggests a reduction in the concentration of rainfall events, which could lead to fewer instances of intense precipitation and related flooding. This change is significant for local agriculture and water management, aligning with regional efforts to mitigate the impacts of climate change.
Regional Climate Goals and Adaptation
Hungary is committed to reducing its carbon footprint and enhancing resilience to climate change. Szombathely's evolving climate patterns, including the warming trend and changes in precipitation distribution, reflect broader regional challenges and opportunities. These shifts necessitate adaptive strategies in urban planning, agriculture, and infrastructure to ensure sustainability and resilience in the face of ongoing climate change.
Implications for Future Climate Scenarios
As Szombathely continues to warm, the city may face increased pressure on its natural and built environments. The observed trends underscore the importance of integrating climate considerations into policy and planning. The more even distribution of precipitation could mitigate some risks associated with extreme weather, but the overall warming trend poses challenges that require proactive management and adaptation strategies.
Station Statistics
10-Year Trend
High: +1.07 °C/decade
Low: +0.83 °C/decade
Rain: -0.19 mm/decade
25-Year Trend
High: +0.73 °C/decade
Low: +0.66 °C/decade
Rain: +0.10 mm/decade
50-Year Trend
High: +0.57 °C/decade
Low: +0.48 °C/decade
Rain: +0.03 mm/decade
All-Time Trend
High: +0.19 °C/decade
Low: +0.12 °C/decade
Rain: -0.00 mm/decade
Percentage Above-Average Days
Last 12 Months: 55.1%
This Year: 27.5%
Precipitation Concentration Index (PCI) ℹ️
Last 12 Months: 9.9
Historical Average: 12.0
Percentile Rank of Last 12 Months ℹ️
High: 95th percentile
Low: 96th percentile
Rain: 18th percentile
Change in Variance ℹ️
High: -3.8%
Low: -6.6%
Intraday: +11.6%
Data Coverage
84.0%
First Year of Data
1959
Station Location
Historical Weather Records
| Max High | Avg High | Min High | Max Avg | Avg Avg | Min Avg | Max Low | Avg Low | Min Low | Max Precipitation | Avg Precipitation | Max Snow | Avg Snow | |
|---|---|---|---|---|---|---|---|---|---|---|---|---|---|
| Record | 39.7 °C | — | -16.2 °C | 30.3 °C | — | -19.1 °C | 24.6 °C | — | -27.1 °C | 74.2 mm | — | — | — |
| January | 17.3 °C | 2.1 °C | -14.0 °C | 11.7 °C | -0.8 °C | -19.1 °C | 7.7 °C | -4.3 °C | -24.0 °C | 27.0 mm | 1.0 mm | — | — |
| February | 22.6 °C | 4.9 °C | -16.2 °C | 12.8 °C | 1.1 °C | -16.1 °C | 11.0 °C | -3.1 °C | -27.1 °C | 29.2 mm | 1.1 mm | — | — |
| March | 26.1 °C | 10.3 °C | -7.4 °C | 16.5 °C | 5.5 °C | -11.0 °C | 12.9 °C | 0.3 °C | -19.3 °C | 30.5 mm | 1.2 mm | — | — |
| April | 29.6 °C | 15.7 °C | 1.0 °C | 20.1 °C | 10.5 °C | -0.6 °C | 15.4 °C | 4.4 °C | -6.3 °C | 39.7 mm | 1.5 mm | — | — |
| May | 32.9 °C | 20.5 °C | 6.9 °C | 24.6 °C | 15.4 °C | 5.2 °C | 18.8 °C | 8.8 °C | -3.5 °C | 52.3 mm | 2.2 mm | — | — |
| June | 36.8 °C | 24.1 °C | 11.3 °C | 29.2 °C | 19.4 °C | 9.7 °C | 21.9 °C | 12.2 °C | 1.3 °C | 69.0 mm | 2.5 mm | — | — |
| July | 39.4 °C | 26.3 °C | 12.1 °C | 30.3 °C | 21.6 °C | 13.8 °C | 24.6 °C | 13.9 °C | 5.2 °C | 71.0 mm | 2.6 mm | — | — |
| August | 39.7 °C | 25.7 °C | 13.0 °C | 30.2 °C | 21.2 °C | 10.8 °C | 22.4 °C | 13.6 °C | 5.3 °C | 74.2 mm | 2.4 mm | — | — |
| September | 34.2 °C | 21.2 °C | 8.0 °C | 26.2 °C | 16.3 °C | 7.5 °C | 21.1 °C | 10.0 °C | -1.6 °C | 62.1 mm | 2.1 mm | — | — |
| October | 27.9 °C | 15.2 °C | -1.5 °C | 20.1 °C | 10.6 °C | -1.2 °C | 16.9 °C | 5.4 °C | -11.7 °C | 49.7 mm | 1.7 mm | — | — |
| November | 23.5 °C | 8.1 °C | -6.0 °C | 16.7 °C | 4.7 °C | -11.6 °C | 13.7 °C | 1.4 °C | -14.9 °C | 46.7 mm | 1.7 mm | — | — |
| December | 19.9 °C | 3.4 °C | -12.0 °C | 12.9 °C | 0.4 °C | -18.4 °C | 10.8 °C | -2.2 °C | -20.0 °C | 30.4 mm | 1.3 mm | — | — |
Data Visualisations
Remove WatermarksCurrent Year Climate Trends vs Historical


Max Temperature this Year | 1 of 6
Climate 12-Month Moving Averages


Max Temperature 12-Month MA | 1 of 6
Daily Data Points and Averages Throughout the Year


Average Max Temperature Throughout Year | 1 of 5
