Climate for Station: Reykjavik, Capital Region, Iceland
Loading live weather...
Climate Analysis & Overview
Reykjavik's climate profile reveals a nuanced thermal narrative, with a slight long-term warming trend contrasted by recent cooling. The precipitation pattern has become more evenly distributed, suggesting a shift in weather dynamics. These trends align with Iceland's broader climate goals of understanding and adapting to changing conditions.
A Tale of Two Temperature Trends
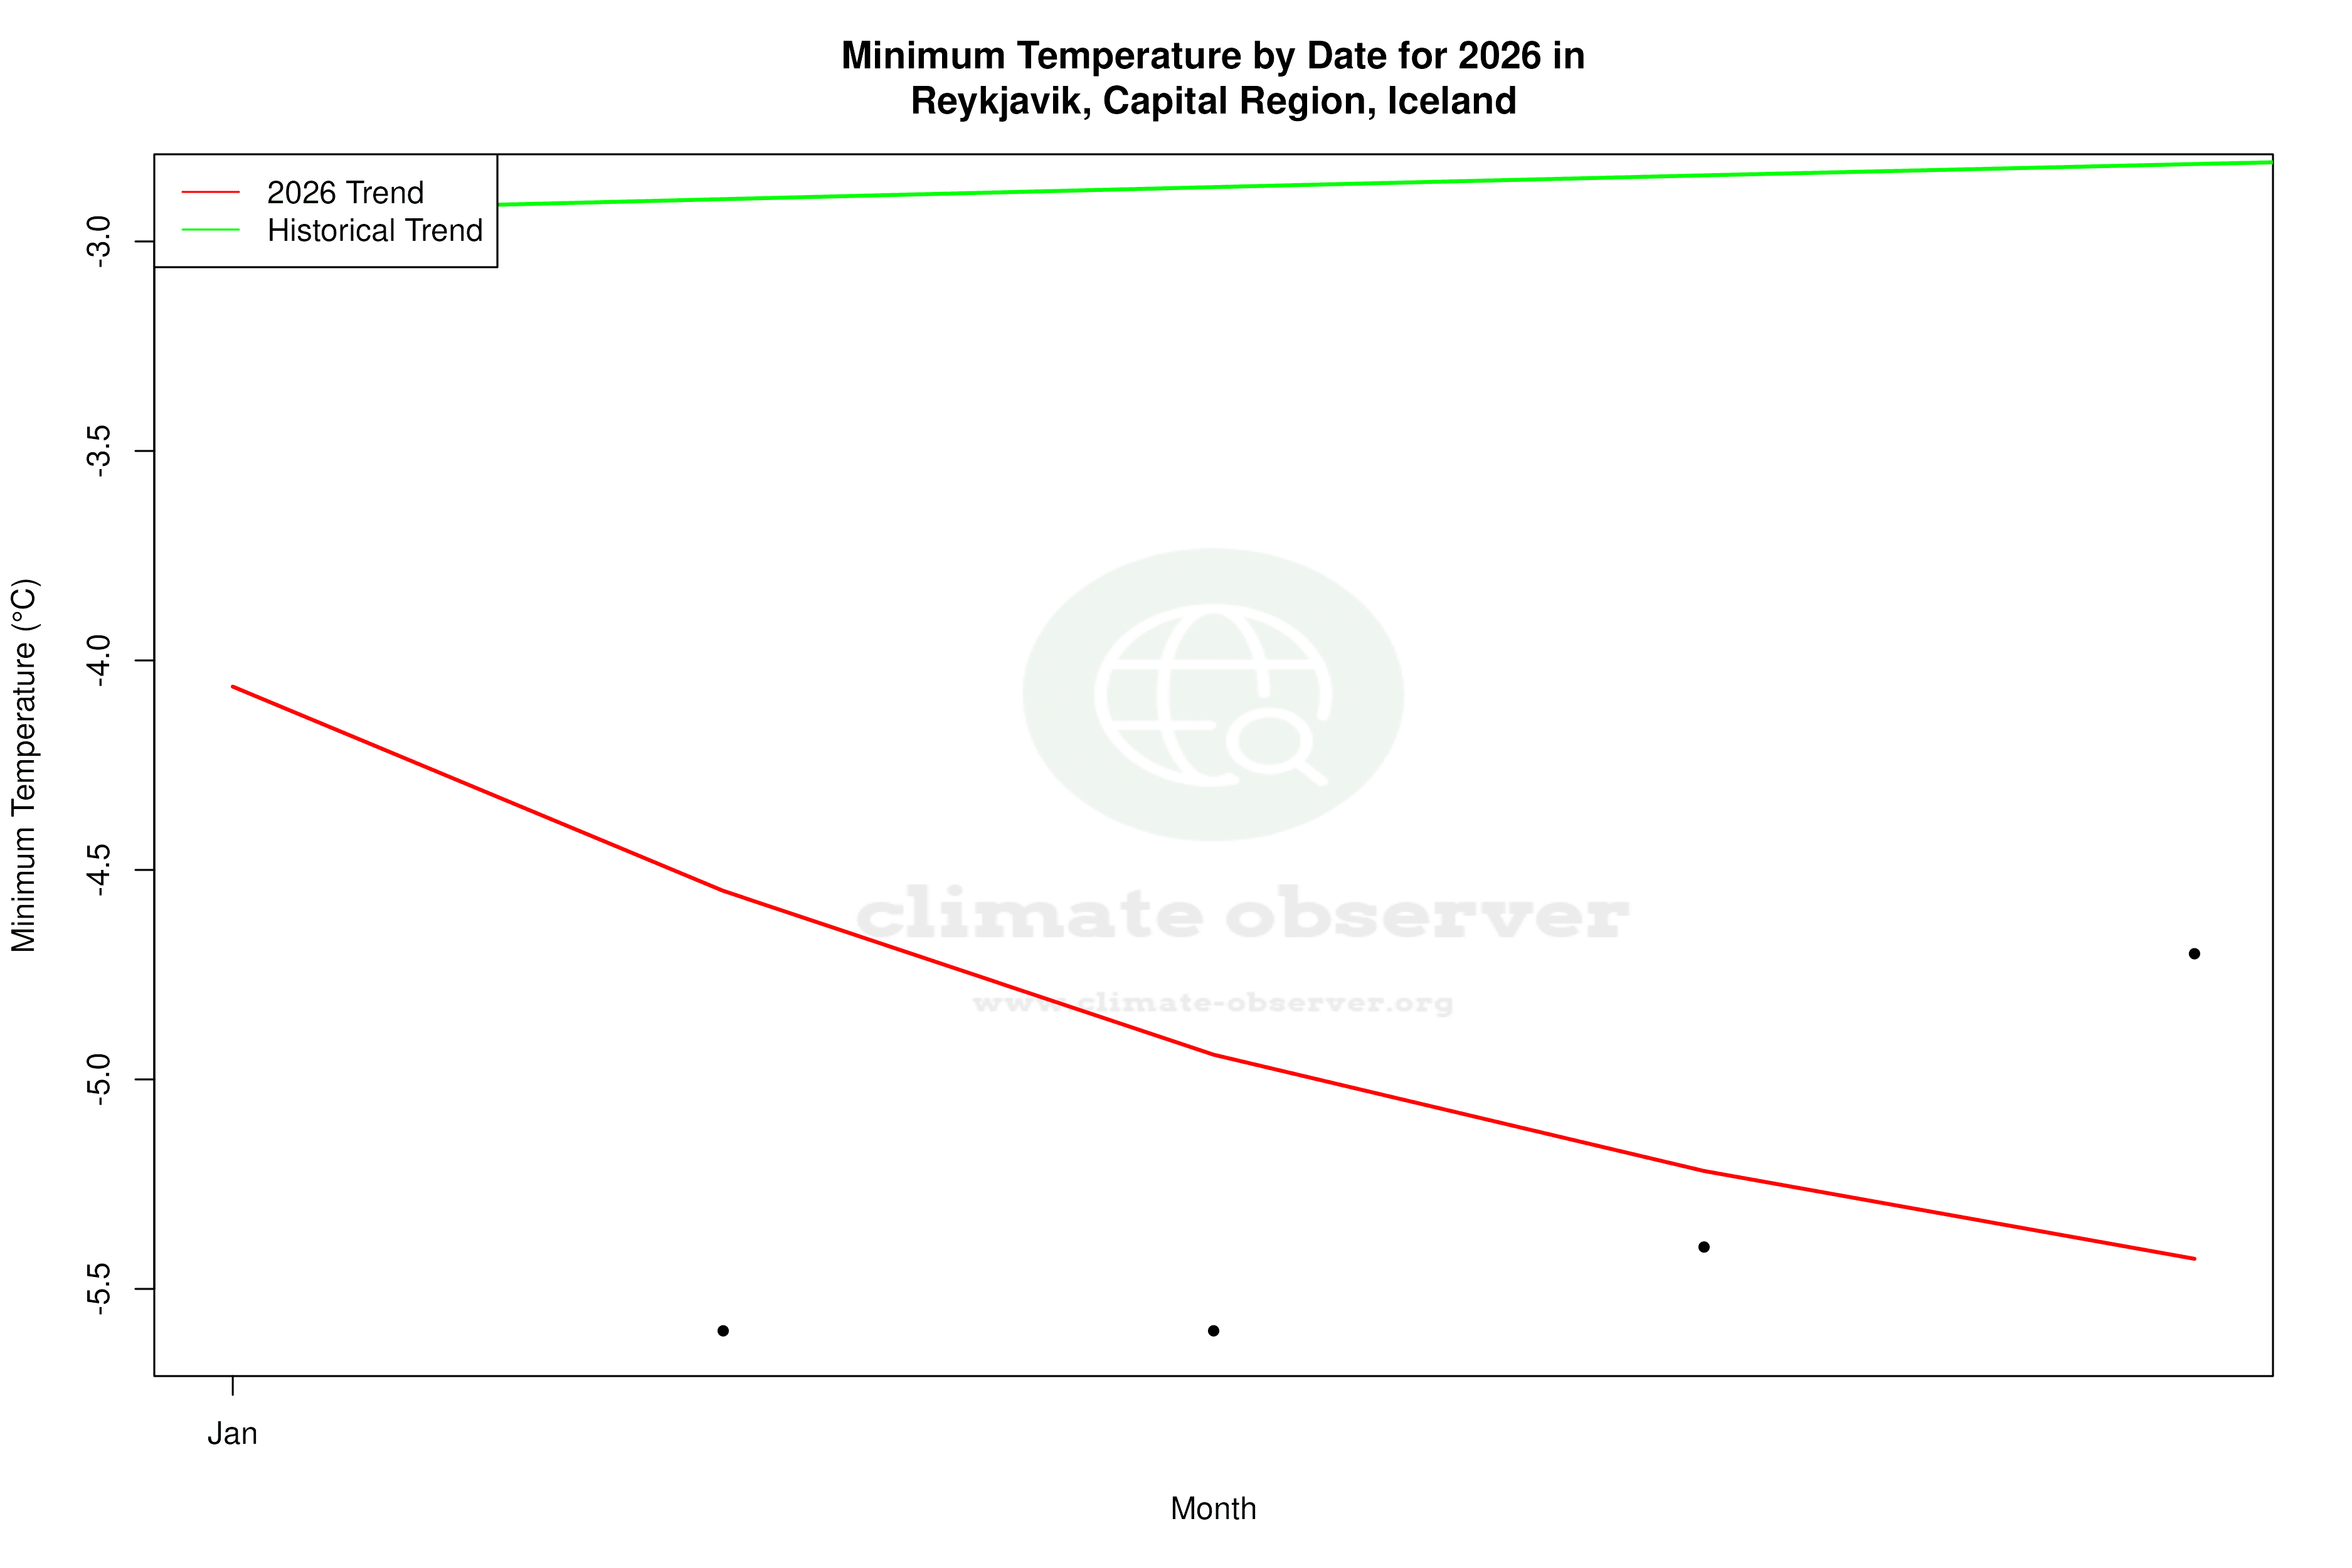
Reykjavik, located at 64.1269°N, -21.9025°W, experiences a subpolar oceanic climate, classified as Cfc in the Köppen system. This classification is characterised by cool summers and mild winters, heavily influenced by the North Atlantic Ocean. Over the long term, Reykjavik has seen a slight warming, with all-time high temperatures rising by 0.16°C (0.29°F) and lows by 0.10°C (0.18°F). However, the past decade tells a different story, with a cooling trend observed in both highs and lows. Highs have decreased by 0.56°C (1.01°F) and lows by 0.78°C (1.40°F). This recent cooling could be attributed to regional climatic shifts and oceanic currents, which are crucial in shaping Reykjavik's weather patterns.
Precipitation Patterns: A More Even Distribution
The Precipitation Concentration Index (PCI) is a measure of how precipitation is distributed over time. Reykjavik's PCI has decreased from a baseline of 10.69 to a current value of 9.63, indicating a more even distribution of rainfall events. This change suggests that precipitation is now spread more consistently throughout the year, rather than being concentrated in fewer, more intense events. Such a shift could have implications for water management and flood risk, aligning with Iceland's efforts to adapt to evolving precipitation patterns.
Record Extremes: A Snapshot of Variability
Reykjavik's climate extremes provide a snapshot of its variability. The record high temperature stands at 24.3°C (75.7°F), while the record low is -19.7°C (-3.5°F). These extremes underscore the city's capacity for significant thermal variation, despite its generally moderate climate. Such variability is typical for coastal regions at high latitudes, where oceanic influences can lead to rapid weather changes.
Geographic Influences on Climate Dynamics
Reykjavik's geographic position on the southwest coast of Iceland means it is subject to the moderating effects of the North Atlantic Ocean. The city's proximity to the ocean helps to stabilise temperatures, preventing the extremes often seen in continental climates. Additionally, the surrounding mountains and volcanic landscapes can influence local weather patterns, contributing to the variability observed in both temperature and precipitation.
Aligning with Iceland's Climate Goals
Iceland is committed to understanding and mitigating the impacts of climate change, with a focus on reducing greenhouse gas emissions and enhancing resilience to climate variability. Reykjavik's climate data provides valuable insights into these efforts, highlighting both the challenges and opportunities presented by changing weather patterns. As Iceland continues to pursue its climate objectives, understanding localised trends in places like Reykjavik will be crucial for informed decision-making and sustainable development.
Station Statistics
10-Year Trend
High: -0.76 °C/decade
Low: -0.70 °C/decade
Rain: +0.09 mm/decade
25-Year Trend
High: -0.10 °C/decade
Low: -0.25 °C/decade
Rain: +0.95 mm/decade
50-Year Trend
High: +0.46 °C/decade
Low: +0.30 °C/decade
Rain: +0.39 mm/decade
All-Time Trend
High: +0.16 °C/decade
Low: +0.10 °C/decade
Rain: +0.20 mm/decade
Percentage Above-Average Days
Last 12 Months: 47.7%
This Year: 32.1%
Precipitation Concentration Index (PCI) ℹ️
Last 12 Months: 9.4
Historical Average: 10.3
Percentile Rank of Last 12 Months ℹ️
High: 88th percentile
Low: 89th percentile
Rain: 91st percentile
Change in Variance ℹ️
High: -3.5%
Low: -3.9%
Intraday: +12.0%
Data Coverage
89.2%
First Year of Data
1941
Station Location
Historical Weather Records
| Max High | Avg High | Min High | Max Avg | Avg Avg | Min Avg | Max Low | Avg Low | Min Low | Max Precipitation | Avg Precipitation | Max Snow | Avg Snow | |
|---|---|---|---|---|---|---|---|---|---|---|---|---|---|
| Record | 24.3 °C | — | -12.7 °C | 18.9 °C | — | -13.5 °C | 18.2 °C | — | -19.7 °C | 54.6 mm | — | — | — |
| January | 10.7 °C | 2.4 °C | -11.5 °C | 9.0 °C | -0.1 °C | -12.9 °C | 8.7 °C | -2.7 °C | -19.7 °C | 42.3 mm | 2.9 mm | — | — |
| February | 10.2 °C | 3.0 °C | -11.9 °C | 9.1 °C | 0.5 °C | -10.9 °C | 8.0 °C | -2.1 °C | -17.6 °C | 41.8 mm | 3.1 mm | — | — |
| March | 13.0 °C | 3.8 °C | -10.0 °C | 9.4 °C | 1.0 °C | -11.9 °C | 8.4 °C | -1.5 °C | -16.4 °C | 36.8 mm | 2.8 mm | — | — |
| April | 17.1 °C | 6.3 °C | -8.6 °C | 11.9 °C | 3.4 °C | -10.0 °C | 9.3 °C | 0.8 °C | -16.4 °C | 52.1 mm | 2.2 mm | — | — |
| May | 21.0 °C | 9.7 °C | -2.6 °C | 15.8 °C | 6.6 °C | -4.9 °C | 11.4 °C | 3.8 °C | -7.7 °C | 38.8 mm | 1.8 mm | — | — |
| June | 22.4 °C | 12.3 °C | 6.0 °C | 16.4 °C | 9.5 °C | 2.0 °C | 13.0 °C | 6.9 °C | -0.7 °C | 31.1 mm | 1.7 mm | — | — |
| July | 24.3 °C | 14.1 °C | 8.2 °C | 18.9 °C | 11.3 °C | 5.9 °C | 18.2 °C | 8.8 °C | 1.4 °C | 39.0 mm | 1.8 mm | — | — |
| August | 23.5 °C | 13.7 °C | 7.4 °C | 17.4 °C | 10.9 °C | 5.1 °C | 15.4 °C | 8.2 °C | -0.4 °C | 42.4 mm | 2.2 mm | — | — |
| September | 18.5 °C | 10.9 °C | 1.4 °C | 15.1 °C | 8.2 °C | 0.3 °C | 13.5 °C | 5.8 °C | -4.4 °C | 52.7 mm | 2.7 mm | — | — |
| October | 15.7 °C | 7.3 °C | -4.0 °C | 12.3 °C | 4.8 °C | -5.2 °C | 12.1 °C | 2.4 °C | -10.6 °C | 49.2 mm | 3.0 mm | — | — |
| November | 13.0 °C | 4.3 °C | -8.6 °C | 10.7 °C | 2.2 °C | -10.7 °C | 9.5 °C | -0.4 °C | -15.1 °C | 44.7 mm | 2.8 mm | — | — |
| December | 12.0 °C | 2.8 °C | -12.7 °C | 10.1 °C | 0.4 °C | -13.5 °C | 8.6 °C | -2.3 °C | -16.8 °C | 54.6 mm | 2.9 mm | — | — |
Data Visualisations
Remove WatermarksCurrent Year Climate Trends vs Historical


Max Temperature this Year | 1 of 6
Climate 12-Month Moving Averages


Max Temperature 12-Month MA | 1 of 6
Daily Data Points and Averages Throughout the Year


Average Max Temperature Throughout Year | 1 of 5
