Climate for Station: Sibolga/Pinangsori, North Sumatra, Indonesia
Loading live weather...
Climate Analysis & Overview
Sibolga/Pinangsori in Sumatera, Indonesia, is experiencing a nuanced climate evolution with a warming trend in daytime highs over the long term and a cooling trend in nighttime lows. Precipitation is becoming more evenly distributed, potentially altering local agricultural patterns and water resource management.
Tropical Climate Dynamics
Sibolga/Pinangsori is characterised by a tropical rainforest climate, classified as Af under the Köppen system. This region, nestled on the western coast of Sumatera, is influenced by its proximity to the Indian Ocean and the surrounding mountainous terrain. These geographical features contribute to a typically warm and humid climate, with significant rainfall throughout the year.
Temperature Trends: A Tale of Two Extremes
Over the long term, the region has experienced a warming in daytime highs, with an all-time trend showing an increase of 0.69°C (1.24°F). This warming could be attributed to broader regional climate changes and increased urbanisation. In contrast, nighttime lows have shown a cooling trend, with a decrease of 0.50°C (0.90°F) over the same period. This divergence in temperature trends suggests a complex interaction of local and global climatic factors.
Short-term data over the past decade reveals a consistent warming trend for both highs and lows, with increases of 0.59°C (1.06°F) and 0.65°C (1.17°F), respectively. This recent warming aligns with global patterns of rising temperatures, potentially impacting local ecosystems and human activities.
Precipitation Patterns: Even Distribution
The Precipitation Concentration Index (PCI), a measure of how rainfall is distributed throughout the year, has decreased from a baseline of 10.66 to a current value of 9.27. This change indicates a more even distribution of precipitation events, which could mitigate the risk of flooding and enhance agricultural productivity by providing more consistent water supply. A PCI below 10 suggests a stable and evenly distributed rainfall pattern, beneficial for the region's agriculture and water management strategies.
Record Extremes: A Climate Snapshot
The region's climate extremes are marked by a record high of 38.6°C (101.5°F) and a record low of 16.5°C (61.7°F). These records highlight the potential for significant temperature variability, which could challenge local infrastructure and health systems. Understanding these extremes is crucial for developing adaptive strategies to cope with potential heatwaves or cold spells.
Regional Implications and Future Outlook
Indonesia's commitment to reducing greenhouse gas emissions and enhancing climate resilience is a critical backdrop for understanding Sibolga/Pinangsori's climate trends. As the nation works towards its climate goals, local adaptations in response to these nuanced temperature and precipitation changes will be essential for sustaining the region's ecological and economic vitality.
Station Statistics
10-Year Trend
High: +0.24 °C/decade
Low: +0.88 °C/decade
Rain: -5.49 mm/decade
25-Year Trend
High: +0.25 °C/decade
Low: +0.18 °C/decade
Rain: -0.21 mm/decade
50-Year Trend
High: +0.66 °C/decade
Low: -0.49 °C/decade
Rain: +0.73 mm/decade
All-Time Trend
High: +0.66 °C/decade
Low: -0.49 °C/decade
Rain: +0.73 mm/decade
Percentage Above-Average Days
Last 12 Months: 21.4%
This Year: 5.3%
Precipitation Concentration Index (PCI) ℹ️
Last 12 Months: 12.7
Historical Average: 10.3
Percentile Rank of Last 12 Months ℹ️
High: 55th percentile
Low: 55th percentile
Rain: 38th percentile
Change in Variance ℹ️
High: -27.3%
Low: -40.8%
Intraday: -38.3%
Data Coverage
74.1%
First Year of Data
1959
Station Location
Historical Weather Records
| Max High | Avg High | Min High | Max Avg | Avg Avg | Min Avg | Max Low | Avg Low | Min Low | Max Precipitation | Avg Precipitation | Max Snow | Avg Snow | |
|---|---|---|---|---|---|---|---|---|---|---|---|---|---|
| Record | 38.6 °C | — | 23.9 °C | 31.5 °C | — | 21.6 °C | 27.3 °C | — | 16.5 °C | 308.0 mm | — | — | — |
| January | 38.6 °C | 30.8 °C | 23.9 °C | 31.5 °C | 26.7 °C | 22.6 °C | 26.2 °C | 22.5 °C | 17.0 °C | 141.2 mm | 8.5 mm | — | — |
| February | 37.1 °C | 31.3 °C | 24.5 °C | 30.8 °C | 27.0 °C | 22.7 °C | 26.4 °C | 22.6 °C | 16.5 °C | 127.9 mm | 8.6 mm | — | — |
| March | 36.0 °C | 31.2 °C | 25.1 °C | 31.5 °C | 27.0 °C | 22.2 °C | 26.5 °C | 22.9 °C | 17.4 °C | 165.5 mm | 10.8 mm | — | — |
| April | 35.2 °C | 31.0 °C | 25.4 °C | 31.0 °C | 27.1 °C | 23.2 °C | 27.3 °C | 23.2 °C | 18.0 °C | 308.0 mm | 9.9 mm | — | — |
| May | 36.2 °C | 31.2 °C | 25.5 °C | 30.7 °C | 27.3 °C | 22.4 °C | 26.7 °C | 23.3 °C | 18.0 °C | 227.2 mm | 8.2 mm | — | — |
| June | 38.0 °C | 31.0 °C | 25.2 °C | 31.2 °C | 27.0 °C | 22.7 °C | 26.7 °C | 22.8 °C | 17.0 °C | 129.5 mm | 6.5 mm | — | — |
| July | 36.9 °C | 30.7 °C | 24.7 °C | 31.2 °C | 26.6 °C | 22.4 °C | 26.2 °C | 22.5 °C | 17.2 °C | 196.6 mm | 8.0 mm | — | — |
| August | 35.1 °C | 30.5 °C | 24.8 °C | 30.0 °C | 26.4 °C | 22.2 °C | 25.8 °C | 22.4 °C | 17.4 °C | 196.8 mm | 9.6 mm | — | — |
| September | 38.0 °C | 30.3 °C | 24.8 °C | 30.4 °C | 26.3 °C | 22.3 °C | 26.0 °C | 22.5 °C | 17.3 °C | 166.0 mm | 10.6 mm | — | — |
| October | 36.0 °C | 30.1 °C | 25.0 °C | 30.5 °C | 26.2 °C | 21.6 °C | 25.8 °C | 22.6 °C | 19.0 °C | 195.1 mm | 12.4 mm | — | — |
| November | 35.2 °C | 29.9 °C | 24.0 °C | 30.2 °C | 26.1 °C | 22.9 °C | 25.6 °C | 22.7 °C | 19.0 °C | 186.8 mm | 14.2 mm | — | — |
| December | 37.0 °C | 30.4 °C | 24.5 °C | 30.8 °C | 26.4 °C | 22.9 °C | 25.8 °C | 22.6 °C | 18.0 °C | 126.0 mm | 11.7 mm | — | — |
Data Visualisations
Remove WatermarksCurrent Year Climate Trends vs Historical


Max Temperature this Year | 1 of 6
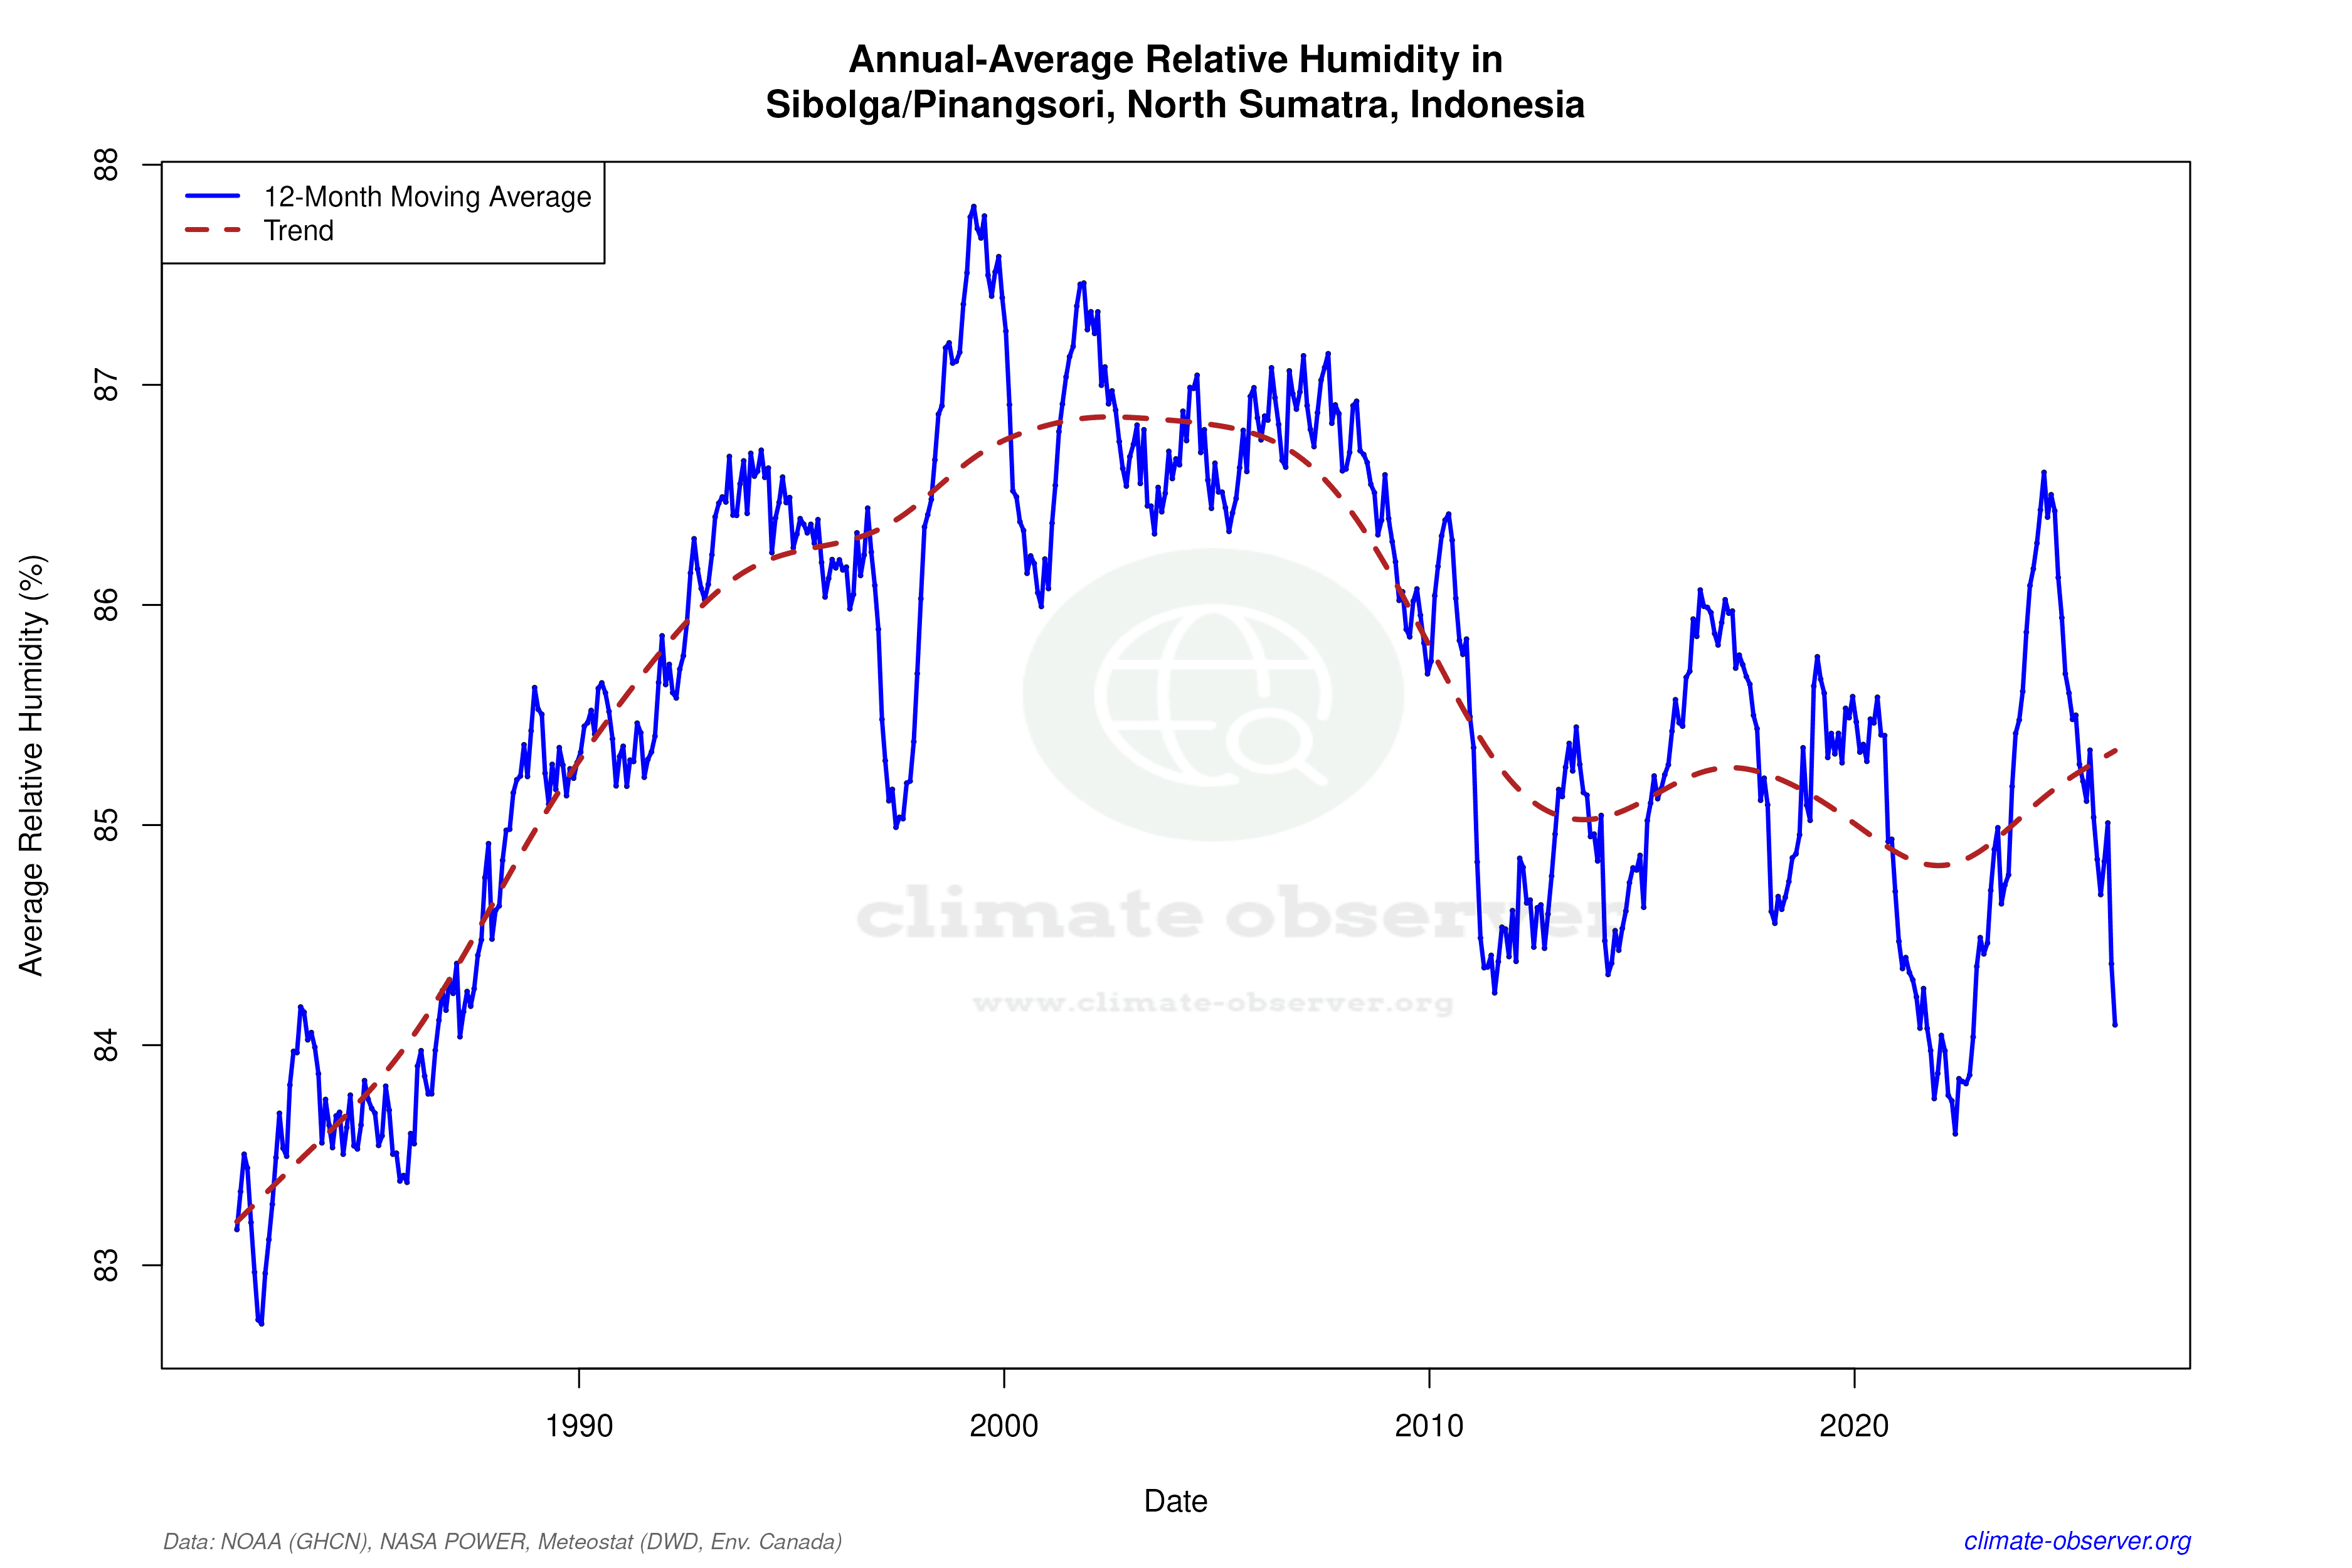
Climate 12-Month Moving Averages


Max Temperature 12-Month MA | 1 of 6
Daily Data Points and Averages Throughout the Year


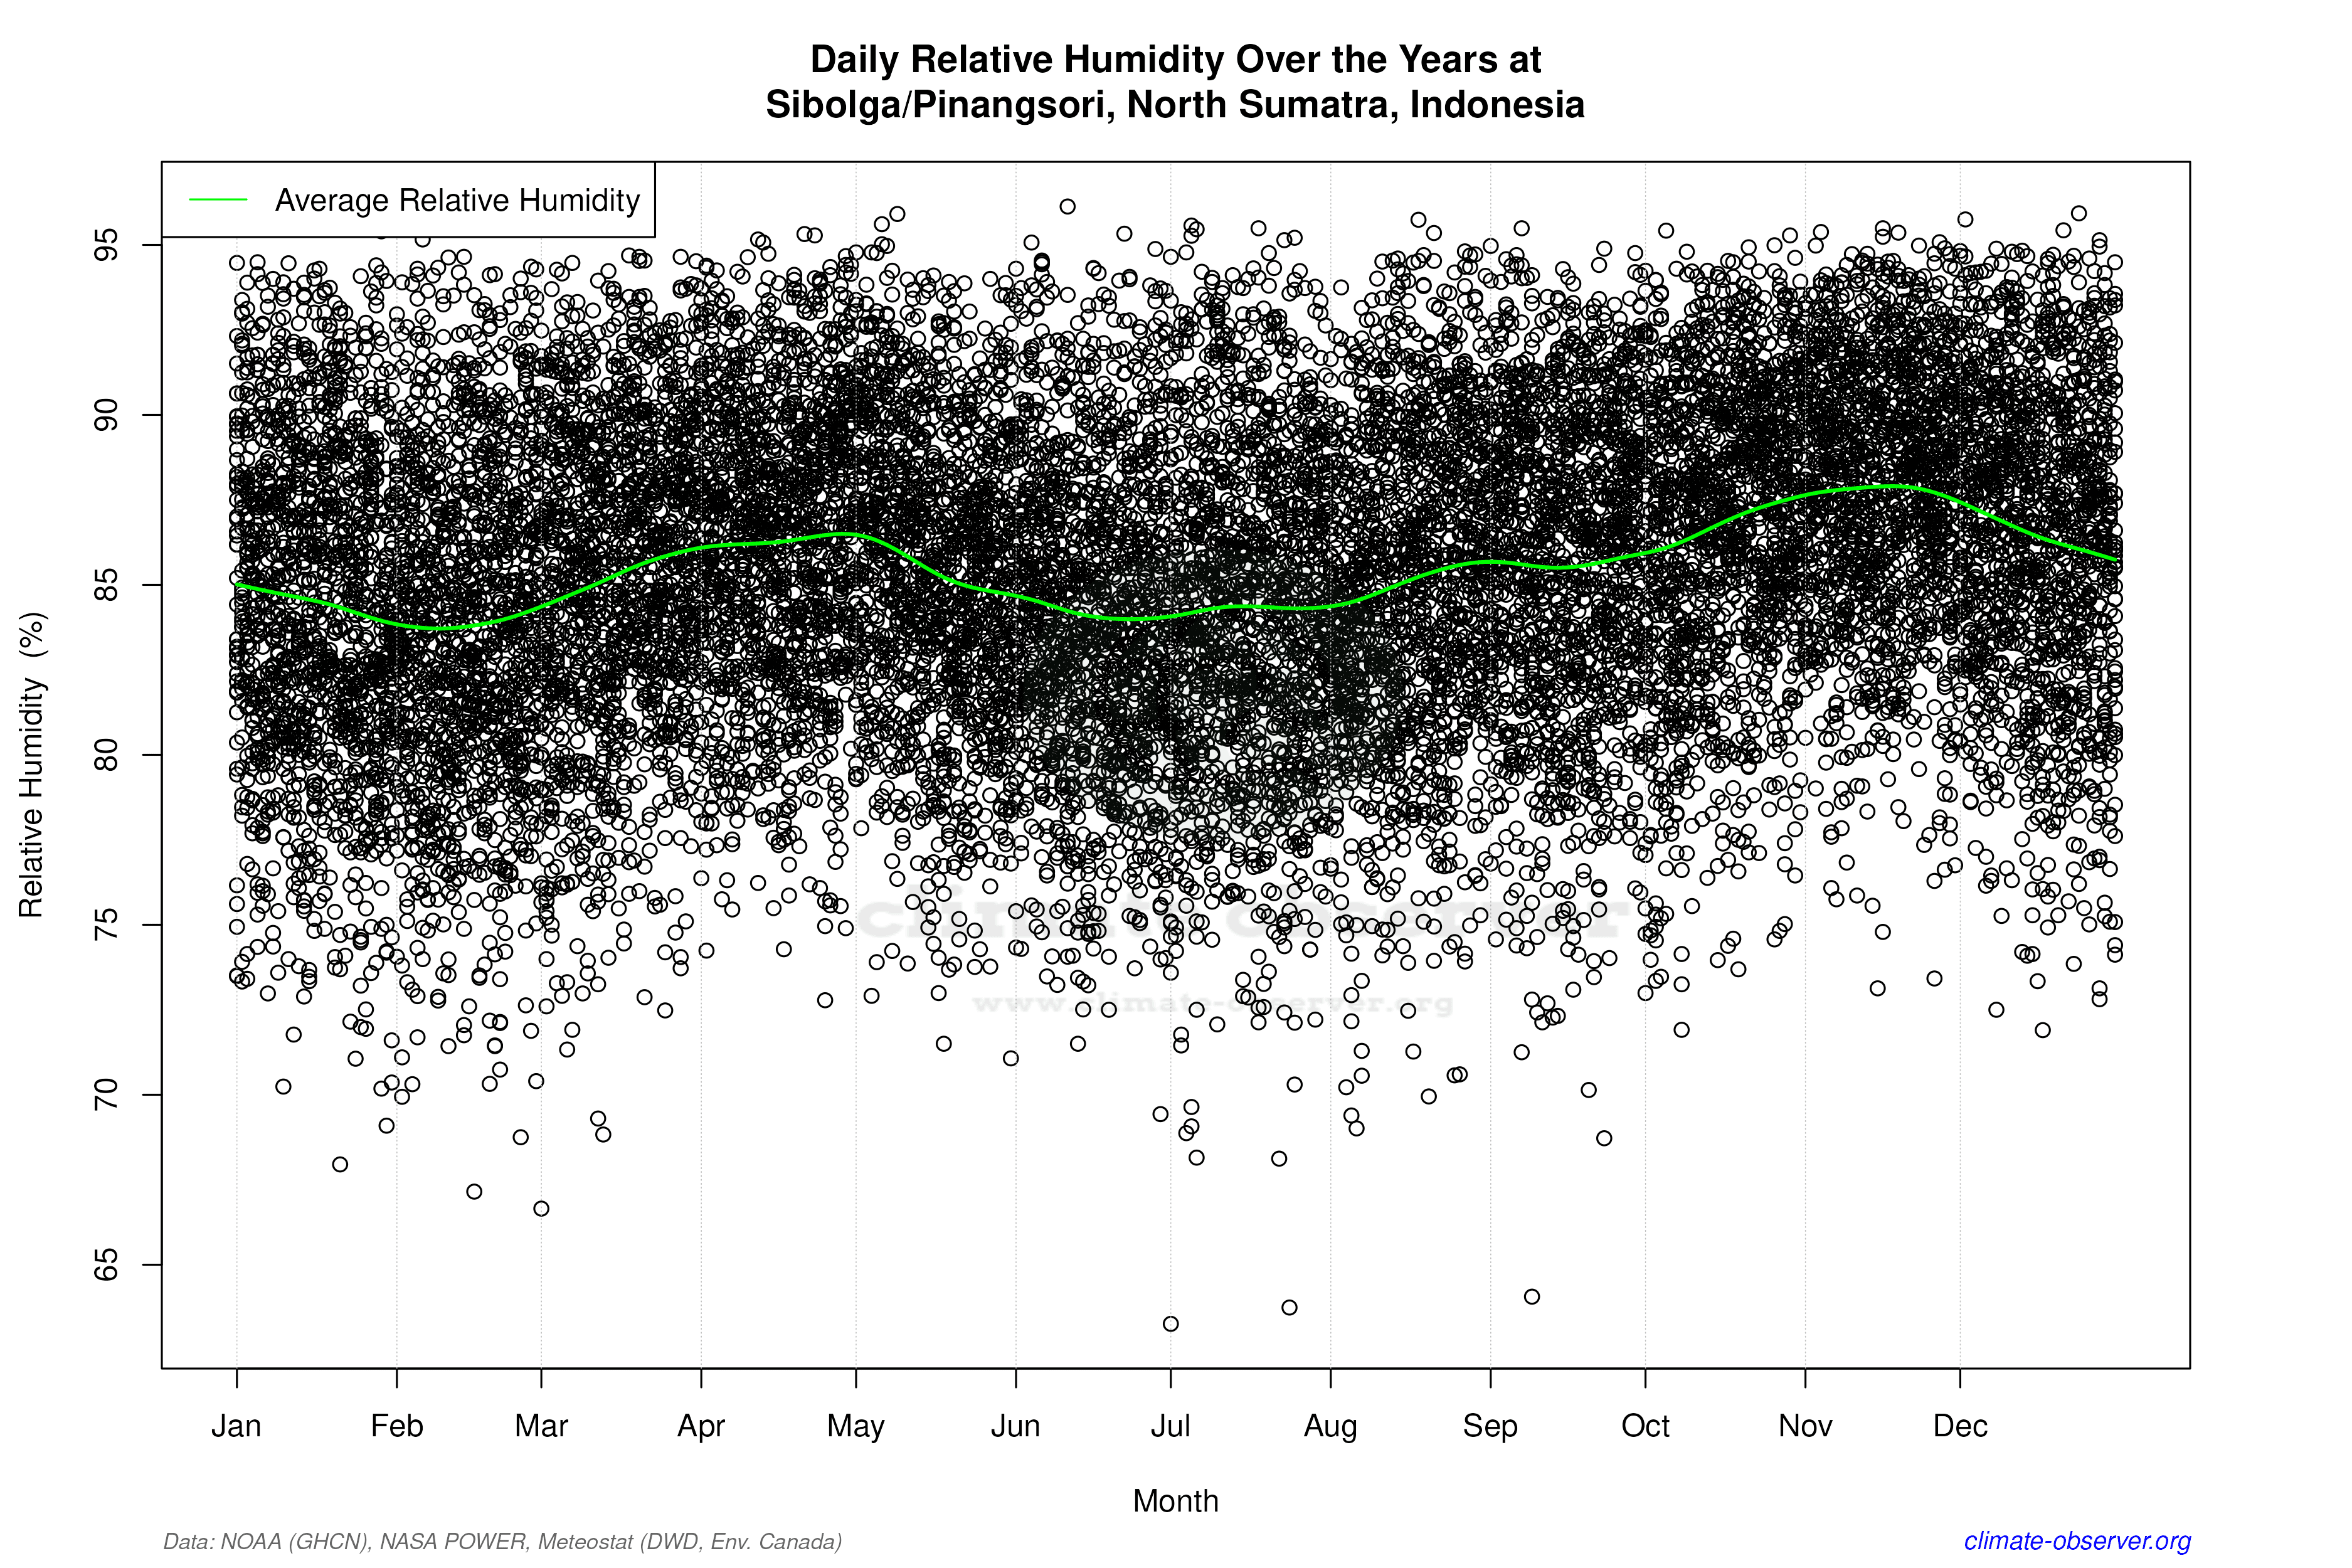

Average Max Temperature Throughout Year | 1 of 5
