Climate for Station: Jakarta/Observatory, Jakarta, Indonesia
Loading live weather...
Climate Analysis & Overview
Jakarta's climate profile reveals a complex interplay of warming and cooling trends, with a notable decrease in precipitation concentration. The city experiences a warming trend in high temperatures over the long term, while recent years show a cooling trend in lows. These dynamics are set against the backdrop of Indonesia's ongoing climate resilience efforts.
Tropical Climate Dynamics
Jakarta, situated at -6.183° latitude and 106.833° longitude, experiences a tropical monsoon climate (Am) under the Köppen classification. This climate type is characterised by a pronounced wet season and a short dry season, influenced by its coastal location on the island of Java. The city's proximity to the Java Sea moderates temperatures but also contributes to high humidity levels. Over the all-time scale, the city has seen a warming trend in high temperatures, with an increase of 0.79°C (1.42°F). This warming trend is indicative of the broader regional climate changes affecting Southeast Asia, where rising temperatures are a critical concern for urban planning and public health.
Temperature Trends: A Mixed Picture
In the past decade, Jakarta's temperature trends have shown a divergence. The 10-year trend for high temperatures indicates a modest increase of 0.08°C (0.14°F), suggesting a continuation of the long-term warming pattern. However, the low temperatures have experienced a notable cooling trend of -0.78°C (-1.40°F) over the same period. This cooling in lows could be attributed to localised factors such as urban heat island effects being mitigated by increased green spaces or changes in land use. The all-time low temperature trend shows a slight warming of 0.16°C (0.29°F), reflecting a complex interplay of factors influencing nighttime temperatures.
Precipitation Patterns: More Even Distribution
The Precipitation Concentration Index (PCI) provides insight into how rainfall is distributed throughout the year. Jakarta's PCI has decreased from a baseline of 13.17 to a current value of 10.73, indicating a more even distribution of precipitation events. This shift suggests that while the city still experiences heavy rainfall, these events are spread more evenly across the year, potentially reducing the risk of flooding and improving water management. A PCI below 10 would indicate an extremely even distribution, but the current value still represents a significant improvement.
Extremes and Records
Jakarta's climate extremes are marked by a record high of 39.0°C (102.2°F) and a record low of 19.8°C (67.6°F). These extremes underscore the city's vulnerability to temperature fluctuations, which can have profound impacts on infrastructure and public health. The city's ongoing efforts to adapt to climate change, including enhancing urban resilience and improving water management systems, are crucial in mitigating the impacts of these temperature extremes.
Regional Climate Initiatives
Indonesia has been proactive in addressing climate change through various initiatives aimed at reducing greenhouse gas emissions and enhancing climate resilience. Jakarta, as the nation's capital, plays a pivotal role in these efforts. The city's climate profile, with its mixed temperature trends and improved precipitation distribution, reflects the broader challenges and opportunities faced by the region in adapting to a changing climate.
Station Statistics
10-Year Trend
High: -0.30 °C/decade
Low: -0.88 °C/decade
Rain: -0.47 mm/decade
25-Year Trend
High: +0.40 °C/decade
Low: +0.02 °C/decade
Rain: +0.81 mm/decade
50-Year Trend
High: +0.76 °C/decade
Low: +0.15 °C/decade
Rain: +0.46 mm/decade
All-Time Trend
High: +0.76 °C/decade
Low: +0.15 °C/decade
Rain: +0.46 mm/decade
Percentage Above-Average Days
Last 12 Months: 29.3%
This Year: 4.8%
Precipitation Concentration Index (PCI) ℹ️
Last 12 Months: 10.2
Historical Average: 12.4
Percentile Rank of Last 12 Months ℹ️
High: 51st percentile
Low: 10th percentile
Rain: 89th percentile
Change in Variance ℹ️
High: -39.4%
Low: +55.2%
Intraday: -38.8%
Data Coverage
90.6%
First Year of Data
1973
Station Location
Historical Weather Records
| Max High | Avg High | Min High | Max Avg | Avg Avg | Min Avg | Max Low | Avg Low | Min Low | Max Precipitation | Avg Precipitation | Max Snow | Avg Snow | |
|---|---|---|---|---|---|---|---|---|---|---|---|---|---|
| Record | 39.0 °C | — | 24.8 °C | 33.0 °C | — | 21.8 °C | 28.7 °C | — | 19.8 °C | 199.9 mm | — | — | — |
| January | 36.0 °C | 29.7 °C | 25.5 °C | 32.5 °C | 27.2 °C | 23.6 °C | 28.2 °C | 24.9 °C | 21.8 °C | 129.0 mm | 10.4 mm | — | — |
| February | 37.0 °C | 29.6 °C | 24.8 °C | 31.2 °C | 27.2 °C | 23.8 °C | 28.0 °C | 24.8 °C | 21.0 °C | 115.1 mm | 10.6 mm | — | — |
| March | 36.8 °C | 30.6 °C | 26.2 °C | 31.6 °C | 27.8 °C | 23.8 °C | 28.0 °C | 25.2 °C | 20.0 °C | 62.3 mm | 6.5 mm | — | — |
| April | 35.8 °C | 31.3 °C | 26.3 °C | 32.6 °C | 28.4 °C | 25.0 °C | 28.7 °C | 25.6 °C | 21.0 °C | 89.9 mm | 5.6 mm | — | — |
| May | 36.6 °C | 31.4 °C | 27.2 °C | 32.4 °C | 28.6 °C | 25.3 °C | 28.3 °C | 25.7 °C | 22.0 °C | 48.0 mm | 4.0 mm | — | — |
| June | 35.6 °C | 31.1 °C | 26.7 °C | 31.9 °C | 28.3 °C | 23.8 °C | 28.0 °C | 25.3 °C | 21.8 °C | 69.1 mm | 3.0 mm | — | — |
| July | 36.6 °C | 30.9 °C | 26.7 °C | 31.7 °C | 27.9 °C | 24.2 °C | 27.4 °C | 24.8 °C | 19.8 °C | 36.3 mm | 2.2 mm | — | — |
| August | 38.0 °C | 31.3 °C | 26.9 °C | 31.5 °C | 28.1 °C | 24.2 °C | 27.8 °C | 24.7 °C | 20.8 °C | 44.3 mm | 1.8 mm | — | — |
| September | 37.0 °C | 31.9 °C | 26.4 °C | 31.9 °C | 28.5 °C | 24.1 °C | 28.2 °C | 25.1 °C | 20.0 °C | 43.2 mm | 2.2 mm | — | — |
| October | 39.0 °C | 32.1 °C | 26.7 °C | 33.0 °C | 28.7 °C | 24.3 °C | 28.2 °C | 25.6 °C | 22.0 °C | 199.9 mm | 3.9 mm | — | — |
| November | 38.0 °C | 31.6 °C | 25.8 °C | 32.5 °C | 28.3 °C | 24.7 °C | 28.4 °C | 25.5 °C | 21.0 °C | 91.9 mm | 5.8 mm | — | — |
| December | 37.6 °C | 30.7 °C | 25.0 °C | 32.8 °C | 27.7 °C | 21.8 °C | 27.7 °C | 25.2 °C | 22.0 °C | 89.9 mm | 7.1 mm | — | — |
Data Visualisations
Remove WatermarksCurrent Year Climate Trends vs Historical


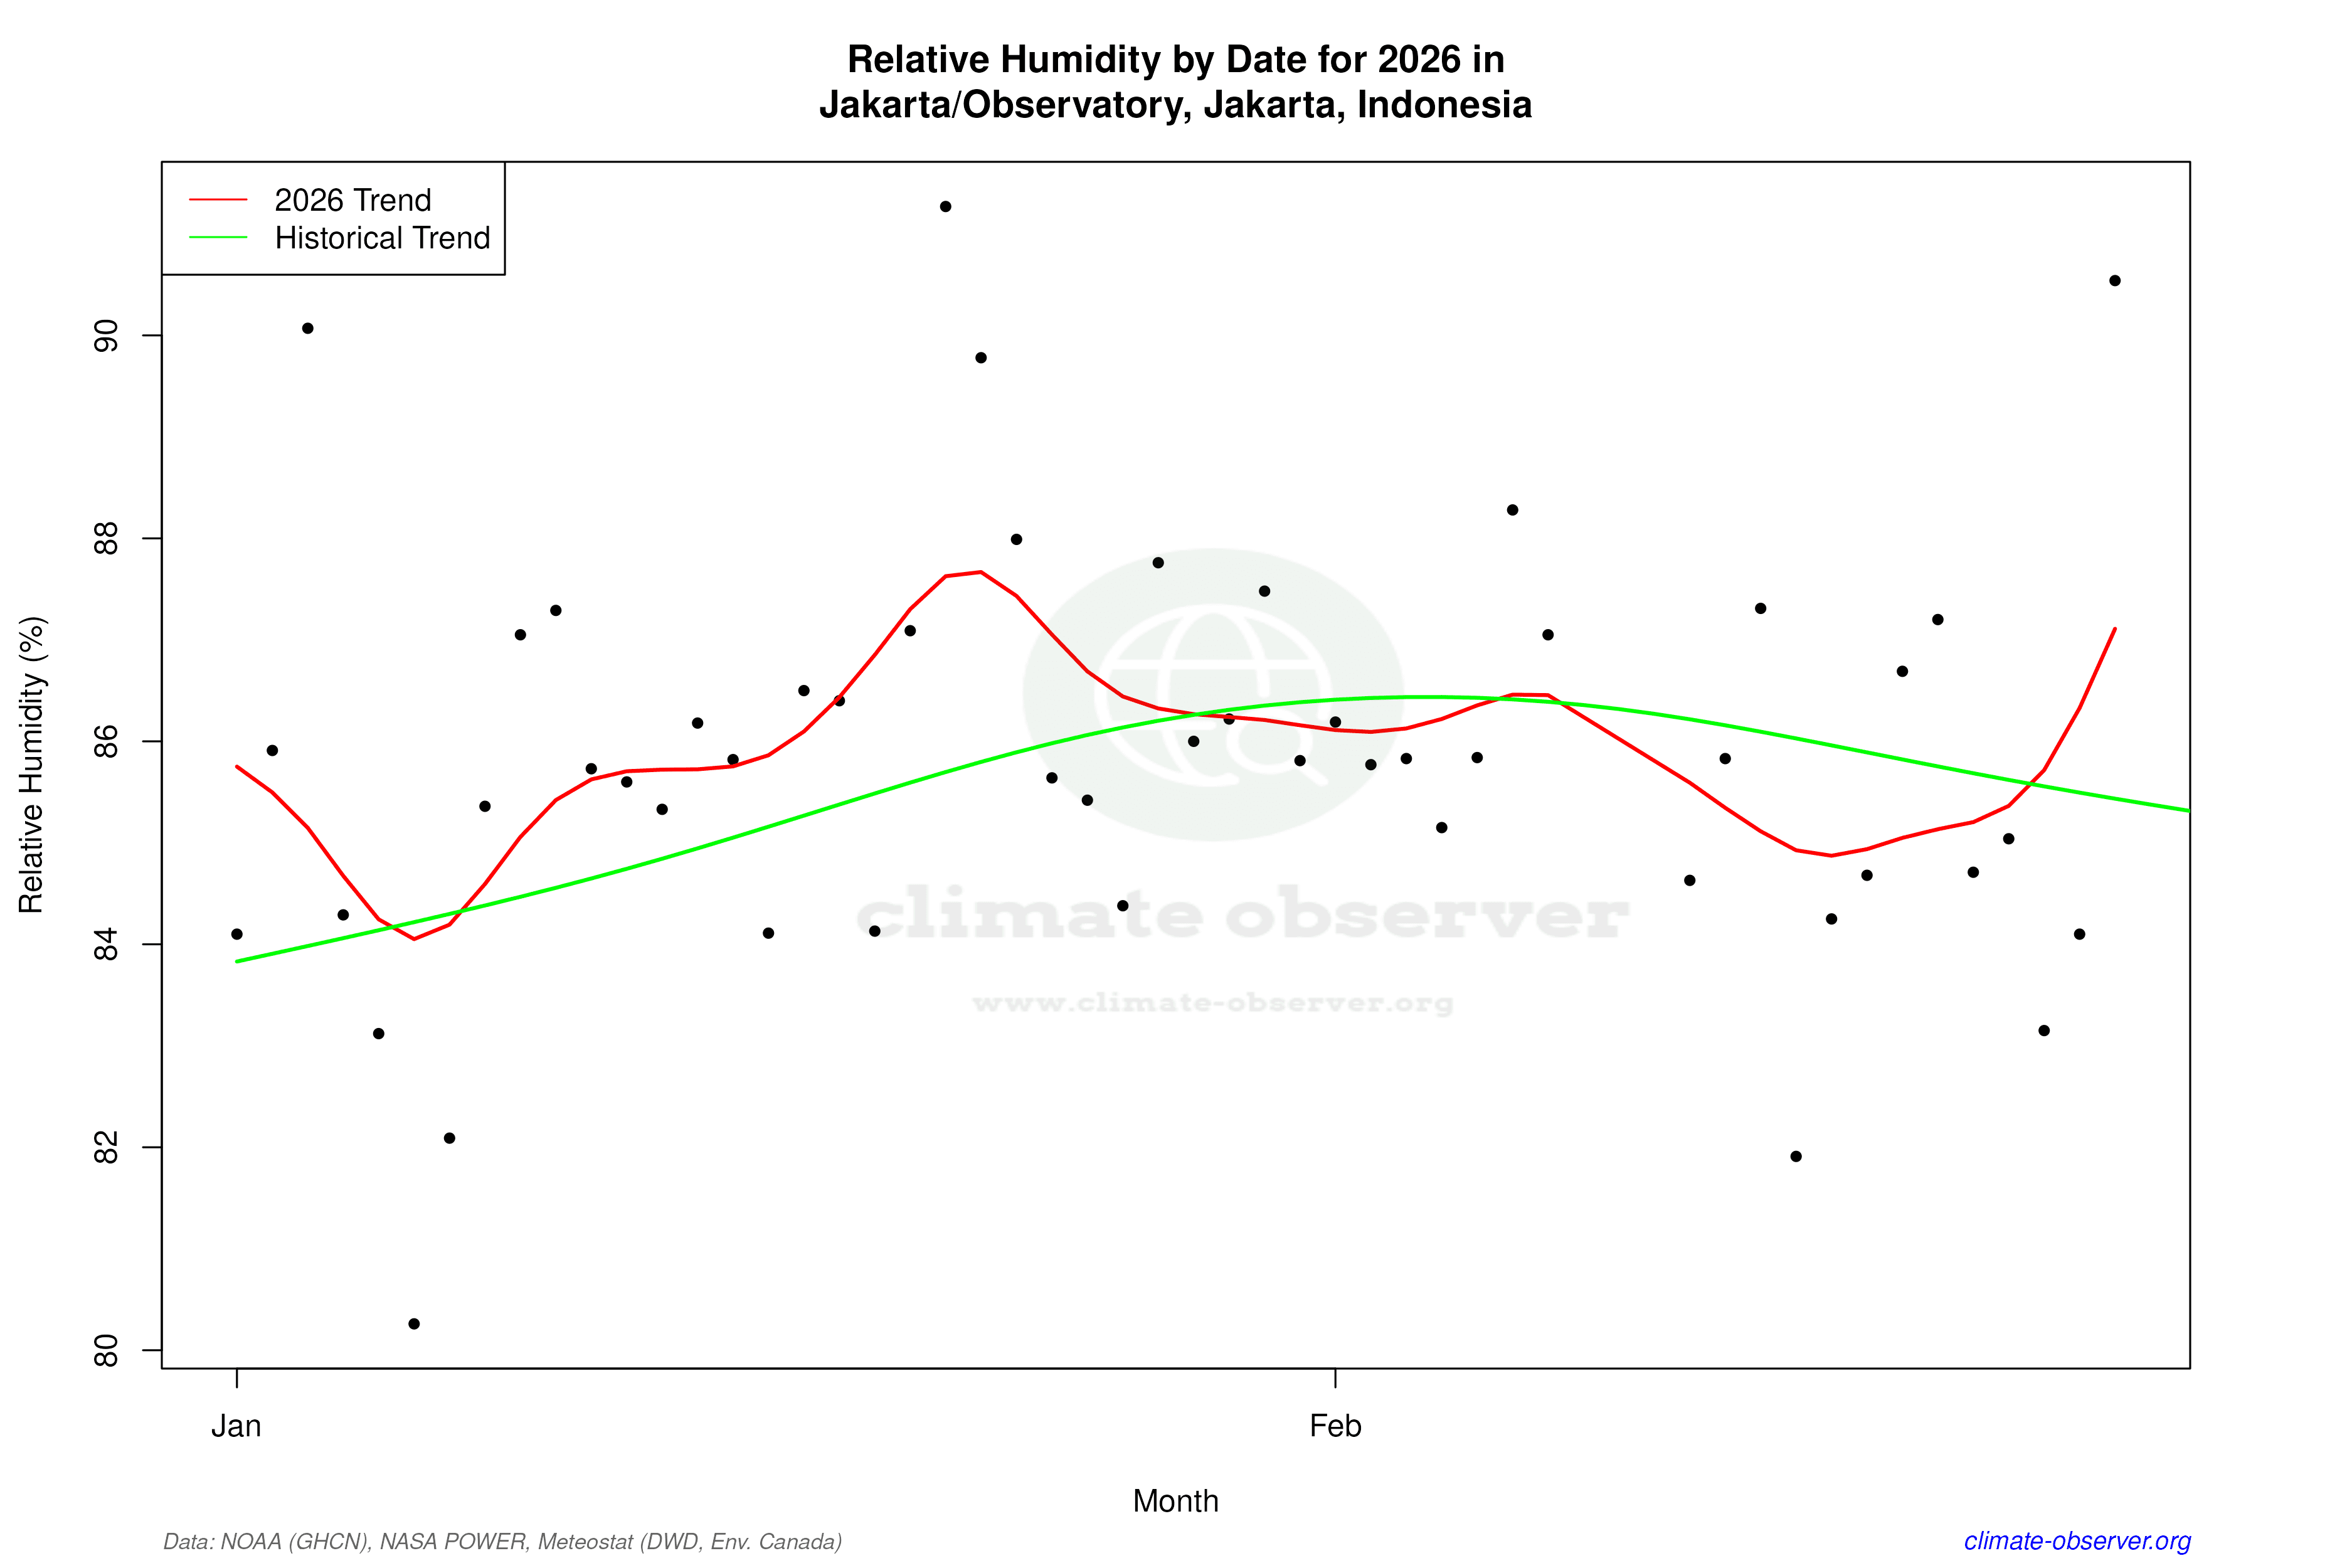

Max Temperature this Year | 1 of 6
Climate 12-Month Moving Averages


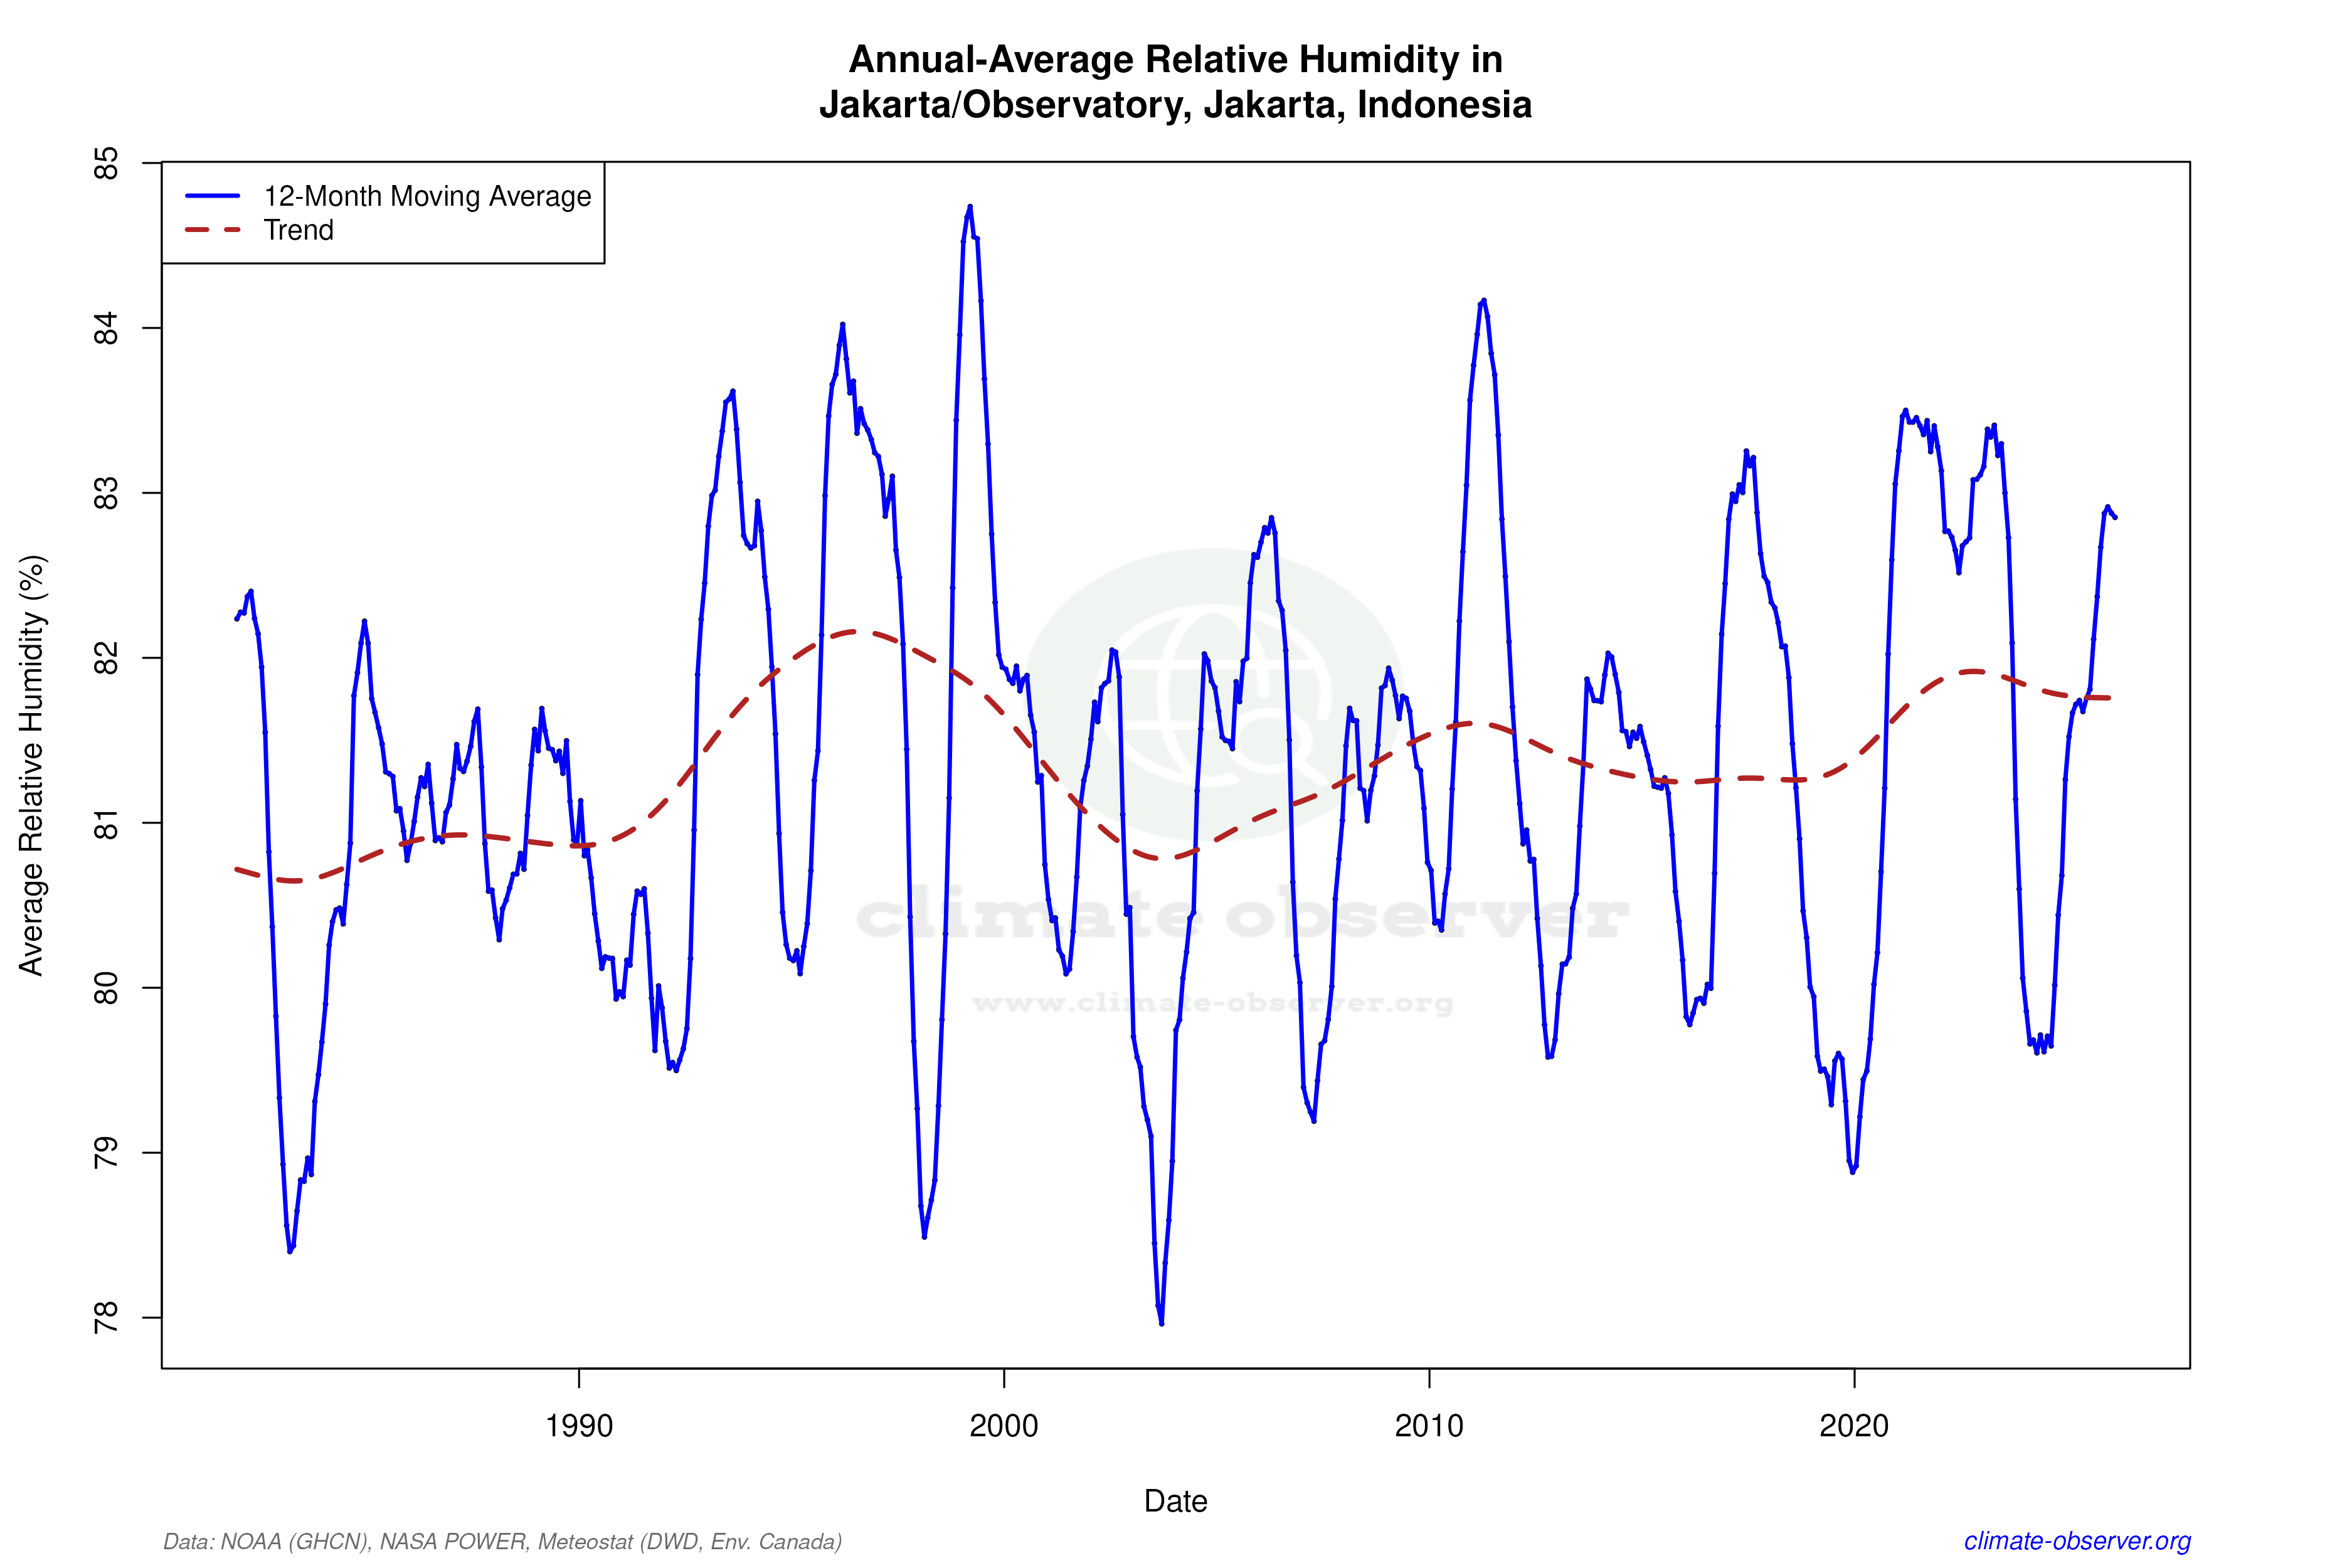

Max Temperature 12-Month MA | 1 of 6
Daily Data Points and Averages Throughout the Year


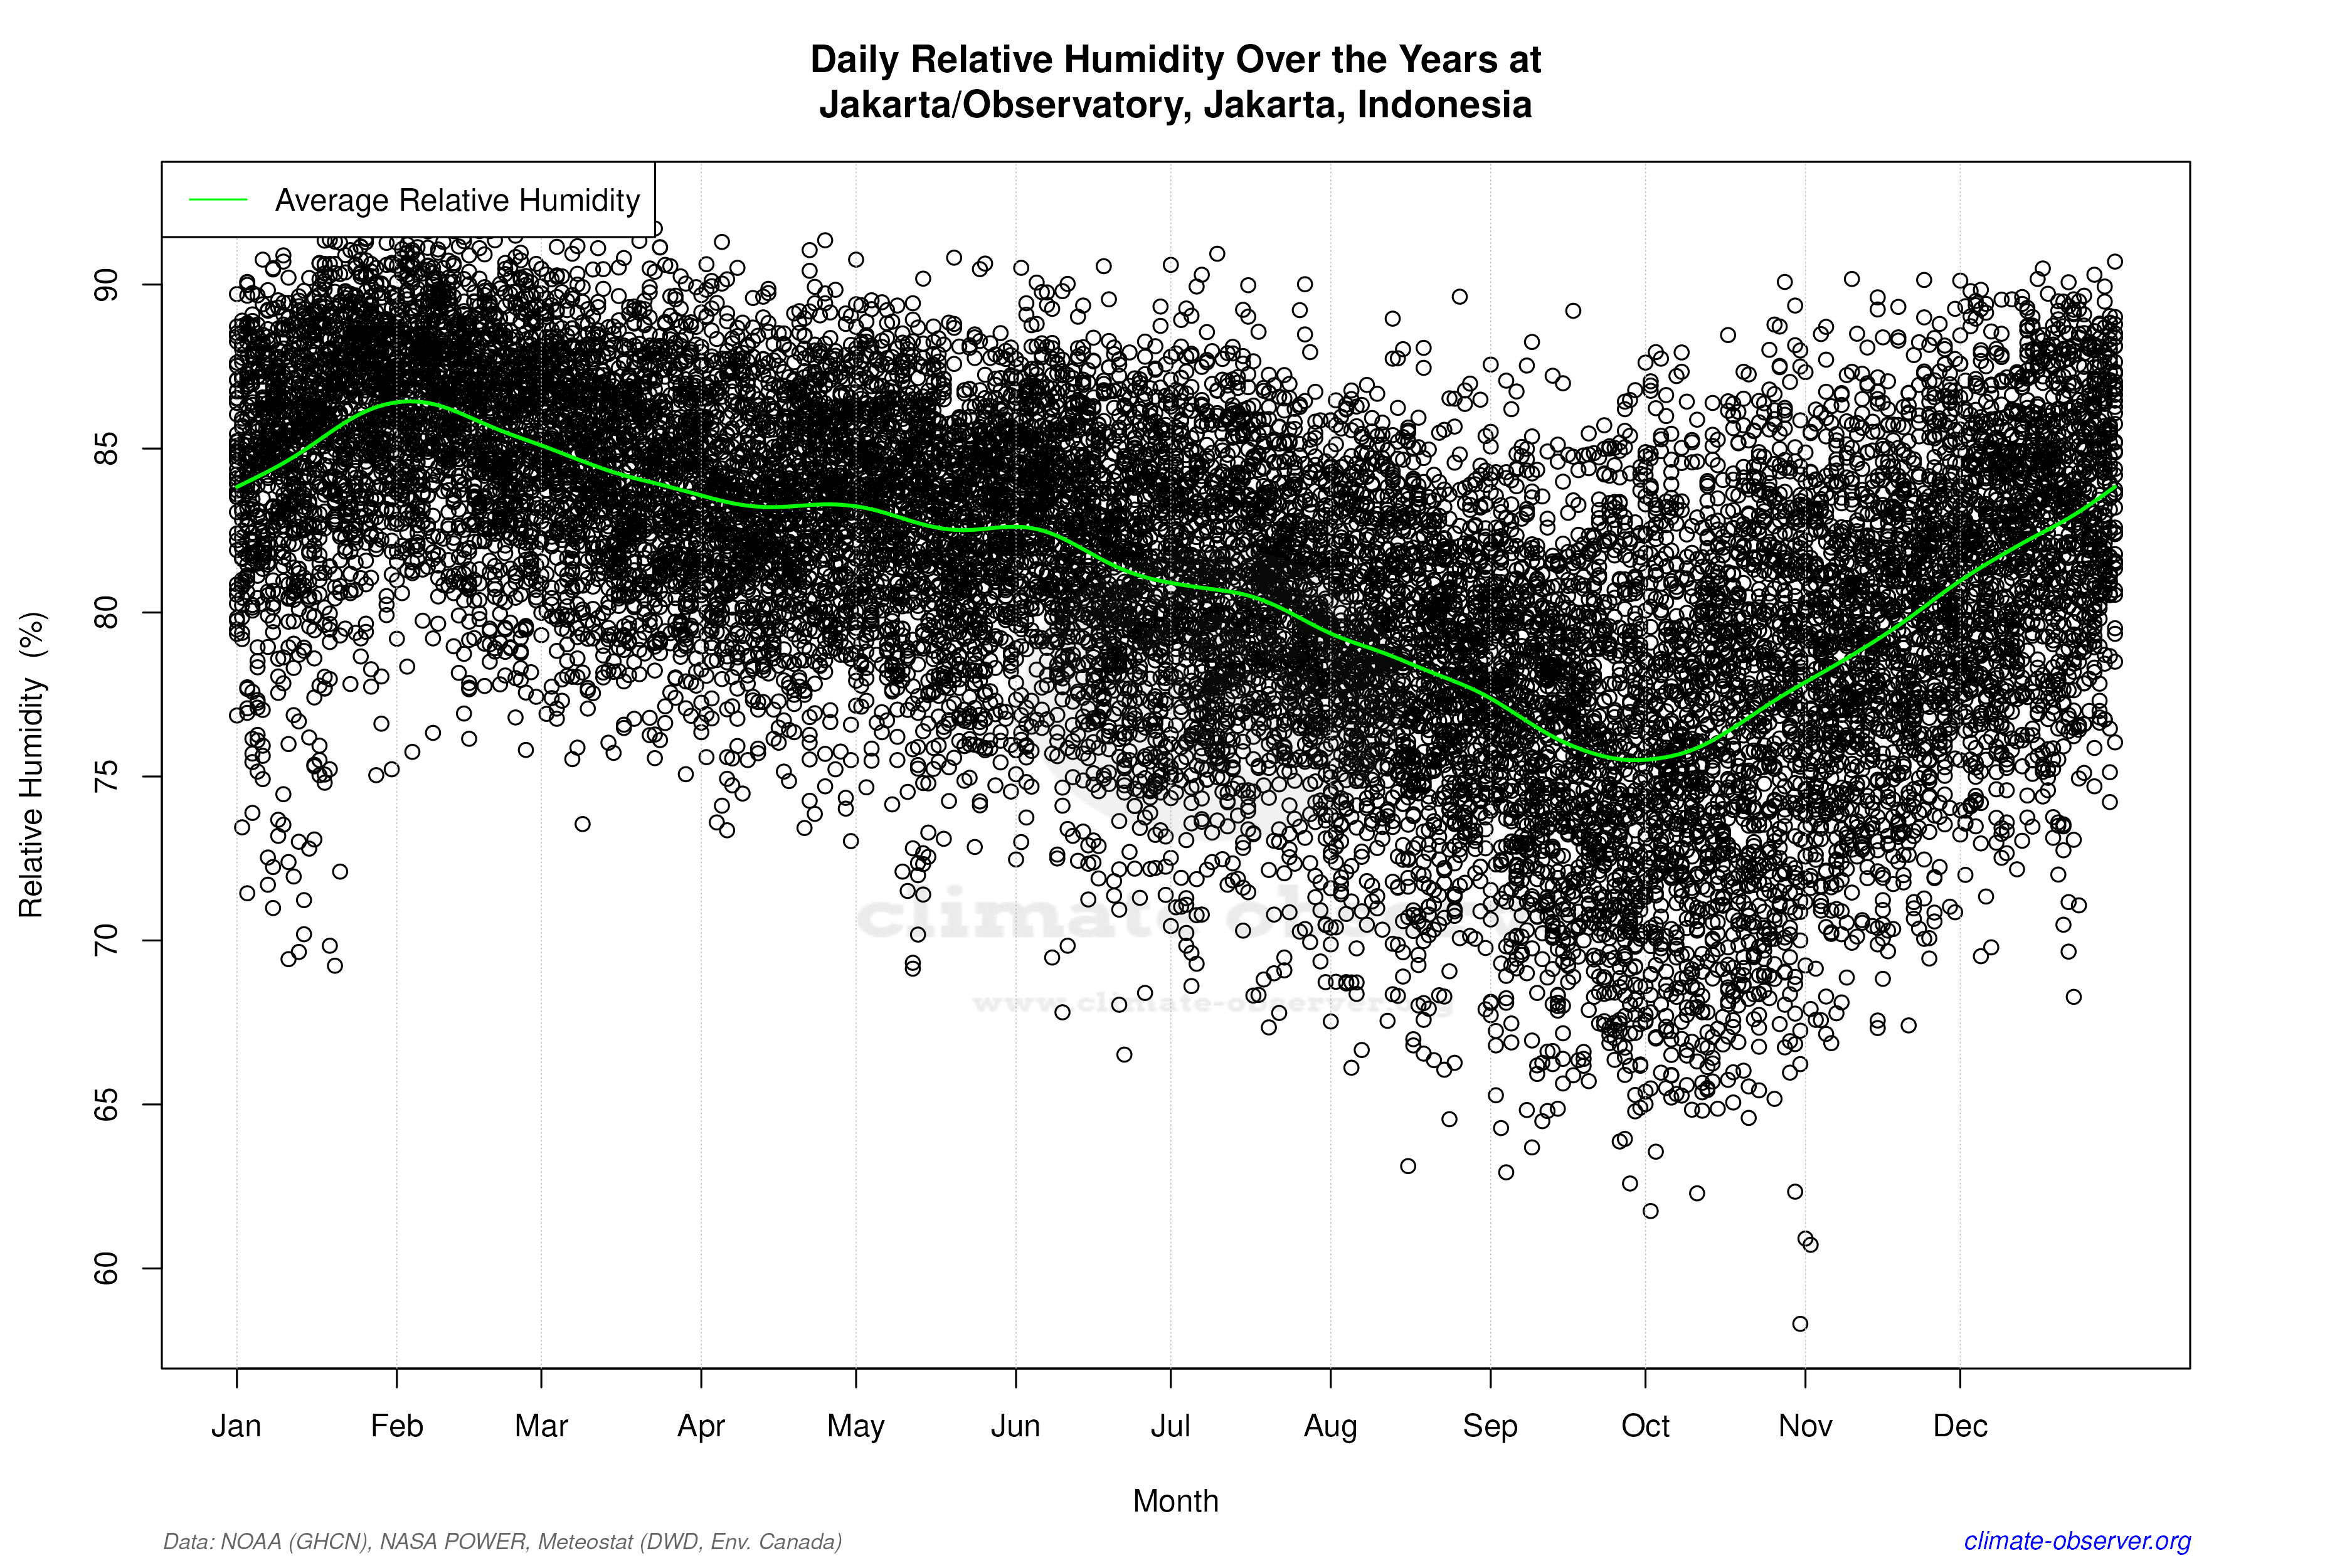

Average Max Temperature Throughout Year | 1 of 5
