Climate for Station: Ahmadabad, Gujarat, India
Loading live weather...
Climate Analysis & Overview
Ahmadabad's climate is characterised by a complex interplay of warming and cooling trends, with a notable shift in precipitation distribution. Over the past decade, high temperatures have decreased by 1.59°C (2.86°F), while low temperatures have risen by 1.09°C (1.96°F). The city's all-time trends show a slight warming in both highs and lows, indicating a nuanced climate evolution.
Subtropical Dynamics in Ahmadabad
Located in the subtropical region of India, Ahmadabad experiences a semi-arid climate, classified under the Köppen system as BSh. The city's geographical setting, away from the coast and surrounded by the flat terrain of Gujarat, influences its temperature patterns and precipitation. Historically, Ahmadabad has recorded extreme temperatures, with a maximum of 50.0°C (122.0°F) and a minimum of 3.5°C (38.3°F). These records highlight the city's susceptibility to temperature extremes, typical of its climatic zone.
Temperature Trends: A Tale of Two Directions
In the past decade, Ahmadabad's climate has exhibited contrasting temperature trends. High temperatures have shown a cooling trend of 1.59°C (2.86°F), which contrasts with the all-time trend of a slight warming of 0.03°C (0.05°F). This discrepancy suggests recent cooling events or interventions. Conversely, low temperatures have risen by 1.09°C (1.96°F) over the same period, aligning with the all-time warming trend of 0.25°C (0.45°F). This warming of lows may indicate increased nighttime temperatures, possibly due to urban heat effects or regional climate shifts.
Precipitation Patterns: A Shift Towards Even Distribution
Ahmadabad's Precipitation Concentration Index (PCI) has decreased significantly from a baseline of 34.7 to a current value of 18.4. This reduction suggests a more even distribution of rainfall events, moving away from highly concentrated precipitation patterns. Such a change could imply a shift towards more frequent, less intense rainfall, which may affect water management strategies and agricultural planning in the region.
Implications for Regional Climate Goals
India has been actively pursuing climate resilience and sustainable development goals. Ahmadabad's evolving climate patterns, with its cooling highs and warming lows, alongside more evenly distributed precipitation, offer both challenges and opportunities. The city's climate data could inform policy decisions, particularly in urban planning and infrastructure development, to mitigate the impacts of extreme temperatures and optimise water resource management.
A Complex Climate Narrative
The climate profile of Ahmadabad is a tapestry of subtle changes and significant shifts. The coexistence of cooling and warming trends, coupled with a marked change in precipitation distribution, paints a picture of a city adapting to its climatic realities. These insights are crucial for stakeholders aiming to align with national climate objectives and enhance the city's resilience to future climate variability.
Station Statistics
10-Year Trend
High: -1.55 °C/decade
Low: +1.24 °C/decade
Rain: +1.03 mm/decade
25-Year Trend
High: -0.24 °C/decade
Low: +0.65 °C/decade
Rain: +0.15 mm/decade
50-Year Trend
High: +0.01 °C/decade
Low: +0.30 °C/decade
Rain: +0.20 mm/decade
All-Time Trend
High: +0.01 °C/decade
Low: +0.25 °C/decade
Rain: +0.01 mm/decade
Percentage Above-Average Days
Last 12 Months: 36.4%
This Year: 72.7%
Precipitation Concentration Index (PCI) ℹ️
Last 12 Months: 18.1
Historical Average: 36.6
Percentile Rank of Last 12 Months ℹ️
High: 1st percentile
Low: 94th percentile
Rain: 79th percentile
Change in Variance ℹ️
High: +17.2%
Low: -12.2%
Intraday: -7.5%
Data Coverage
56.5%
First Year of Data
1901
Station Location
Historical Weather Records
| Max High | Avg High | Min High | Max Avg | Avg Avg | Min Avg | Max Low | Avg Low | Min Low | Max Precipitation | Avg Precipitation | Max Snow | Avg Snow | |
|---|---|---|---|---|---|---|---|---|---|---|---|---|---|
| Record | 50.0 °C | — | 19.0 °C | 39.8 °C | — | 12.0 °C | 32.3 °C | — | 3.5 °C | 414.8 mm | — | — | — |
| January | 38.8 °C | 28.2 °C | 19.0 °C | 27.3 °C | 19.8 °C | 12.0 °C | 20.1 °C | 12.2 °C | 3.9 °C | 30.7 mm | 0.0 mm | — | — |
| February | 39.8 °C | 31.4 °C | 20.3 °C | 29.4 °C | 22.9 °C | 13.2 °C | 23.0 °C | 14.5 °C | 3.5 °C | 50.0 mm | 0.1 mm | — | — |
| March | 44.0 °C | 36.3 °C | 25.0 °C | 34.7 °C | 27.8 °C | 18.1 °C | 27.7 °C | 19.3 °C | 9.5 °C | 44.4 mm | 0.0 mm | — | — |
| April | 46.5 °C | 40.3 °C | 28.3 °C | 37.3 °C | 32.0 °C | 23.0 °C | 29.8 °C | 23.9 °C | 15.1 °C | 42.7 mm | 0.1 mm | — | — |
| May | 50.0 °C | 42.0 °C | 29.4 °C | 39.8 °C | 33.8 °C | 24.7 °C | 32.0 °C | 27.0 °C | 19.4 °C | 67.0 mm | 0.3 mm | — | — |
| June | 47.5 °C | 38.8 °C | 26.6 °C | 39.1 °C | 32.4 °C | 24.3 °C | 32.3 °C | 27.6 °C | 19.3 °C | 199.9 mm | 3.1 mm | — | — |
| July | 42.7 °C | 33.7 °C | 25.6 °C | 34.7 °C | 29.2 °C | 24.2 °C | 30.6 °C | 26.0 °C | 20.5 °C | 414.8 mm | 9.9 mm | — | — |
| August | 40.4 °C | 32.1 °C | 24.0 °C | 33.6 °C | 28.3 °C | 23.5 °C | 30.9 °C | 25.1 °C | 20.0 °C | 199.9 mm | 7.0 mm | — | — |
| September | 42.0 °C | 33.6 °C | 24.0 °C | 35.2 °C | 28.9 °C | 22.4 °C | 29.0 °C | 24.6 °C | 18.9 °C | 257.8 mm | 4.3 mm | — | — |
| October | 42.4 °C | 35.4 °C | 24.8 °C | 34.2 °C | 28.2 °C | 20.8 °C | 29.0 °C | 21.3 °C | 12.6 °C | 107.5 mm | 0.4 mm | — | — |
| November | 39.0 °C | 32.8 °C | 21.3 °C | 31.9 °C | 24.4 °C | 16.6 °C | 25.0 °C | 16.8 °C | 9.2 °C | 53.3 mm | 0.2 mm | — | — |
| December | 35.6 °C | 29.4 °C | 19.0 °C | 27.3 °C | 20.9 °C | 12.5 °C | 21.7 °C | 13.5 °C | 3.6 °C | 29.0 mm | 0.0 mm | — | — |
Data Visualisations
Remove WatermarksCurrent Year Climate Trends vs Historical


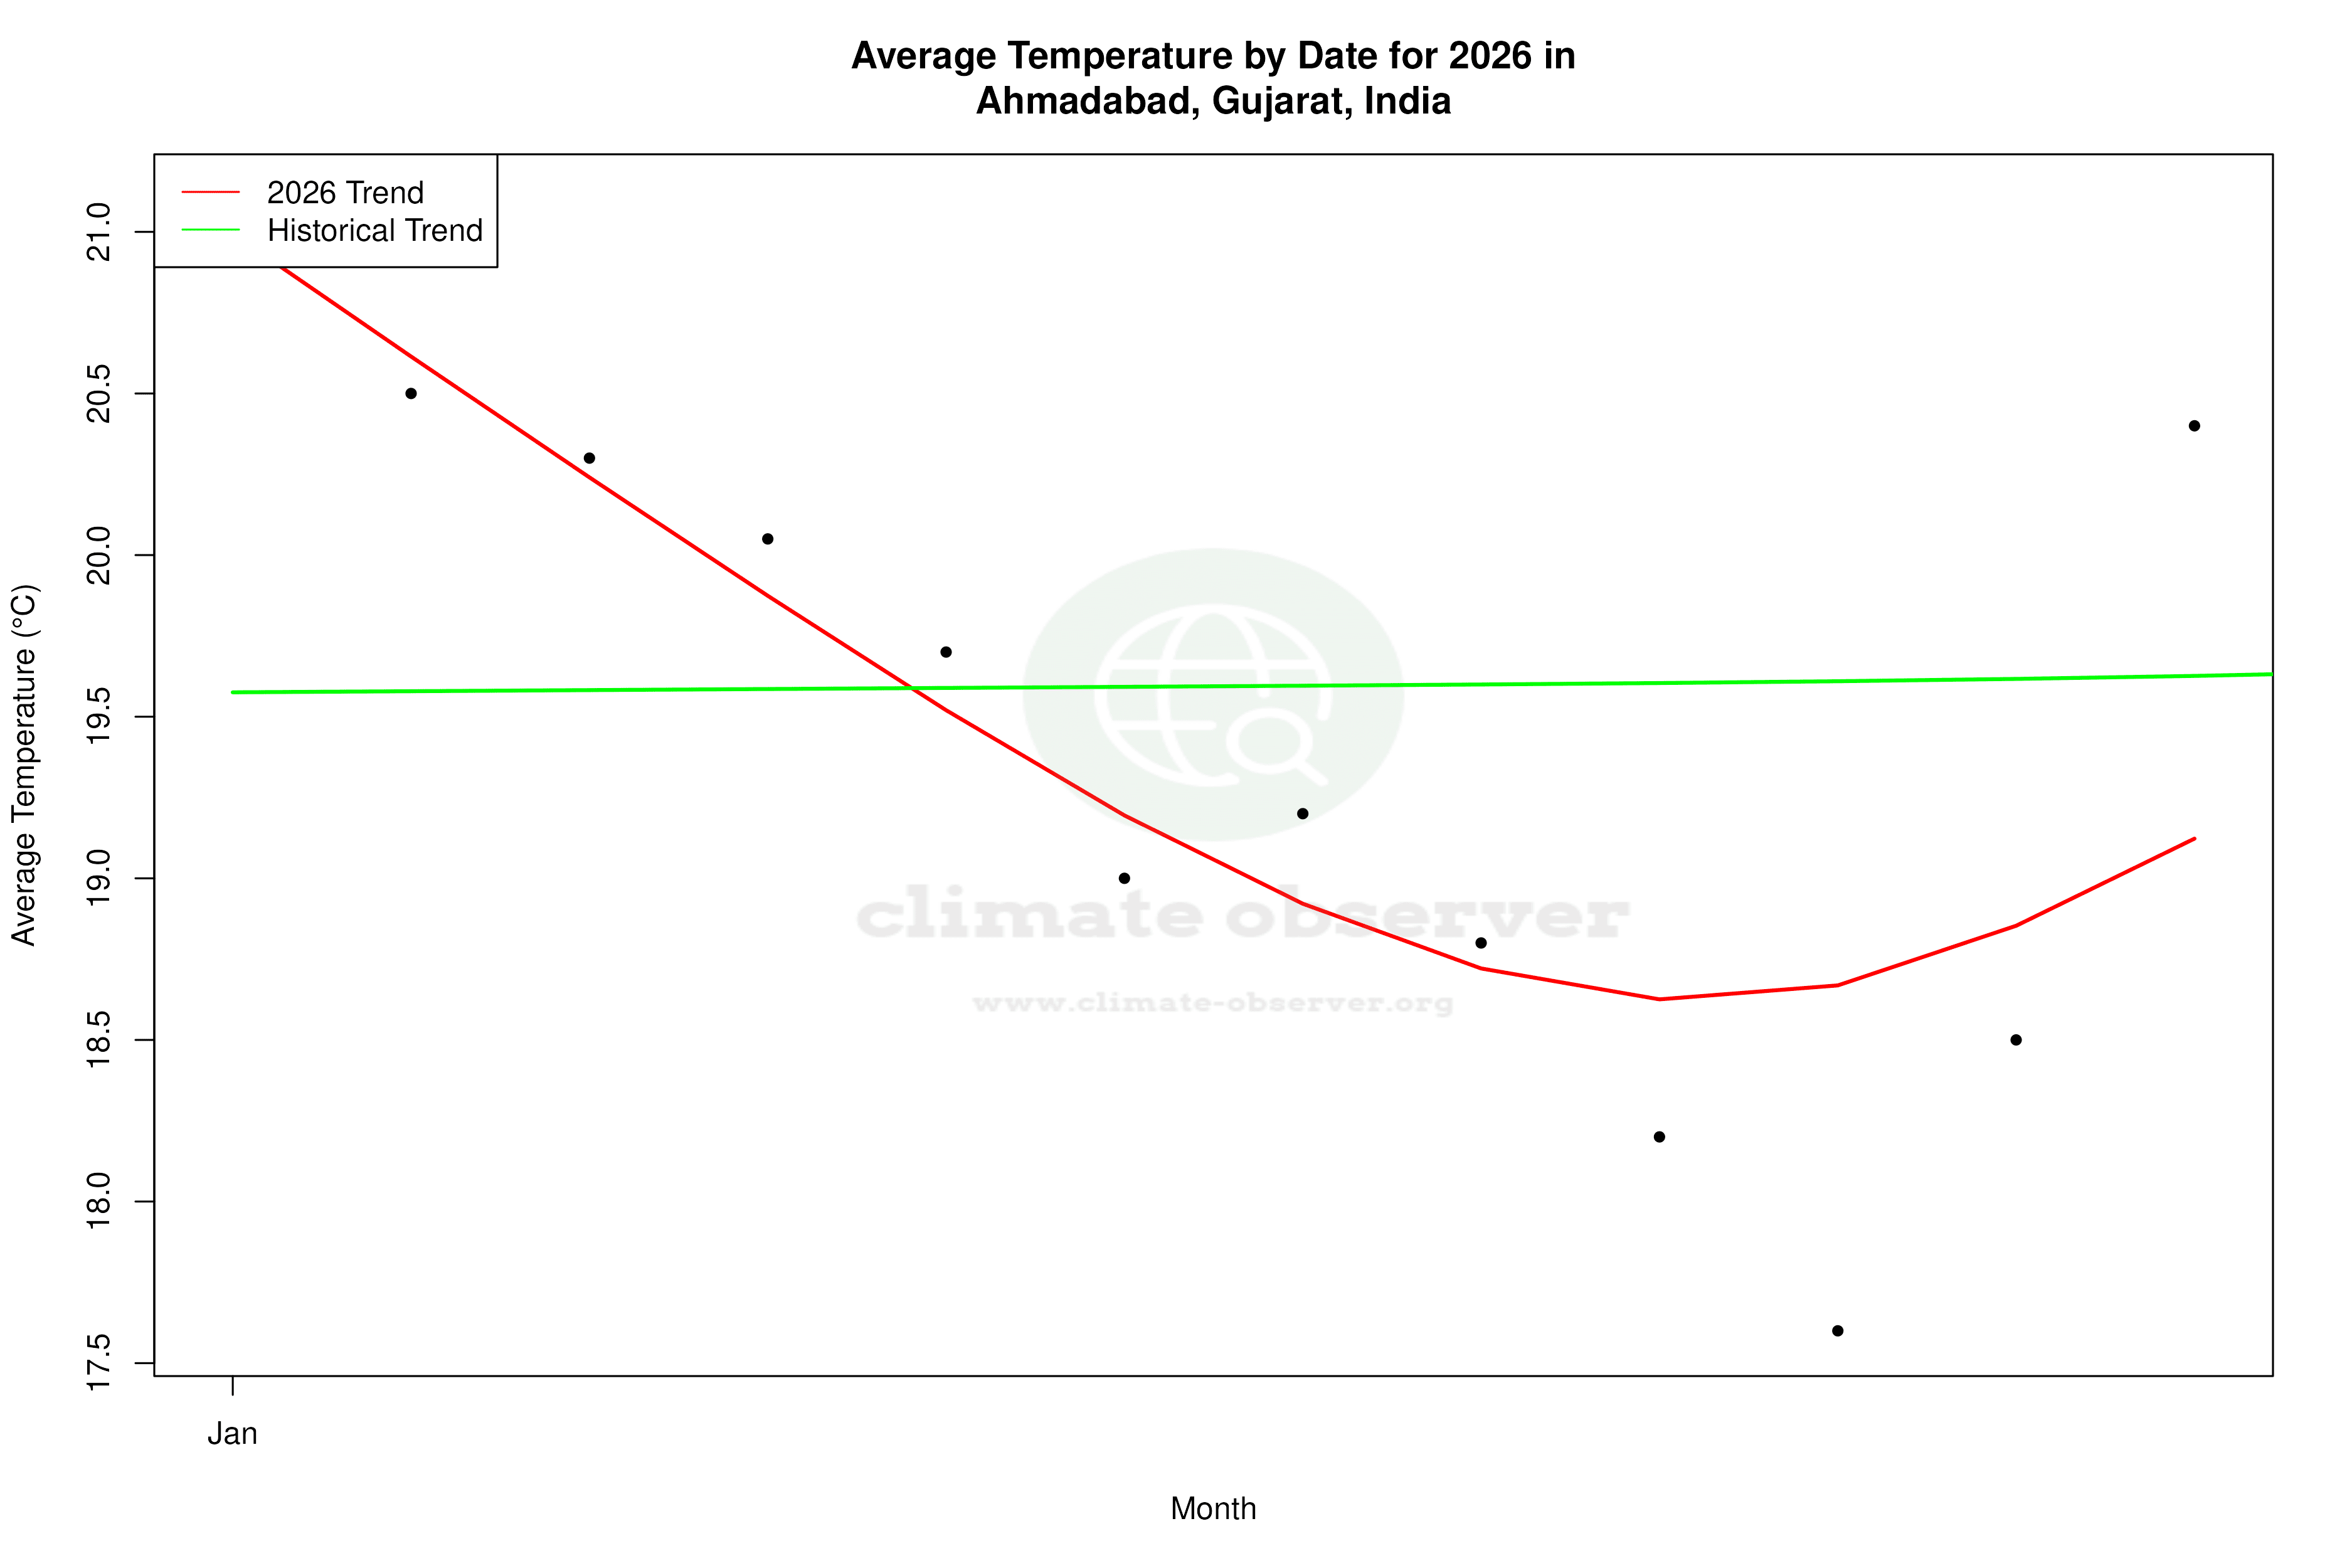


Max Temperature this Year | 1 of 6
Climate 12-Month Moving Averages


Max Temperature 12-Month MA | 1 of 6
Daily Data Points and Averages Throughout the Year
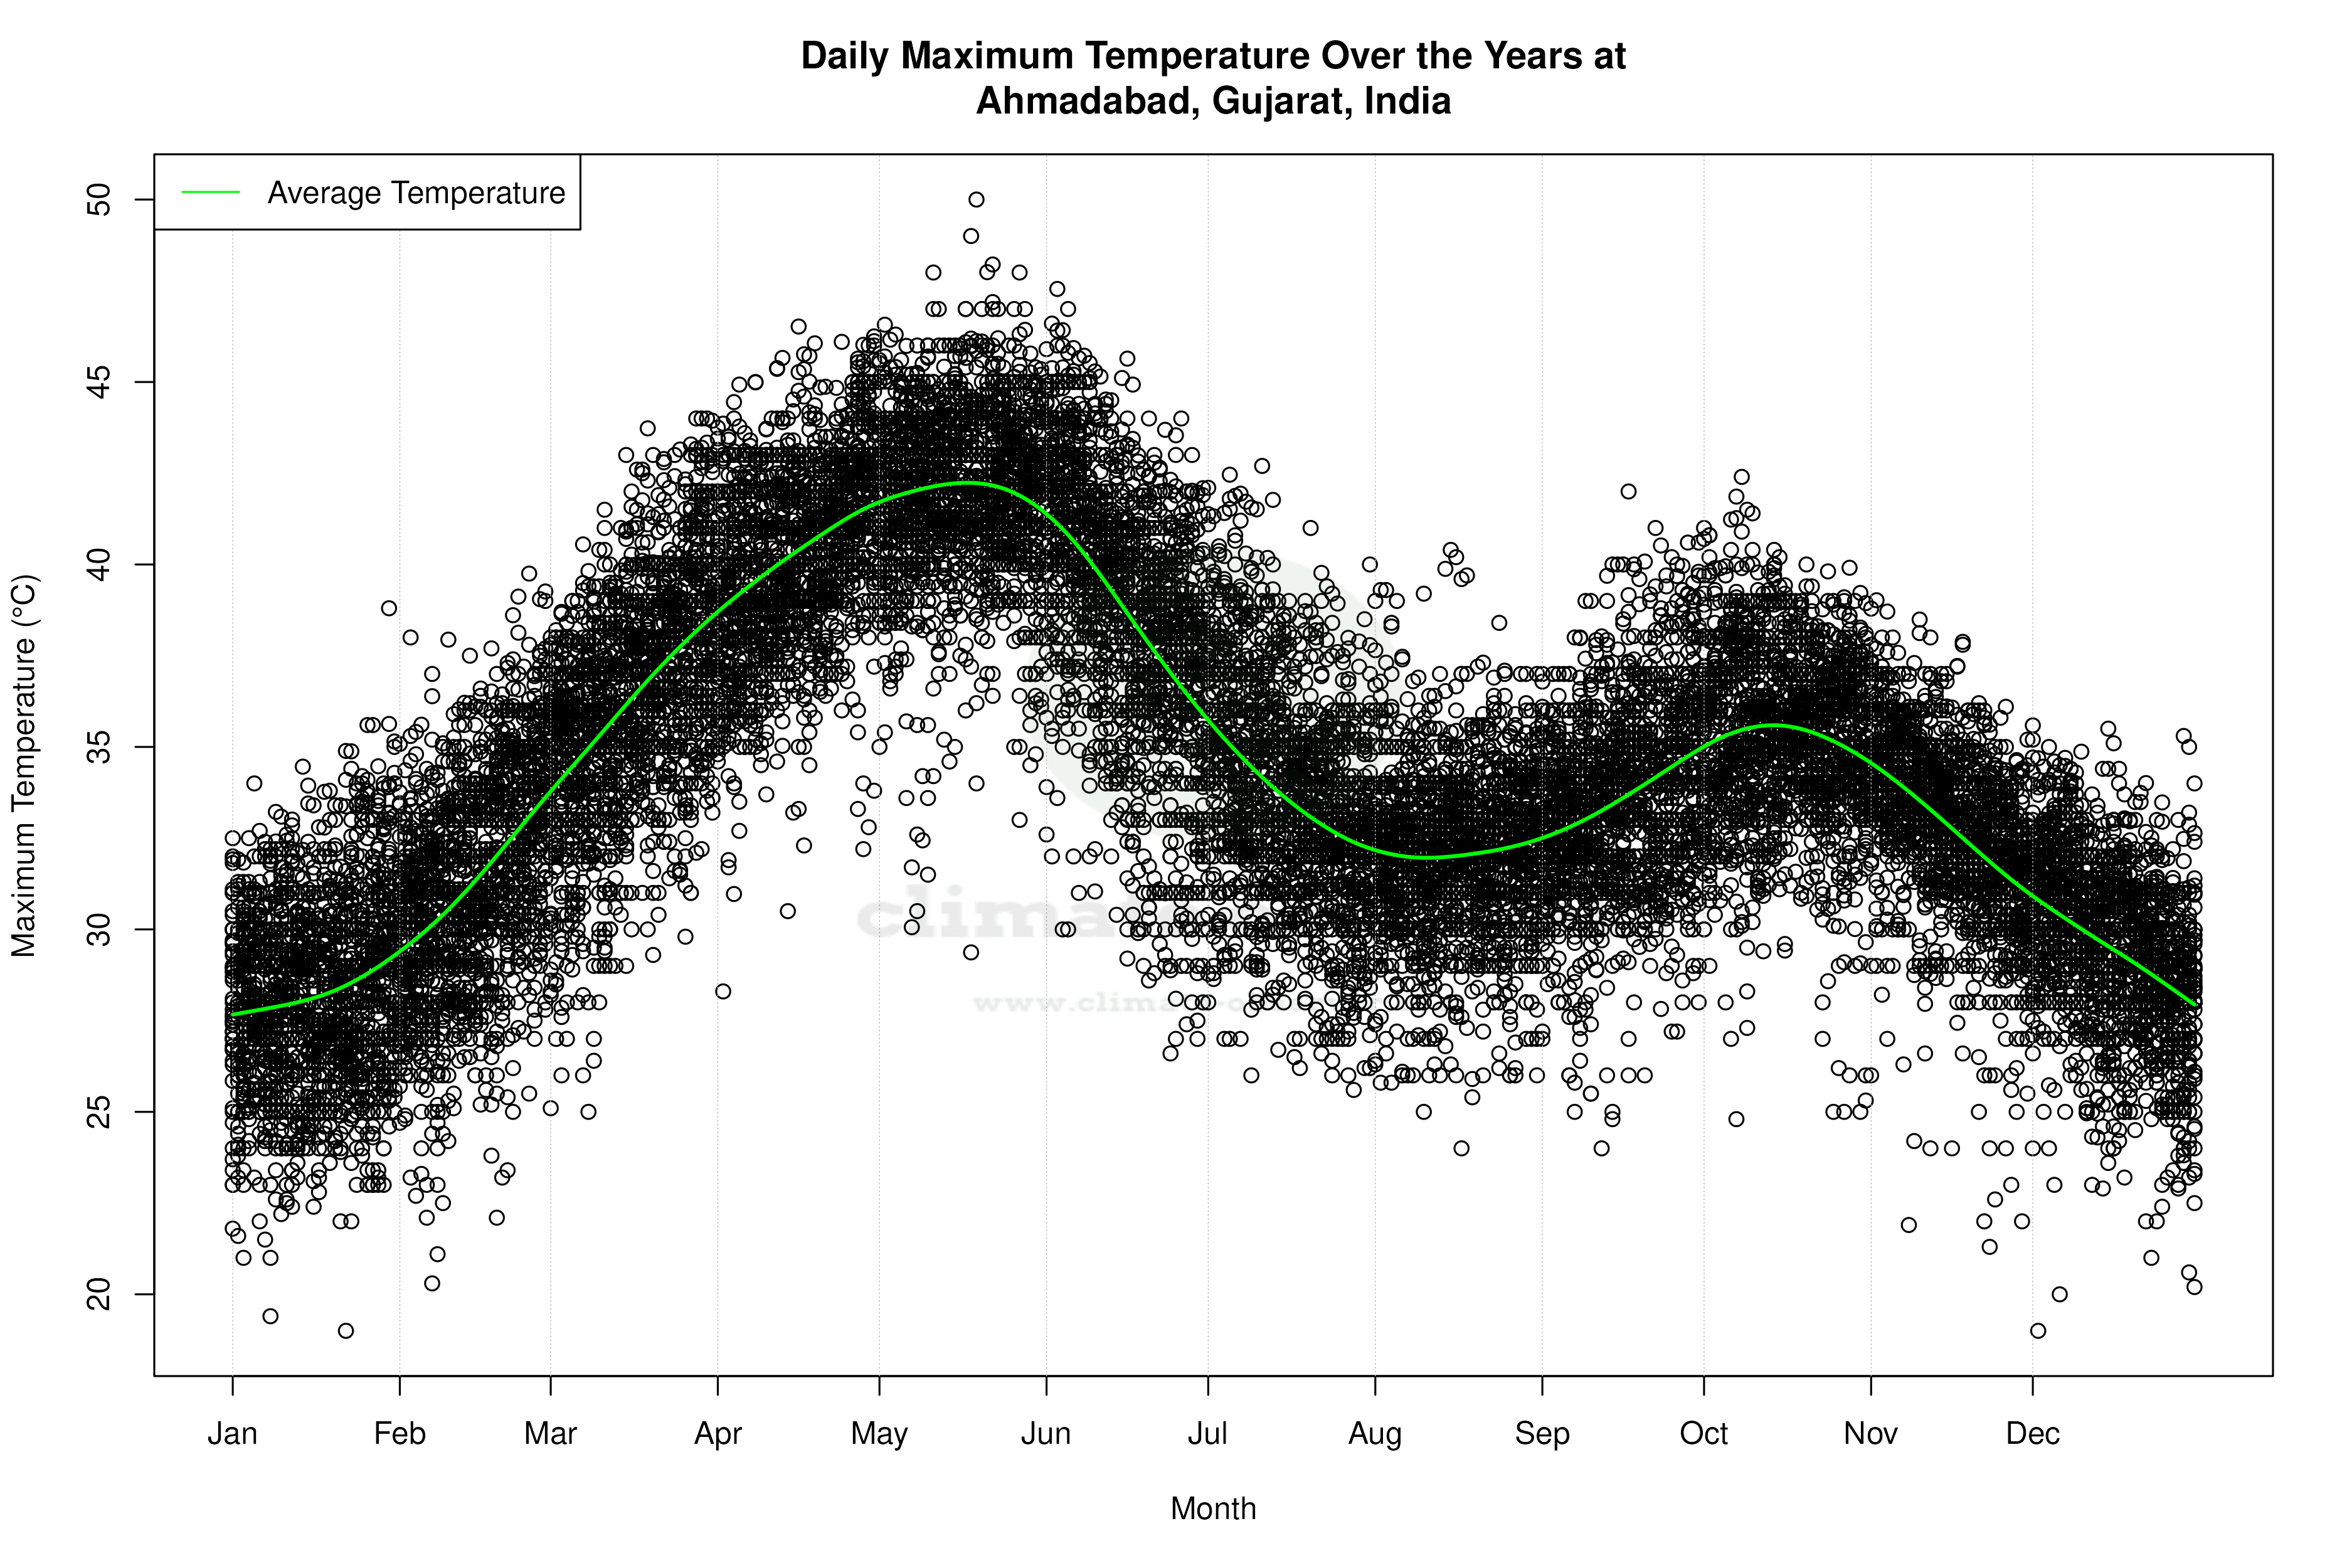


Average Max Temperature Throughout Year | 1 of 5
