Climate for Station: Thiruvananthapuram, Kerala, India
Loading live weather...
Climate Analysis & Overview
Thiruvananthapuram's climate reveals a complex interplay of warming lows and cooling highs, with a more evenly distributed precipitation pattern. The city's all-time warming trend contrasts with a recent cooling in high temperatures, suggesting nuanced climatic shifts.
Climatic Context and Geography
Thiruvananthapuram, nestled on the southwestern coast of India, enjoys a tropical monsoon climate, classified under the Köppen system as Am. This classification is characterised by heavy monsoon rains and a relatively stable temperature range. The Arabian Sea to the west and the Western Ghats to the east significantly influence local weather patterns, moderating temperatures and affecting precipitation distribution.
Temperature Trends: A Dual Narrative
The city's all-time temperature trends indicate a warming pattern, with all-time highs showing an increase of 0.44°C (0.79°F) and lows rising by 0.18°C (0.32°F). However, the past decade tells a different story for high temperatures, which have decreased by 0.43°C (0.77°F). In contrast, low temperatures have continued to rise, albeit at a slightly higher rate of 0.20°C (0.36°F). This divergence suggests a nuanced climatic evolution, possibly influenced by localised factors such as urban heat effects or changes in land use.
Precipitation Patterns: A Smoother Spread
The Precipitation Concentration Index (PCI) for Thiruvananthapuram has decreased from a baseline of 16.1 to a current value of 12.1. This indicates a more even distribution of rainfall throughout the year, moving away from concentrated heavy downpours. Such a shift could be beneficial in reducing flood risks and enhancing water management strategies, aligning with India's broader climate resilience goals.
Temperature Extremes and Records
The city's temperature records reflect its tropical setting, with a maximum recorded temperature of 39.0°C (102.2°F) and a minimum of 15.0°C (59.0°F). These extremes underscore the relatively narrow thermal range typical of coastal tropical climates, where maritime influences temper both heat and cold.
Regional Implications and Future Considerations
Thiruvananthapuram's climate profile is a microcosm of broader regional trends, where shifts in temperature and precipitation patterns are increasingly evident. The observed changes align with India's national climate objectives, which emphasise adaptation and resilience in the face of evolving climatic conditions. Recent weather events, such as intensified monsoon rains, highlight the importance of understanding these trends for future planning and infrastructure development.
Station Statistics
10-Year Trend
High: -0.73 °C/decade
Low: +0.42 °C/decade
Rain: +1.76 mm/decade
25-Year Trend
High: +0.29 °C/decade
Low: +0.54 °C/decade
Rain: +0.50 mm/decade
50-Year Trend
High: +0.42 °C/decade
Low: +0.19 °C/decade
Rain: +0.51 mm/decade
All-Time Trend
High: +0.42 °C/decade
Low: +0.18 °C/decade
Rain: +0.02 mm/decade
Percentage Above-Average Days
Last 12 Months: 42.7%
This Year: 15.0%
Precipitation Concentration Index (PCI) ℹ️
Last 12 Months: 12.3
Historical Average: 15.1
Percentile Rank of Last 12 Months ℹ️
High: 37th percentile
Low: 99th percentile
Rain: 71st percentile
Change in Variance ℹ️
High: -26.0%
Low: -21.9%
Intraday: -22.7%
Data Coverage
55.2%
First Year of Data
1901
Station Location
Historical Weather Records
| Max High | Avg High | Min High | Max Avg | Avg Avg | Min Avg | Max Low | Avg Low | Min Low | Max Precipitation | Avg Precipitation | Max Snow | Avg Snow | |
|---|---|---|---|---|---|---|---|---|---|---|---|---|---|
| Record | 39.0 °C | — | 23.9 °C | 31.9 °C | — | 20.8 °C | 29.0 °C | — | 15.0 °C | 401.5 mm | — | — | — |
| January | 37.5 °C | 32.3 °C | 26.1 °C | 31.0 °C | 27.0 °C | 23.8 °C | 27.0 °C | 22.5 °C | 15.0 °C | 167.5 mm | 0.7 mm | — | — |
| February | 38.2 °C | 33.0 °C | 26.1 °C | 31.0 °C | 27.7 °C | 23.8 °C | 26.9 °C | 23.2 °C | 18.0 °C | 108.2 mm | 0.8 mm | — | — |
| March | 37.7 °C | 33.7 °C | 27.7 °C | 31.8 °C | 28.7 °C | 24.2 °C | 27.7 °C | 24.6 °C | 19.0 °C | 80.0 mm | 1.3 mm | — | — |
| April | 39.0 °C | 33.5 °C | 28.0 °C | 31.8 °C | 28.9 °C | 24.3 °C | 29.0 °C | 25.5 °C | 20.0 °C | 129.8 mm | 3.7 mm | — | — |
| May | 38.4 °C | 32.5 °C | 26.0 °C | 31.9 °C | 28.3 °C | 23.3 °C | 29.0 °C | 25.3 °C | 20.1 °C | 277.9 mm | 7.1 mm | — | — |
| June | 37.0 °C | 30.5 °C | 24.3 °C | 31.0 °C | 26.8 °C | 22.3 °C | 28.0 °C | 24.2 °C | 20.8 °C | 154.7 mm | 10.7 mm | — | — |
| July | 34.1 °C | 30.2 °C | 23.9 °C | 29.8 °C | 26.4 °C | 20.8 °C | 26.8 °C | 23.7 °C | 20.0 °C | 283.5 mm | 6.9 mm | — | — |
| August | 35.7 °C | 30.4 °C | 24.7 °C | 29.3 °C | 26.5 °C | 23.1 °C | 26.0 °C | 23.7 °C | 19.3 °C | 112.0 mm | 4.7 mm | — | — |
| September | 35.4 °C | 30.9 °C | 24.0 °C | 29.4 °C | 26.8 °C | 23.0 °C | 26.3 °C | 23.8 °C | 20.9 °C | 140.4 mm | 5.3 mm | — | — |
| October | 37.0 °C | 30.9 °C | 25.0 °C | 29.8 °C | 26.7 °C | 22.8 °C | 26.6 °C | 23.7 °C | 20.0 °C | 401.5 mm | 8.9 mm | — | — |
| November | 37.2 °C | 31.0 °C | 24.0 °C | 29.6 °C | 26.7 °C | 22.7 °C | 26.6 °C | 23.5 °C | 19.7 °C | 205.7 mm | 6.6 mm | — | — |
| December | 36.2 °C | 32.0 °C | 26.3 °C | 30.2 °C | 27.0 °C | 22.7 °C | 26.0 °C | 22.9 °C | 18.5 °C | 184.9 mm | 2.2 mm | — | — |
Data Visualisations
Remove WatermarksCurrent Year Climate Trends vs Historical


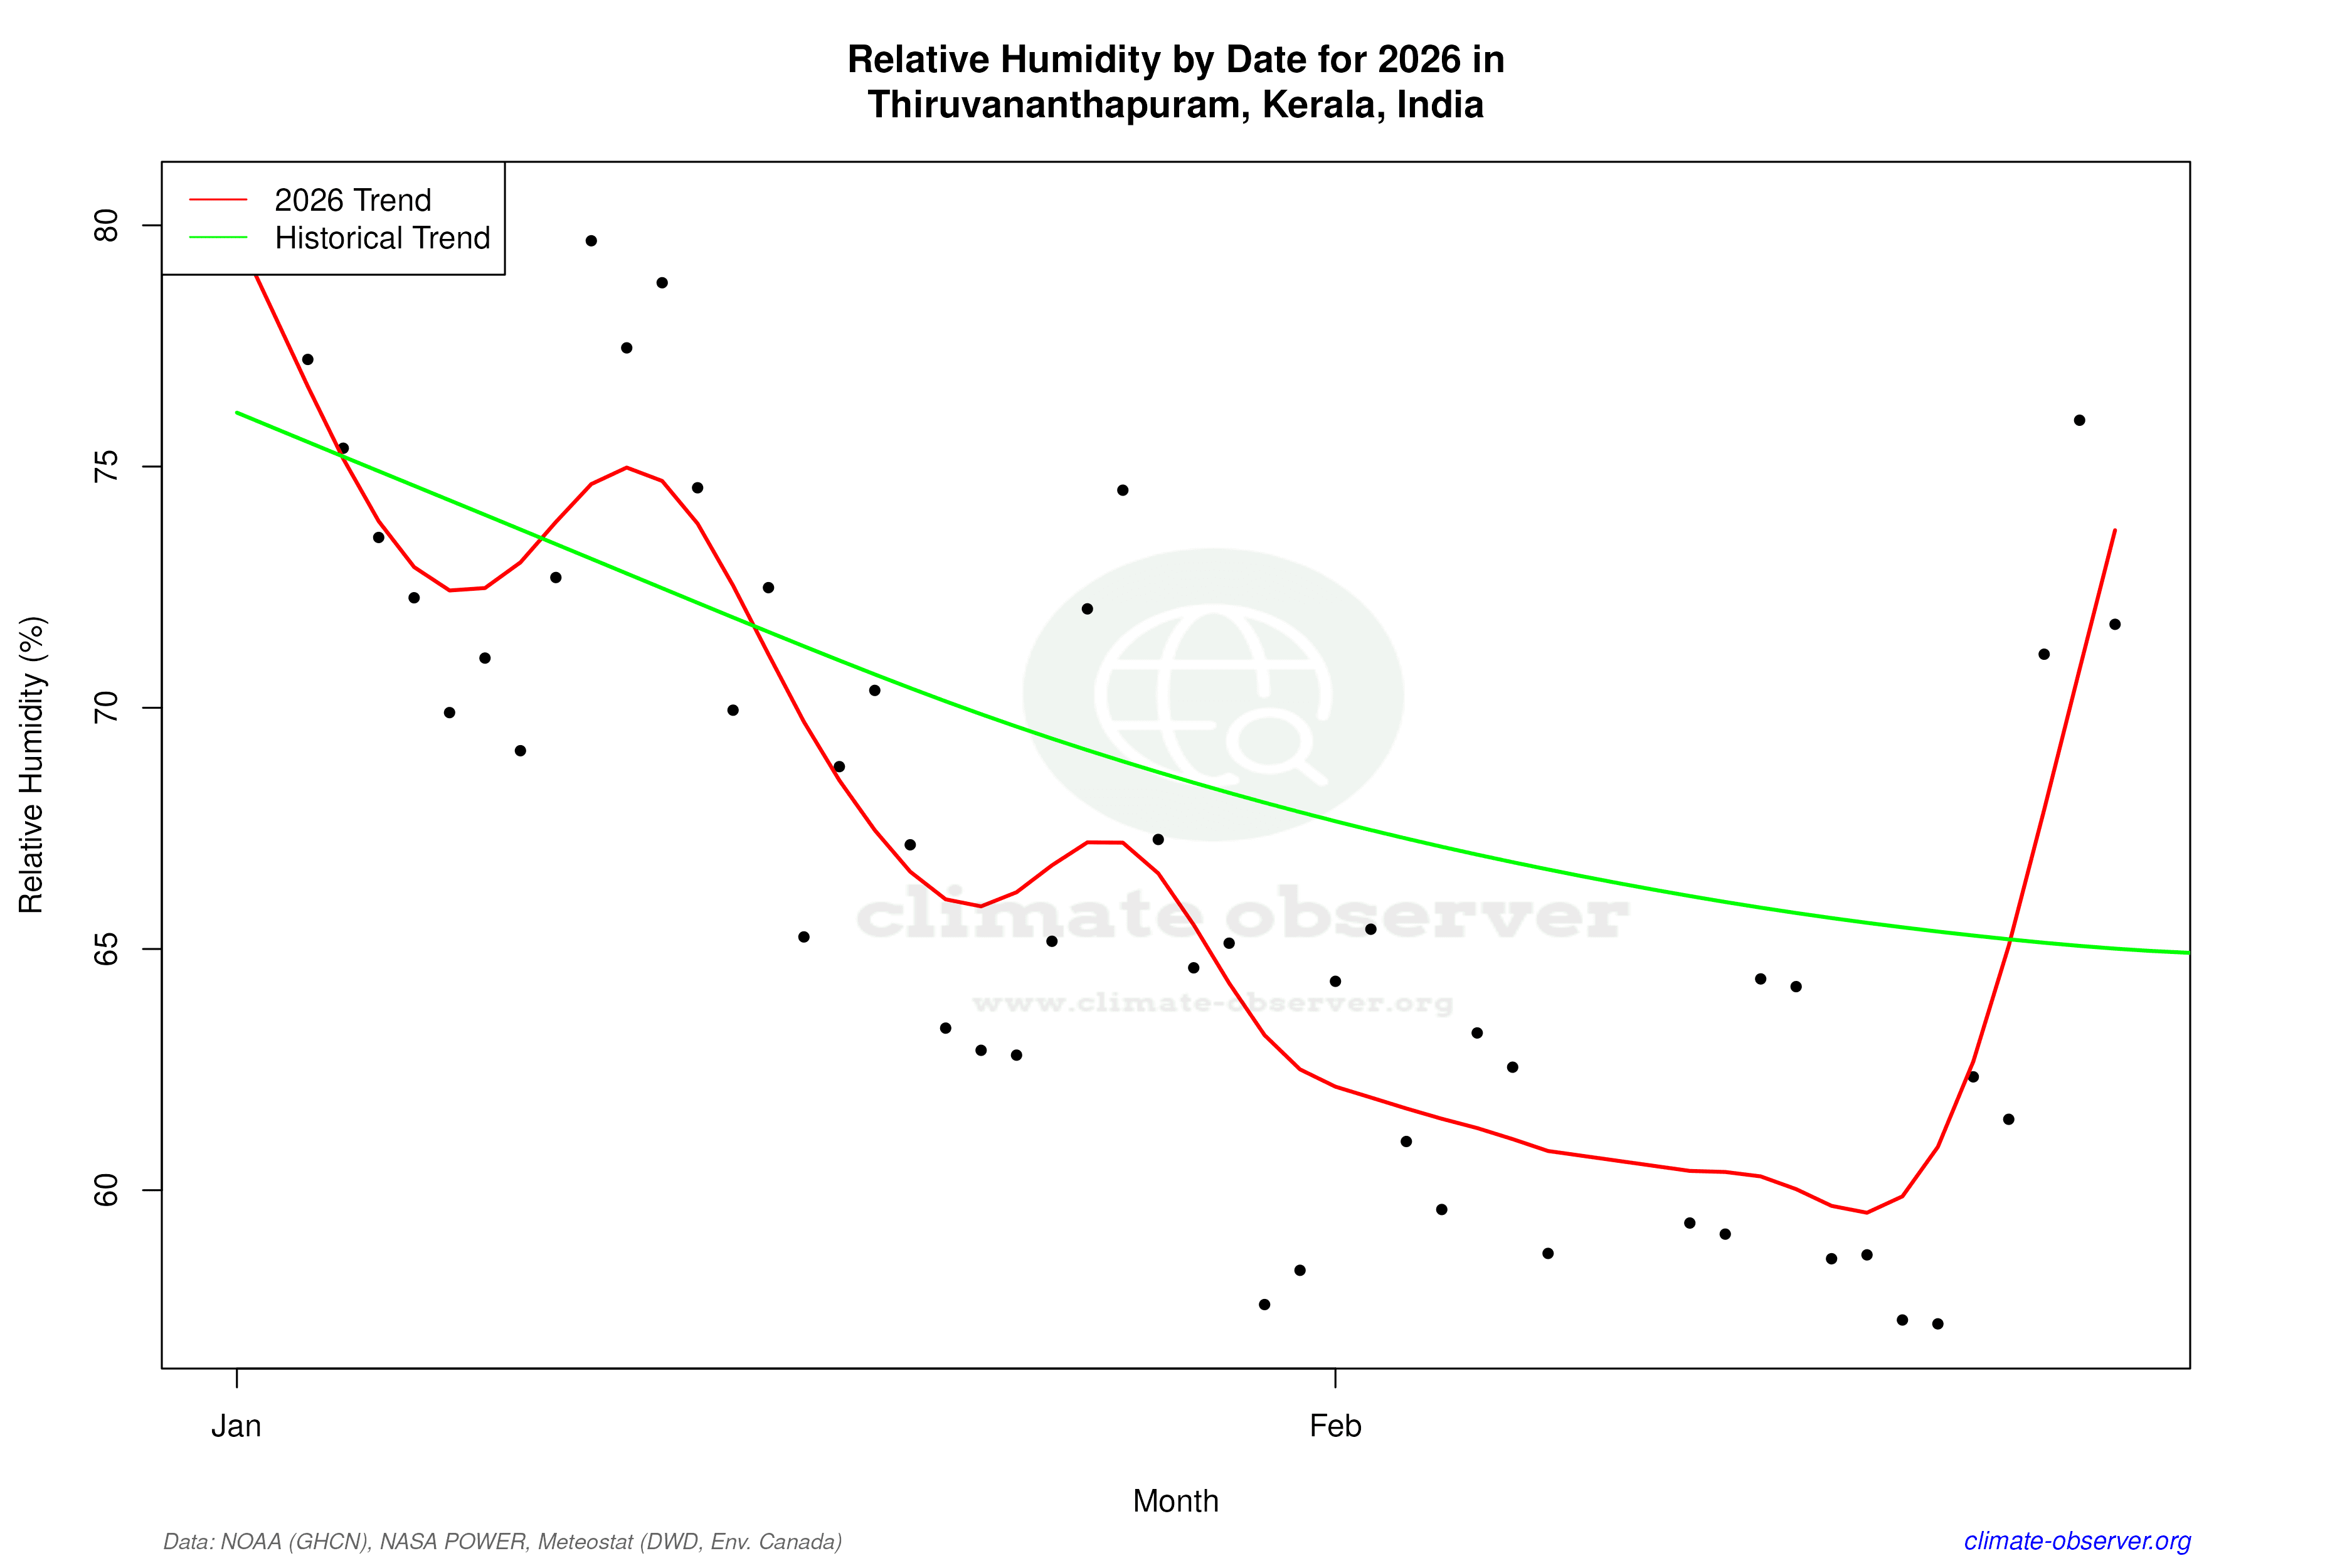

Max Temperature this Year | 1 of 6
Climate 12-Month Moving Averages


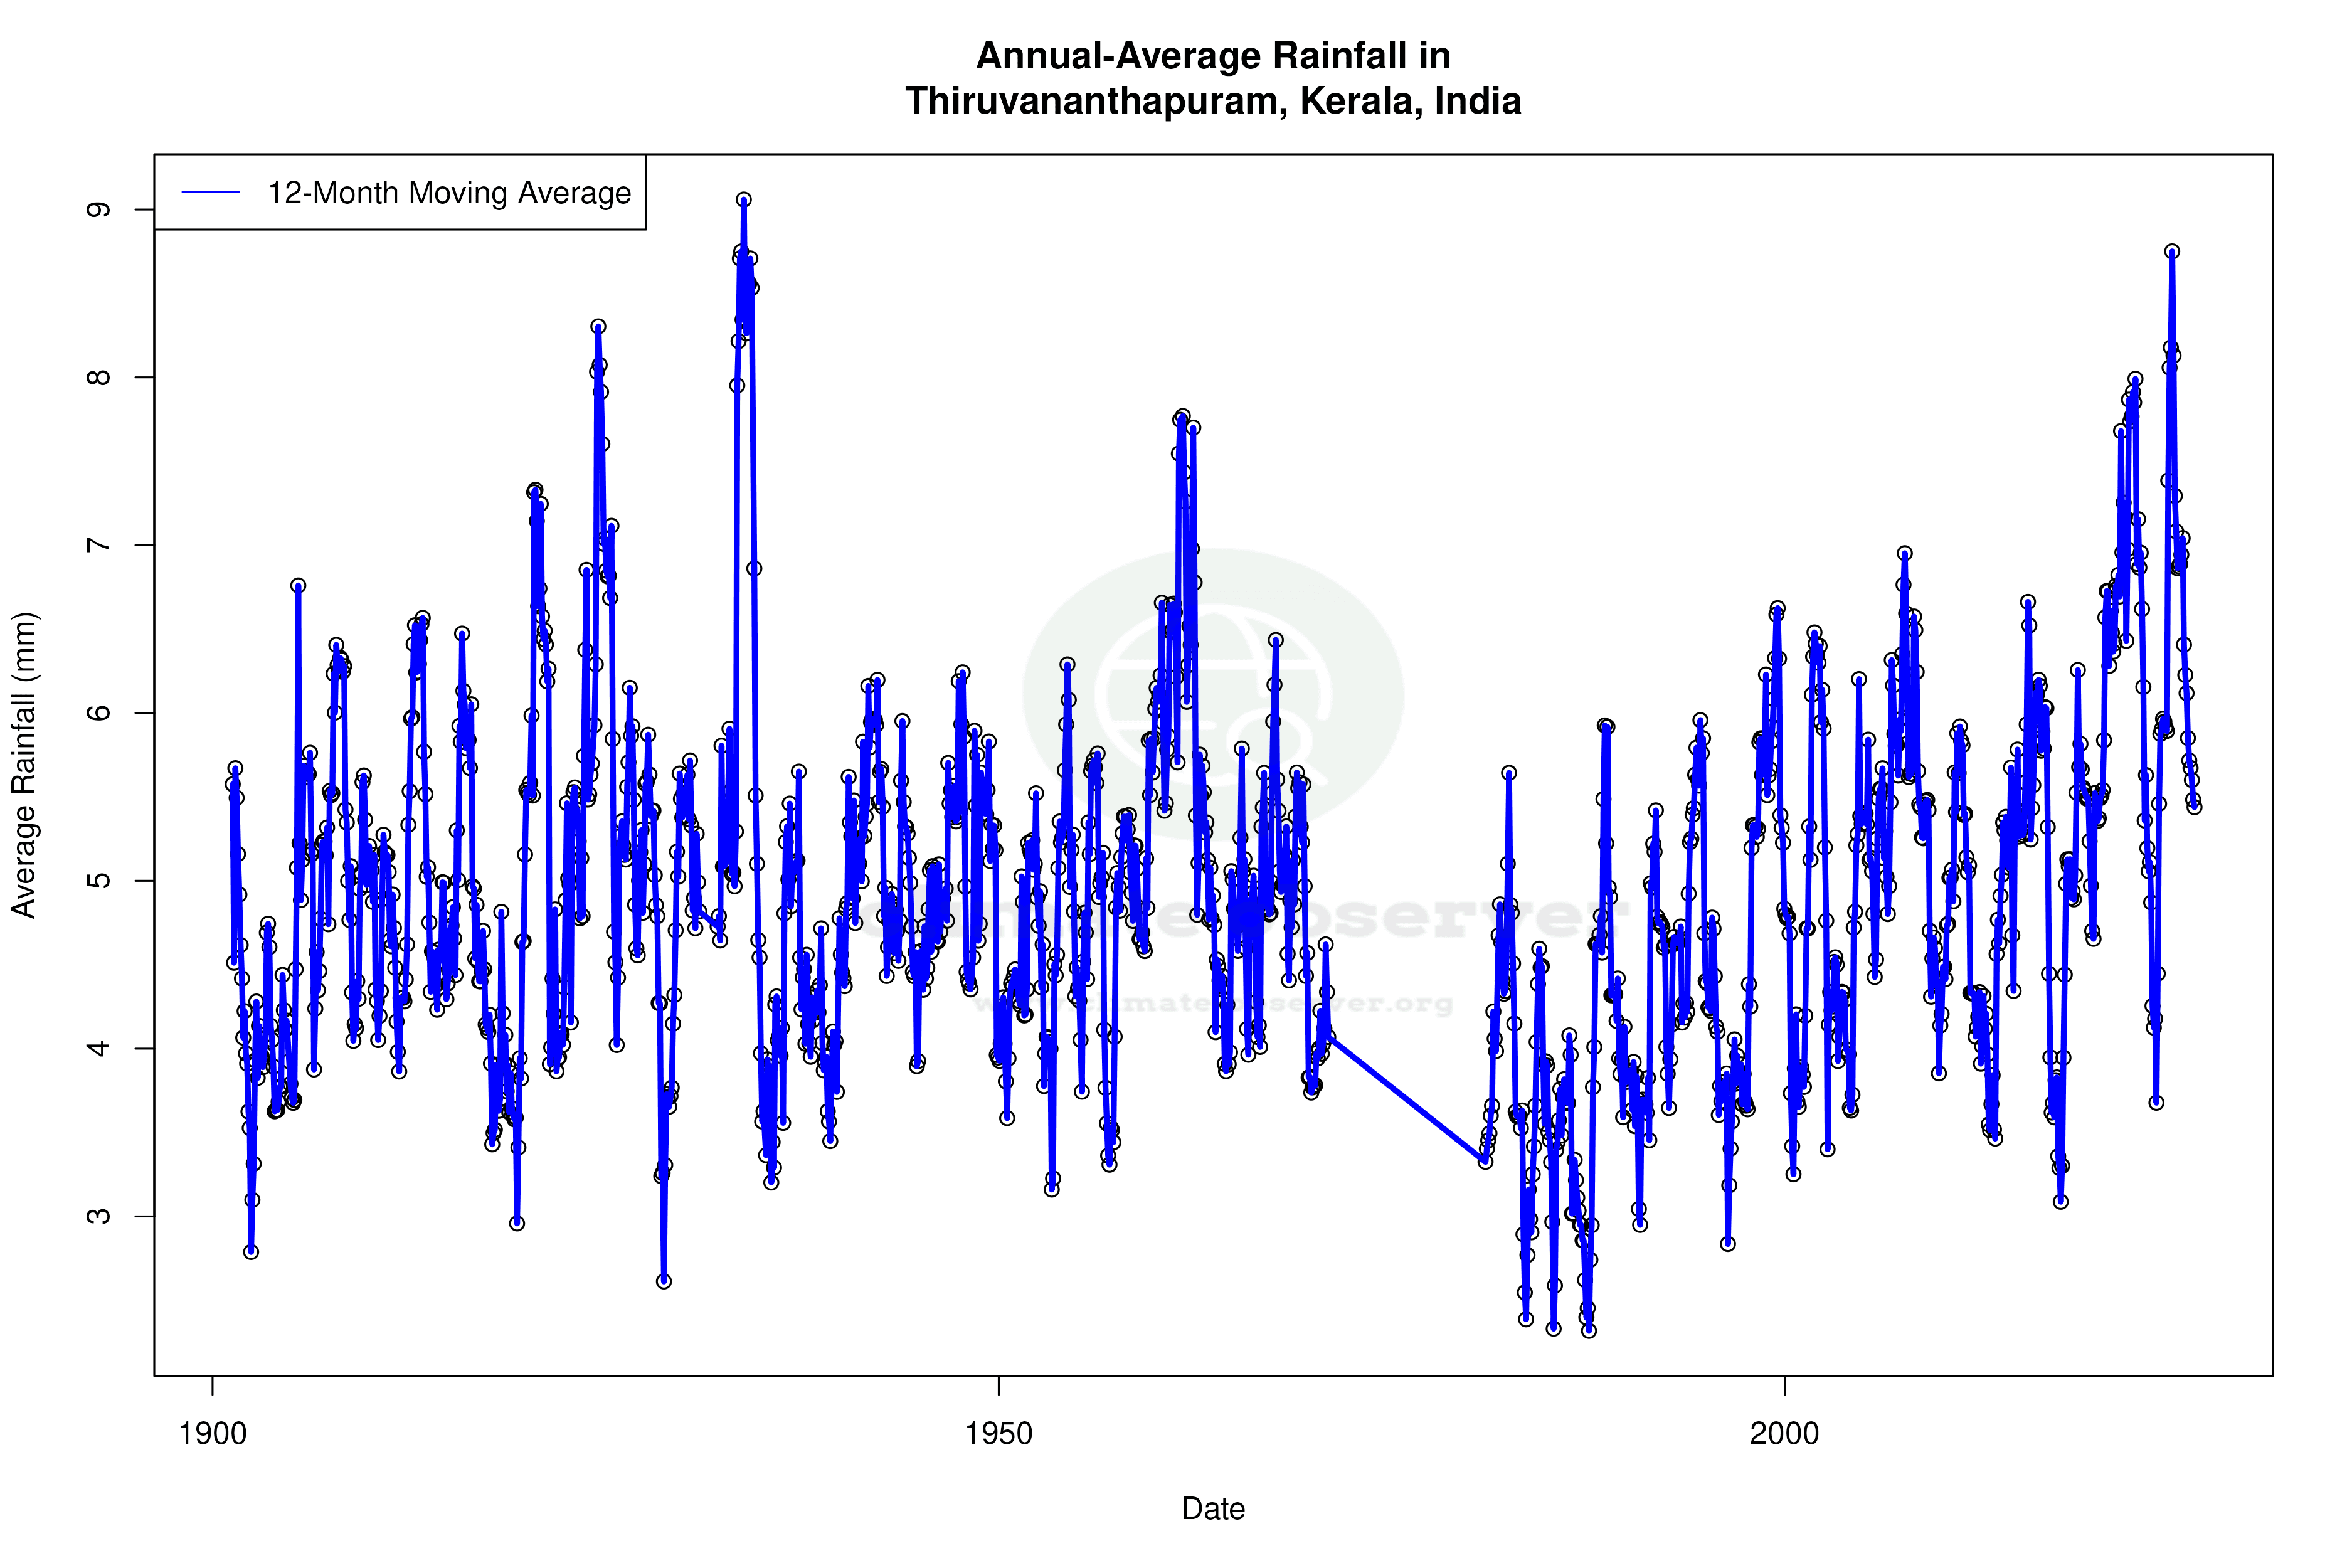


Max Temperature 12-Month MA | 1 of 6
Daily Data Points and Averages Throughout the Year


Average Max Temperature Throughout Year | 1 of 5
