Climate for Station: Bikaner, Rajasthan, India
Loading live weather...
Climate Analysis & Overview
Bikaner, situated in the arid northwest of India, is experiencing a nuanced climate evolution. While long-term data indicates a warming trend in both highs and lows, recent years have seen a cooling in maximum temperatures. Precipitation patterns have become more evenly distributed, suggesting shifts in local weather dynamics.
Desert Climate Dynamics
Bikaner, located at 28.0°N, 73.3°E, falls under the BWh category of the Köppen climate classification, indicating a hot desert climate. The Thar Desert's proximity heavily influences the region's weather, leading to extreme temperatures and sparse rainfall. The area's all-time temperature trends reveal a warming of 0.14°C (0.25°F) in highs and 0.40°C (0.72°F) in lows, suggesting a gradual increase in overall temperature. This warming aligns with broader regional climate goals aimed at understanding and mitigating the impacts of rising temperatures.
Recent Temperature Anomalies
Over the past decade, Bikaner has seen a slight cooling in maximum temperatures, with a trend of -0.00°C (-0.01°F). In contrast, minimum temperatures have risen by 0.80°C (1.44°F), indicating warmer nights. This divergence in temperature trends could be attributed to changes in local atmospheric conditions or land use, which may affect thermal retention and radiation.
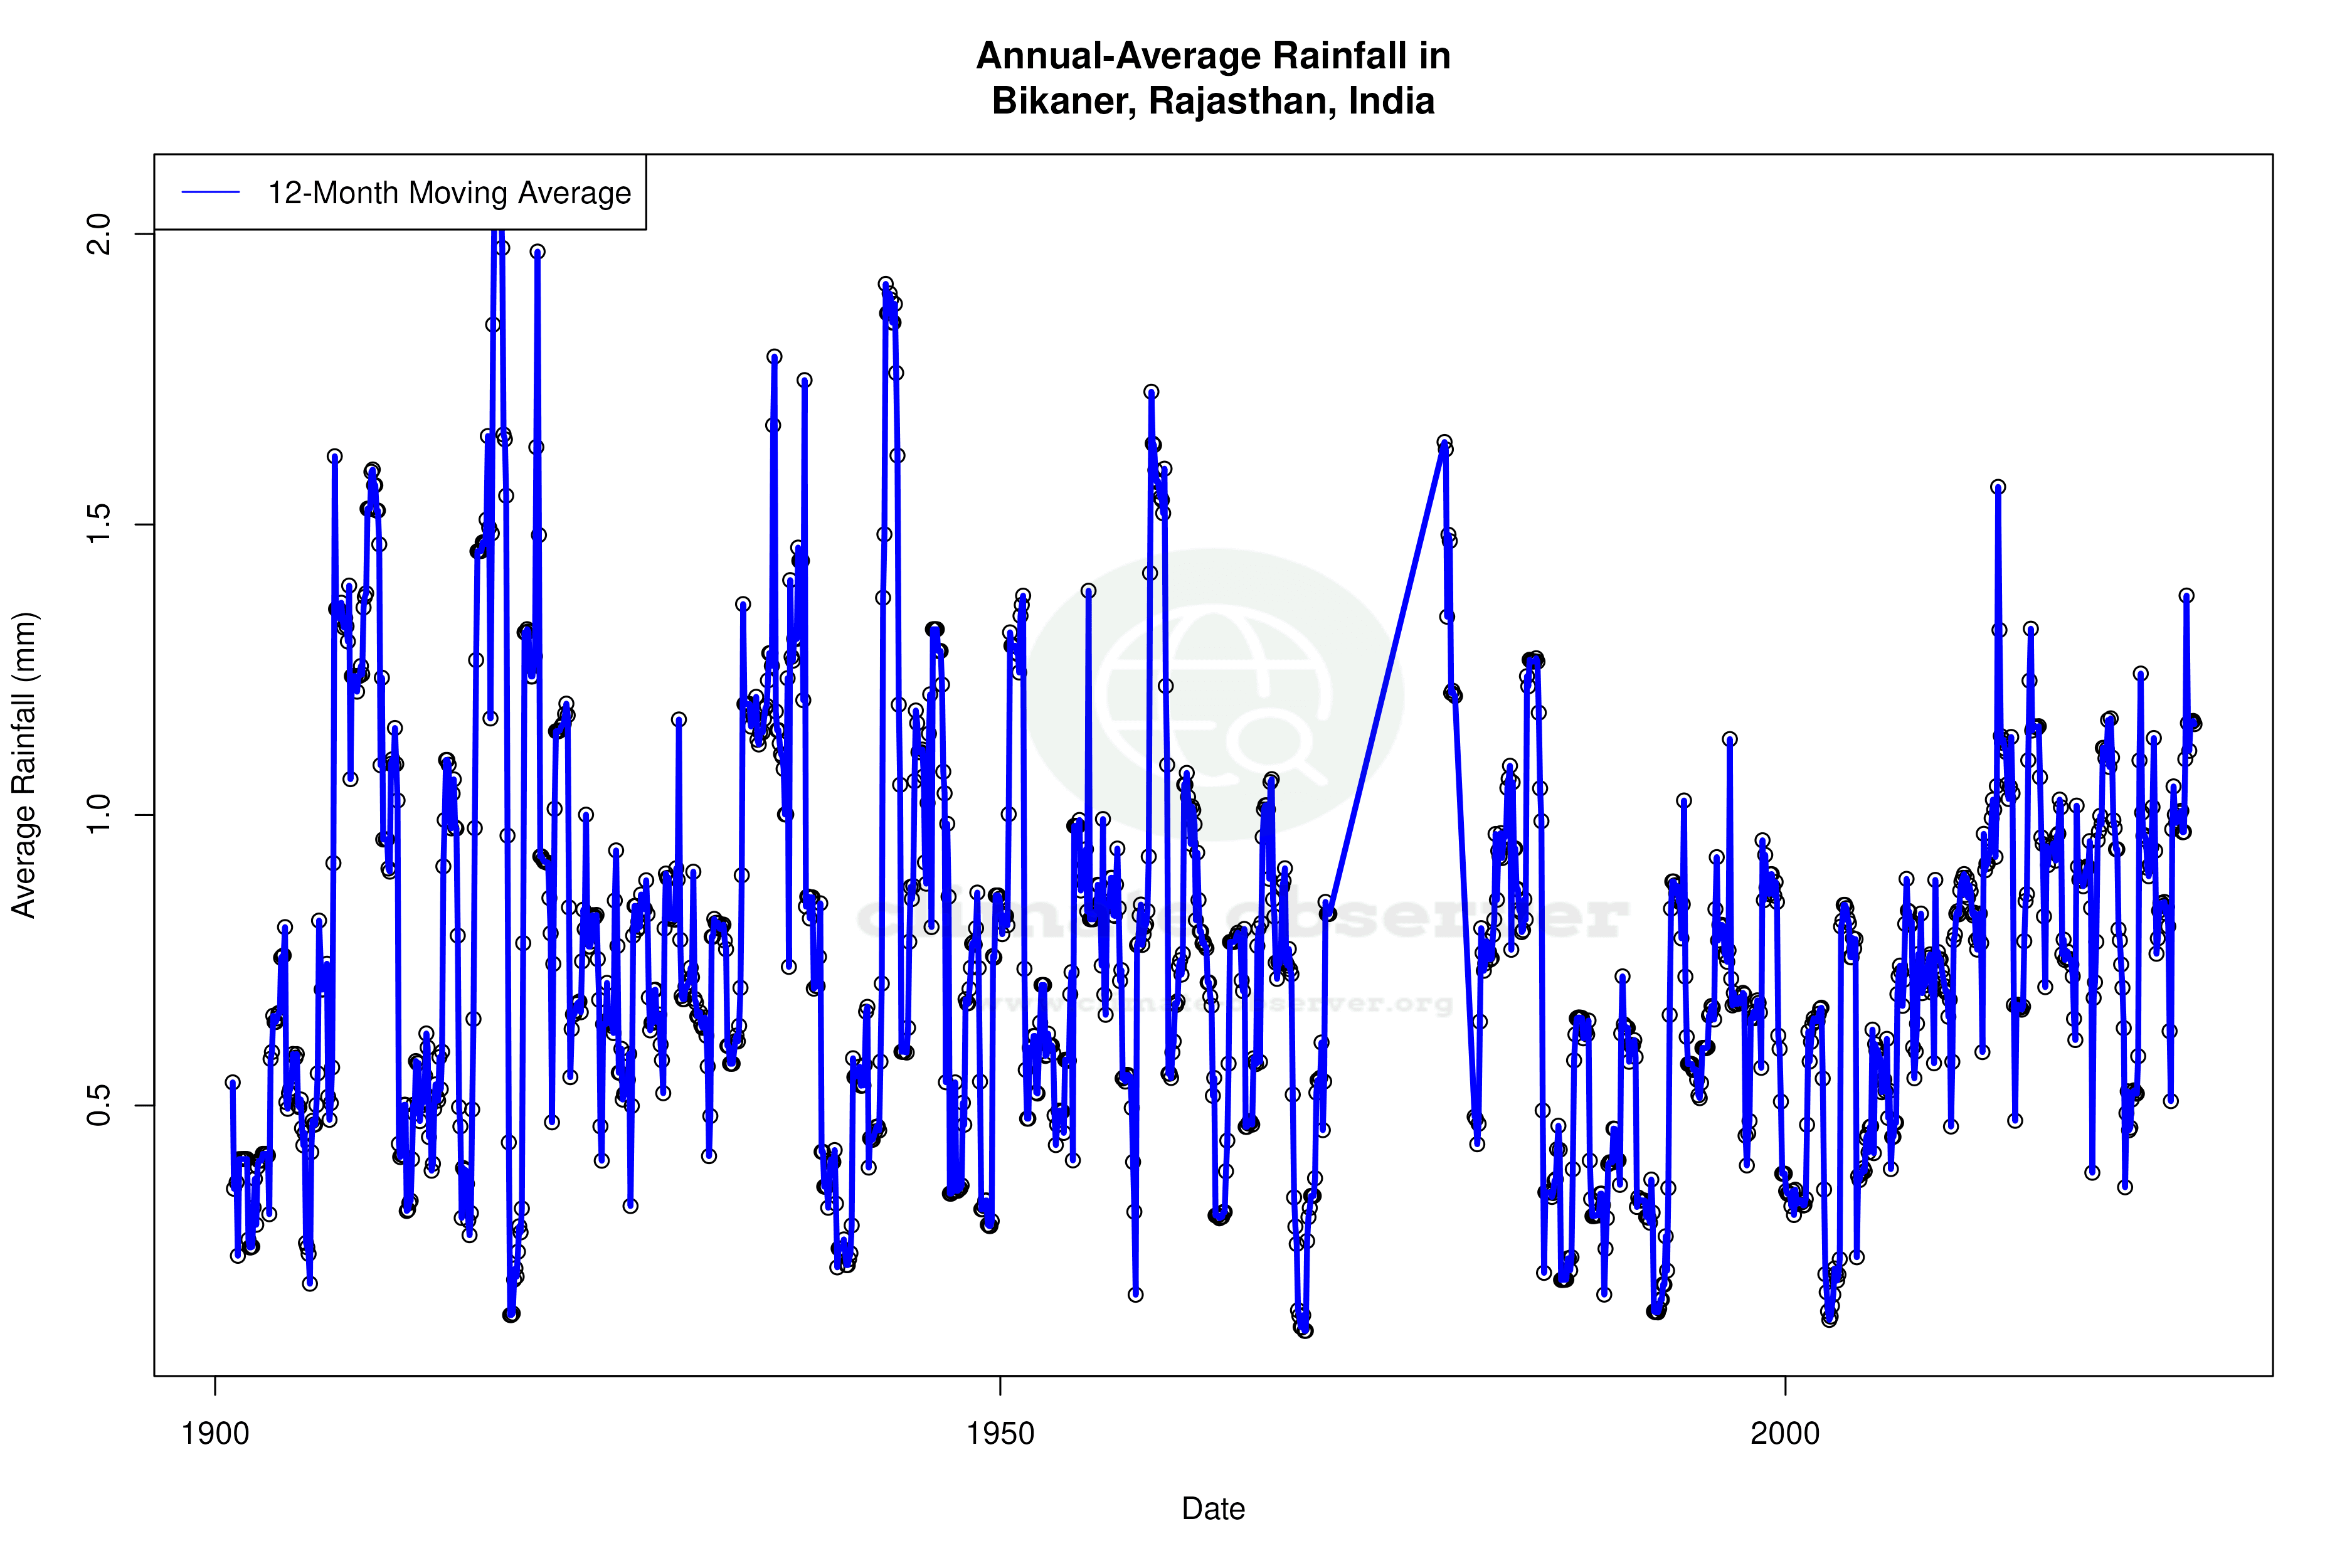
Precipitation Patterns and PCI
The Precipitation Concentration Index (PCI) for Bikaner has decreased from a baseline of 27.9 to a current value of 25.2. PCI measures how rainfall is distributed throughout the year. A decrease suggests that precipitation is becoming more evenly distributed, although it remains highly concentrated. This shift could impact water management strategies, particularly in a region where water scarcity is a critical issue.
Extreme Temperature Records
Bikaner's climate is characterised by extreme temperatures, with recorded highs reaching 49.0°C (120.2°F) and lows dropping to -2.0°C (28.4°F). These extremes are typical of desert climates, where temperature variability can be significant. Such records underscore the importance of adaptive strategies to protect local populations from heat-related stresses.
Contextual Climate Considerations
The local climate narrative is framed by India's broader efforts to address climate change impacts, such as heatwaves and water scarcity. Recent weather events, including unseasonal rainfall and temperature spikes, highlight the need for robust climate data to inform policy and planning. Bikaner's evolving climate profile serves as a microcosm of the challenges faced by arid regions globally, where balancing development and sustainability is paramount.
Station Statistics
10-Year Trend
High: +0.56 °C/decade
Low: +0.22 °C/decade
Rain: +0.24 mm/decade
25-Year Trend
High: -0.52 °C/decade
Low: +0.30 °C/decade
Rain: +0.19 mm/decade
50-Year Trend
High: +0.14 °C/decade
Low: +0.30 °C/decade
Rain: +0.05 mm/decade
All-Time Trend
High: +0.18 °C/decade
Low: +0.38 °C/decade
Rain: -0.01 mm/decade
Percentage Above-Average Days
Last 12 Months: 50.7%
This Year: 28.9%
Precipitation Concentration Index (PCI) ℹ️
Last 12 Months: 31.8
Historical Average: 33.1
Percentile Rank of Last 12 Months ℹ️
High: 69th percentile
Low: 91st percentile
Rain: 83rd percentile
Change in Variance ℹ️
High: +5.4%
Low: -9.9%
Intraday: -19.4%
Data Coverage
56.4%
First Year of Data
1903
Station Location
Historical Weather Records
| Max High | Avg High | Min High | Max Avg | Avg Avg | Min Avg | Max Low | Avg Low | Min Low | Max Precipitation | Avg Precipitation | Max Snow | Avg Snow | |
|---|---|---|---|---|---|---|---|---|---|---|---|---|---|
| Record | 49.0 °C | — | 12.5 °C | 42.5 °C | — | 5.4 °C | 35.2 °C | — | -2.0 °C | 165.6 mm | — | — | — |
| January | 32.9 °C | 23.4 °C | 12.5 °C | 23.8 °C | 14.8 °C | 5.4 °C | 16.6 °C | 7.4 °C | -2.0 °C | 25.4 mm | 0.1 mm | — | — |
| February | 36.8 °C | 27.1 °C | 16.0 °C | 28.3 °C | 18.8 °C | 8.0 °C | 21.5 °C | 10.9 °C | -2.0 °C | 54.4 mm | 0.2 mm | — | — |
| March | 43.2 °C | 33.0 °C | 17.0 °C | 34.8 °C | 24.9 °C | 12.2 °C | 26.6 °C | 16.7 °C | 5.0 °C | 44.6 mm | 0.2 mm | — | — |
| April | 45.3 °C | 38.7 °C | 24.0 °C | 36.6 °C | 30.8 °C | 18.6 °C | 31.1 °C | 22.5 °C | 11.4 °C | 31.0 mm | 0.2 mm | — | — |
| May | 49.0 °C | 42.2 °C | 28.8 °C | 42.1 °C | 35.0 °C | 23.9 °C | 34.4 °C | 27.2 °C | 16.9 °C | 51.1 mm | 0.4 mm | — | — |
| June | 48.3 °C | 41.9 °C | 28.0 °C | 42.5 °C | 35.5 °C | 23.3 °C | 35.2 °C | 29.5 °C | 19.0 °C | 63.5 mm | 1.0 mm | — | — |
| July | 49.0 °C | 38.9 °C | 28.3 °C | 40.0 °C | 33.1 °C | 24.5 °C | 34.6 °C | 28.8 °C | 20.0 °C | 134.1 mm | 2.8 mm | — | — |
| August | 45.0 °C | 37.4 °C | 28.2 °C | 38.2 °C | 31.8 °C | 22.5 °C | 33.0 °C | 27.4 °C | 19.0 °C | 142.0 mm | 2.5 mm | — | — |
| September | 45.0 °C | 37.4 °C | 25.0 °C | 38.8 °C | 31.0 °C | 23.7 °C | 31.6 °C | 25.5 °C | 16.6 °C | 165.6 mm | 1.3 mm | — | — |
| October | 41.8 °C | 36.2 °C | 24.5 °C | 34.8 °C | 28.0 °C | 18.2 °C | 28.3 °C | 20.4 °C | 8.9 °C | 95.8 mm | 0.2 mm | — | — |
| November | 38.5 °C | 30.9 °C | 17.8 °C | 31.5 °C | 21.8 °C | 12.8 °C | 23.2 °C | 14.1 °C | 2.2 °C | 41.9 mm | 0.1 mm | — | — |
| December | 33.5 °C | 25.6 °C | 14.0 °C | 27.1 °C | 16.2 °C | 7.3 °C | 17.3 °C | 8.9 °C | -1.0 °C | 28.6 mm | 0.1 mm | — | — |
Data Visualisations
Remove WatermarksCurrent Year Climate Trends vs Historical


Max Temperature this Year | 1 of 6
Climate 12-Month Moving Averages


Max Temperature 12-Month MA | 1 of 6
Daily Data Points and Averages Throughout the Year
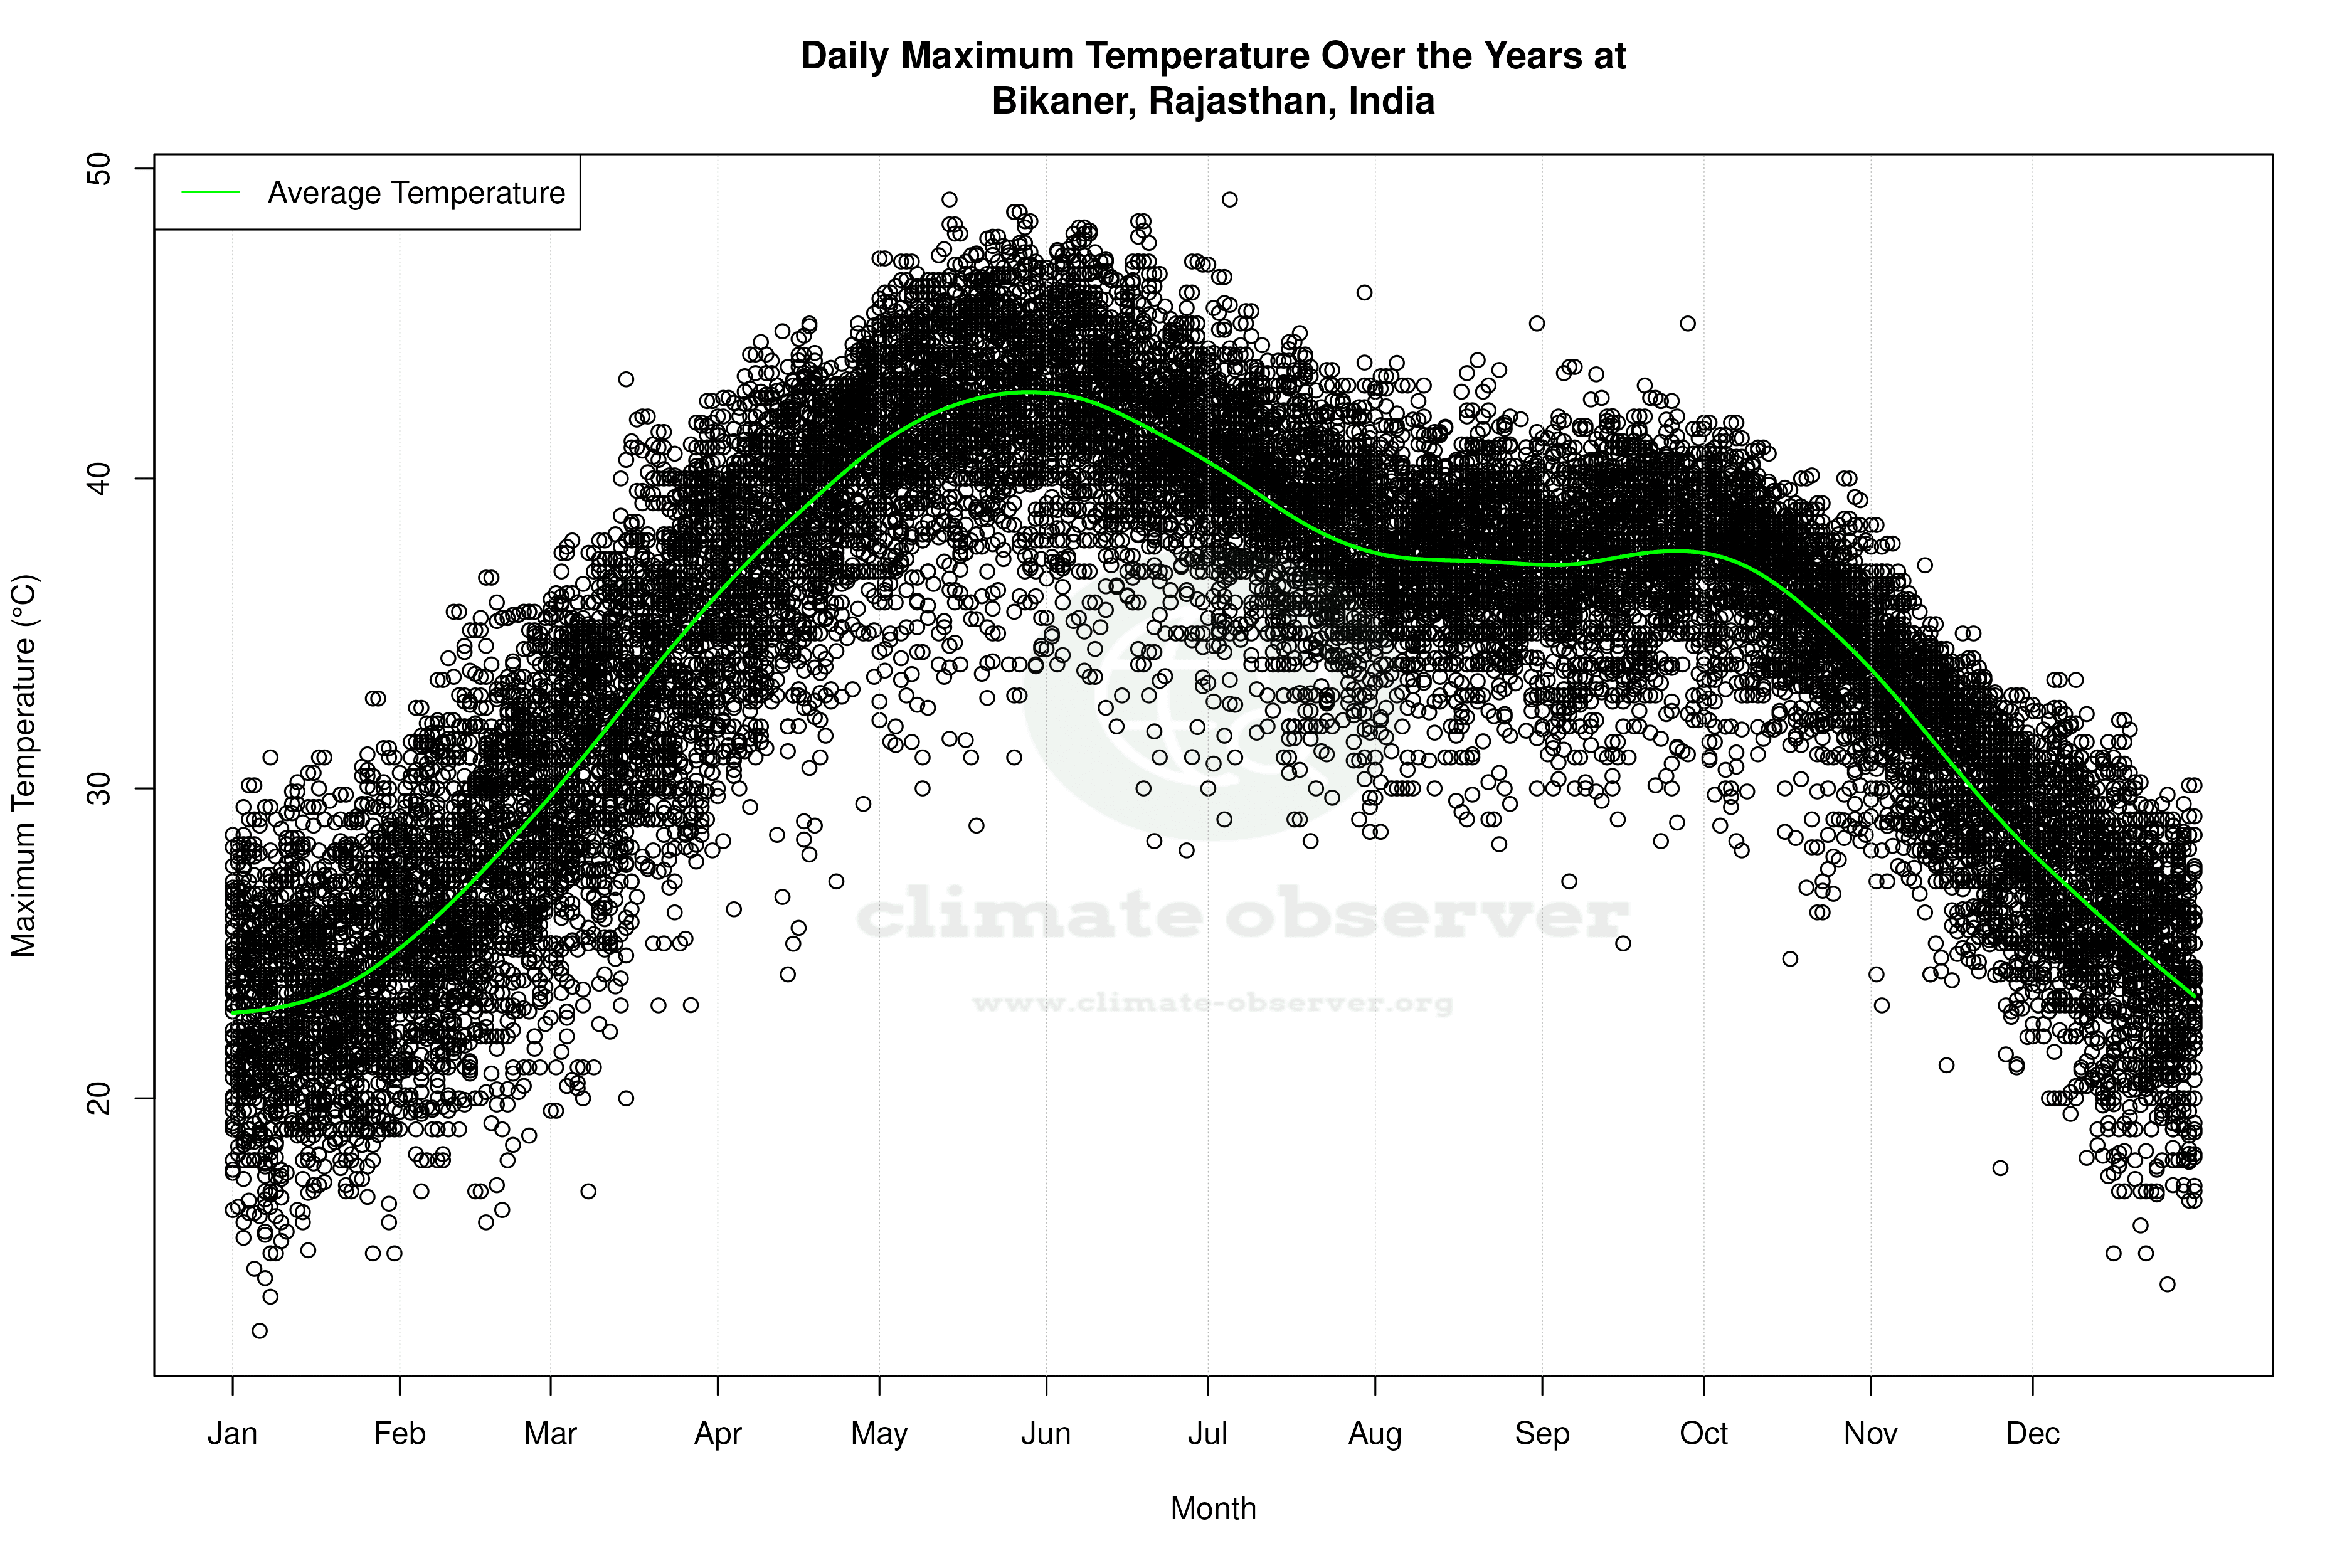


Average Max Temperature Throughout Year | 1 of 5
