Climate for Station: Gorakhpur, Uttar Pradesh, India
Loading live weather...
Climate Analysis & Overview
Gorakhpur's climate has experienced a notable cooling trend in both high and low temperatures over the long term, with a significant decrease in precipitation concentration, suggesting a more evenly distributed rainfall pattern. This shift occurs against the backdrop of India's broader climate goals, aiming to mitigate extreme weather impacts.
Geographical Context and Climate Classification
Gorakhpur, located at 26.75°N, 83.367°E, sits within the humid subtropical climate zone, as classified by the Köppen climate system. This region is characterised by hot summers and mild winters, influenced by its proximity to the Himalayan foothills and the Ganges River basin. These geographical features contribute to the area's monsoon-driven weather patterns, which significantly affect local climate dynamics.
Cooling Trends in Temperature Extremes
Over the past decade, Gorakhpur has experienced a cooling trend in high temperatures, with a decrease of 0.78°C (1.40°F). This contrasts with the long-term all-time trend, which shows a more modest cooling of 0.38°C (0.68°F) in high temperatures. Interestingly, while the recent trend for low temperatures indicates a warming of 0.66°C (1.19°F), the all-time data reveals a slight cooling of 0.05°C (0.09°F). These trends highlight a complex thermal dynamic, potentially linked to broader regional climatic shifts and localised environmental changes.
Precipitation Patterns: A Shift Towards Evenness
The Precipitation Concentration Index (PCI) for Gorakhpur has seen a significant decrease from a baseline of 24.88 to a current value of 17.89. The PCI measures how concentrated precipitation events are; a decrease indicates that rainfall is now more evenly distributed throughout the year. This change may reduce the risk of flooding associated with intense rainfall events, aligning with India's regional climate goals to enhance resilience against extreme weather.
Temperature Extremes: Records in Perspective
Gorakhpur's historical temperature records reveal an absolute maximum of 49.7°C (121.5°F) and a minimum of 0.0°C (32.0°F). These extremes underscore the region's susceptibility to temperature fluctuations, which can have profound implications for agriculture and water resources. As climate patterns evolve, understanding these records helps contextualise potential future risks and opportunities for adaptation.
Regional Climate Goals and Implications
India's commitment to addressing climate change is evident in its national policies aimed at reducing greenhouse gas emissions and enhancing adaptive capacities. Gorakhpur's climate profile, with its cooling trends and more evenly distributed rainfall, reflects these broader objectives. As the nation continues to pursue sustainable development, local climate data serves as a critical tool for informing policy and fostering resilience in vulnerable regions like Gorakhpur.
Station Statistics
10-Year Trend
High: -0.55 °C/decade
Low: +0.77 °C/decade
Rain: -0.25 mm/decade
25-Year Trend
High: -0.18 °C/decade
Low: +0.16 °C/decade
Rain: +0.27 mm/decade
50-Year Trend
High: -0.37 °C/decade
Low: -0.02 °C/decade
Rain: +0.35 mm/decade
All-Time Trend
High: -0.37 °C/decade
Low: -0.04 °C/decade
Rain: -0.00 mm/decade
Percentage Above-Average Days
Last 12 Months: 47.9%
This Year: 59.9%
Precipitation Concentration Index (PCI) ℹ️
Last 12 Months: 22.0
Historical Average: 24.8
Percentile Rank of Last 12 Months ℹ️
High: 21st percentile
Low: 81st percentile
Rain: 38th percentile
Change in Variance ℹ️
High: +10.2%
Low: +0.2%
Intraday: -20.7%
Data Coverage
54.7%
First Year of Data
1901
Station Location
Historical Weather Records
| Max High | Avg High | Min High | Max Avg | Avg Avg | Min Avg | Max Low | Avg Low | Min Low | Max Precipitation | Avg Precipitation | Max Snow | Avg Snow | |
|---|---|---|---|---|---|---|---|---|---|---|---|---|---|
| Record | 49.7 °C | — | 10.0 °C | 40.8 °C | — | 7.2 °C | 35.6 °C | — | 0.0 °C | 284.5 mm | — | — | — |
| January | 32.5 °C | 22.6 °C | 10.0 °C | 23.9 °C | 15.1 °C | 7.2 °C | 16.4 °C | 8.8 °C | 0.0 °C | 42.2 mm | 0.4 mm | — | — |
| February | 36.2 °C | 27.1 °C | 15.7 °C | 27.8 °C | 19.0 °C | 11.4 °C | 20.3 °C | 11.7 °C | 3.0 °C | 58.2 mm | 0.5 mm | — | — |
| March | 46.0 °C | 33.4 °C | 21.0 °C | 33.8 °C | 24.9 °C | 16.0 °C | 26.0 °C | 16.6 °C | 8.0 °C | 35.8 mm | 0.3 mm | — | — |
| April | 46.1 °C | 38.8 °C | 22.9 °C | 36.3 °C | 30.4 °C | 21.1 °C | 29.3 °C | 21.9 °C | 13.0 °C | 51.8 mm | 0.3 mm | — | — |
| May | 47.5 °C | 39.7 °C | 28.4 °C | 40.8 °C | 32.2 °C | 22.1 °C | 33.0 °C | 25.2 °C | 17.0 °C | 110.2 mm | 1.3 mm | — | — |
| June | 49.7 °C | 38.6 °C | 25.5 °C | 40.1 °C | 32.3 °C | 21.0 °C | 35.6 °C | 27.3 °C | 18.8 °C | 208.5 mm | 5.2 mm | — | — |
| July | 43.2 °C | 34.1 °C | 25.5 °C | 39.1 °C | 29.9 °C | 23.0 °C | 32.5 °C | 26.4 °C | 20.9 °C | 260.1 mm | 11.5 mm | — | — |
| August | 40.4 °C | 33.4 °C | 26.5 °C | 34.0 °C | 29.4 °C | 24.8 °C | 29.2 °C | 25.9 °C | 20.0 °C | 284.5 mm | 10.5 mm | — | — |
| September | 39.3 °C | 32.9 °C | 23.5 °C | 33.9 °C | 28.6 °C | 22.2 °C | 28.9 °C | 24.8 °C | 16.6 °C | 239.5 mm | 7.5 mm | — | — |
| October | 37.4 °C | 32.5 °C | 23.7 °C | 32.3 °C | 26.2 °C | 19.7 °C | 26.4 °C | 20.6 °C | 12.3 °C | 160.0 mm | 1.9 mm | — | — |
| November | 36.4 °C | 29.4 °C | 19.0 °C | 30.0 °C | 21.4 °C | 14.4 °C | 22.0 °C | 14.6 °C | 6.9 °C | 55.9 mm | 0.1 mm | — | — |
| December | 32.0 °C | 24.6 °C | 11.8 °C | 23.9 °C | 16.6 °C | 8.3 °C | 17.4 °C | 10.1 °C | 0.0 °C | 50.0 mm | 0.2 mm | — | — |
Data Visualisations
Remove WatermarksCurrent Year Climate Trends vs Historical


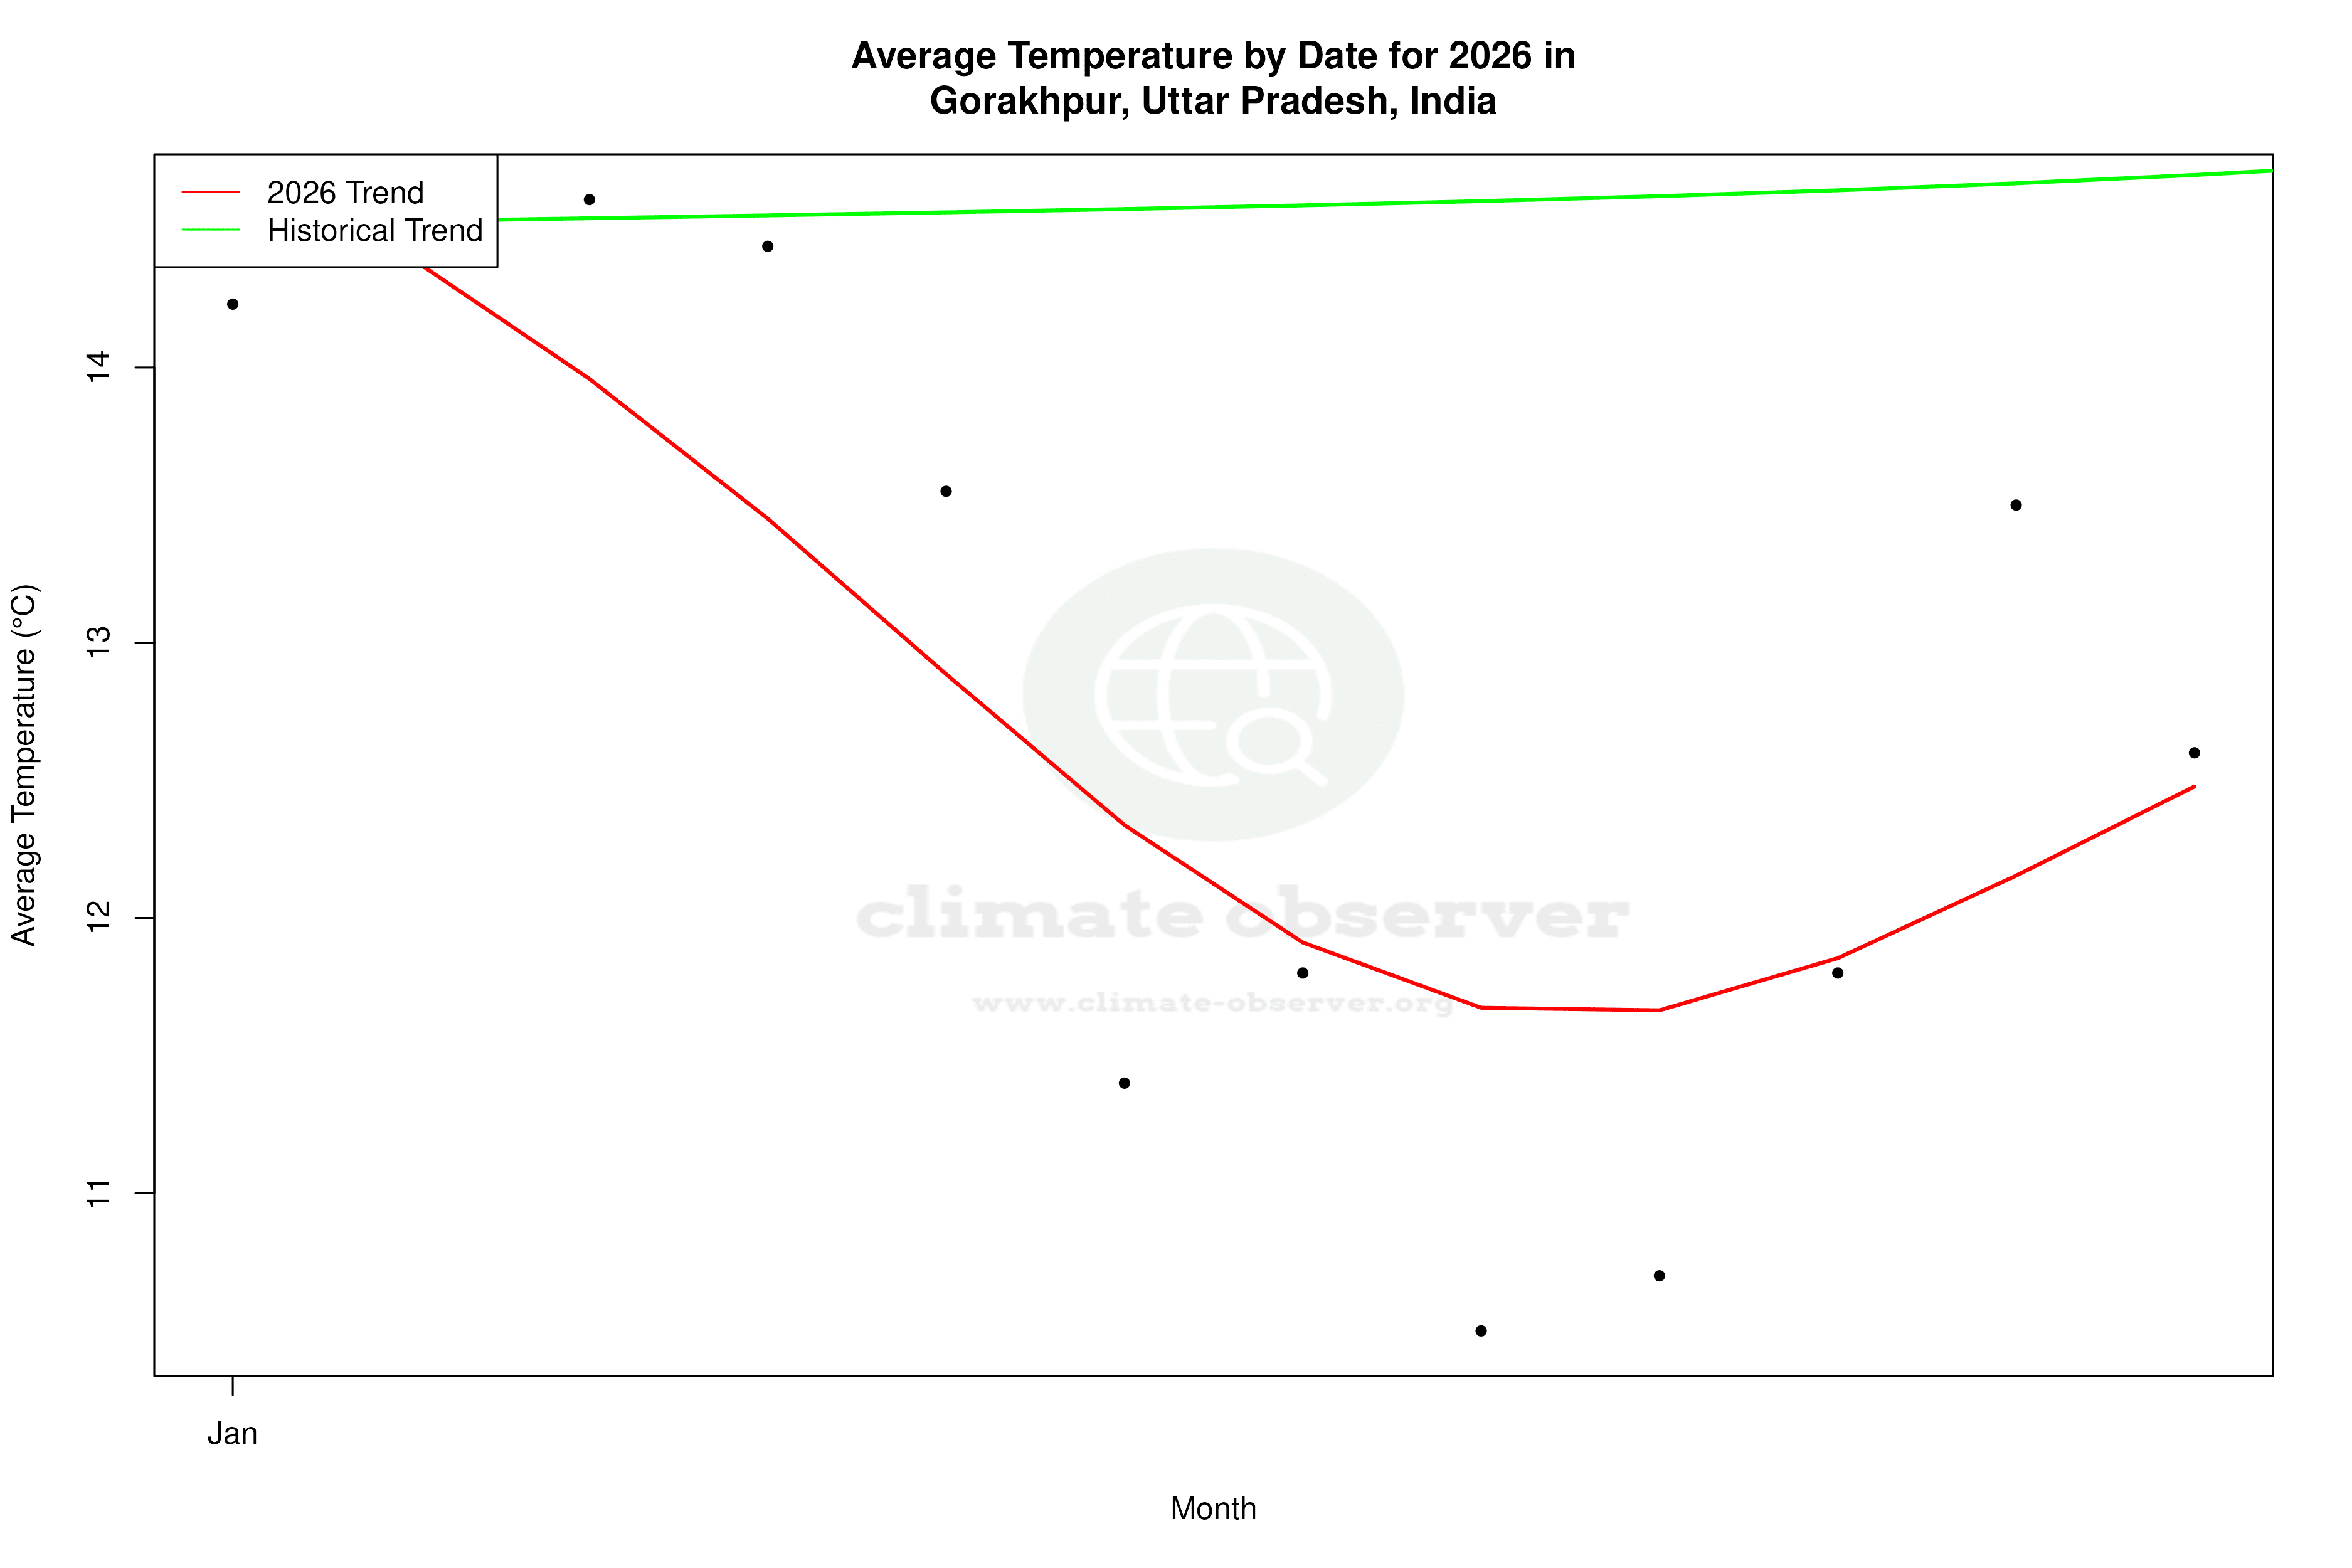


Max Temperature this Year | 1 of 6
Climate 12-Month Moving Averages


Max Temperature 12-Month MA | 1 of 6
Daily Data Points and Averages Throughout the Year


Average Max Temperature Throughout Year | 1 of 5
