Climate for Station: Anzali, Gilan Province, Iran
Loading live weather...
Climate Analysis & Overview
Anzali's climate is experiencing a warming trend, with both high and low temperatures increasing over the past decade. The precipitation pattern has become slightly more evenly distributed, reflecting a subtle shift in the region's climatic dynamics.
Warming Trends in Anzali
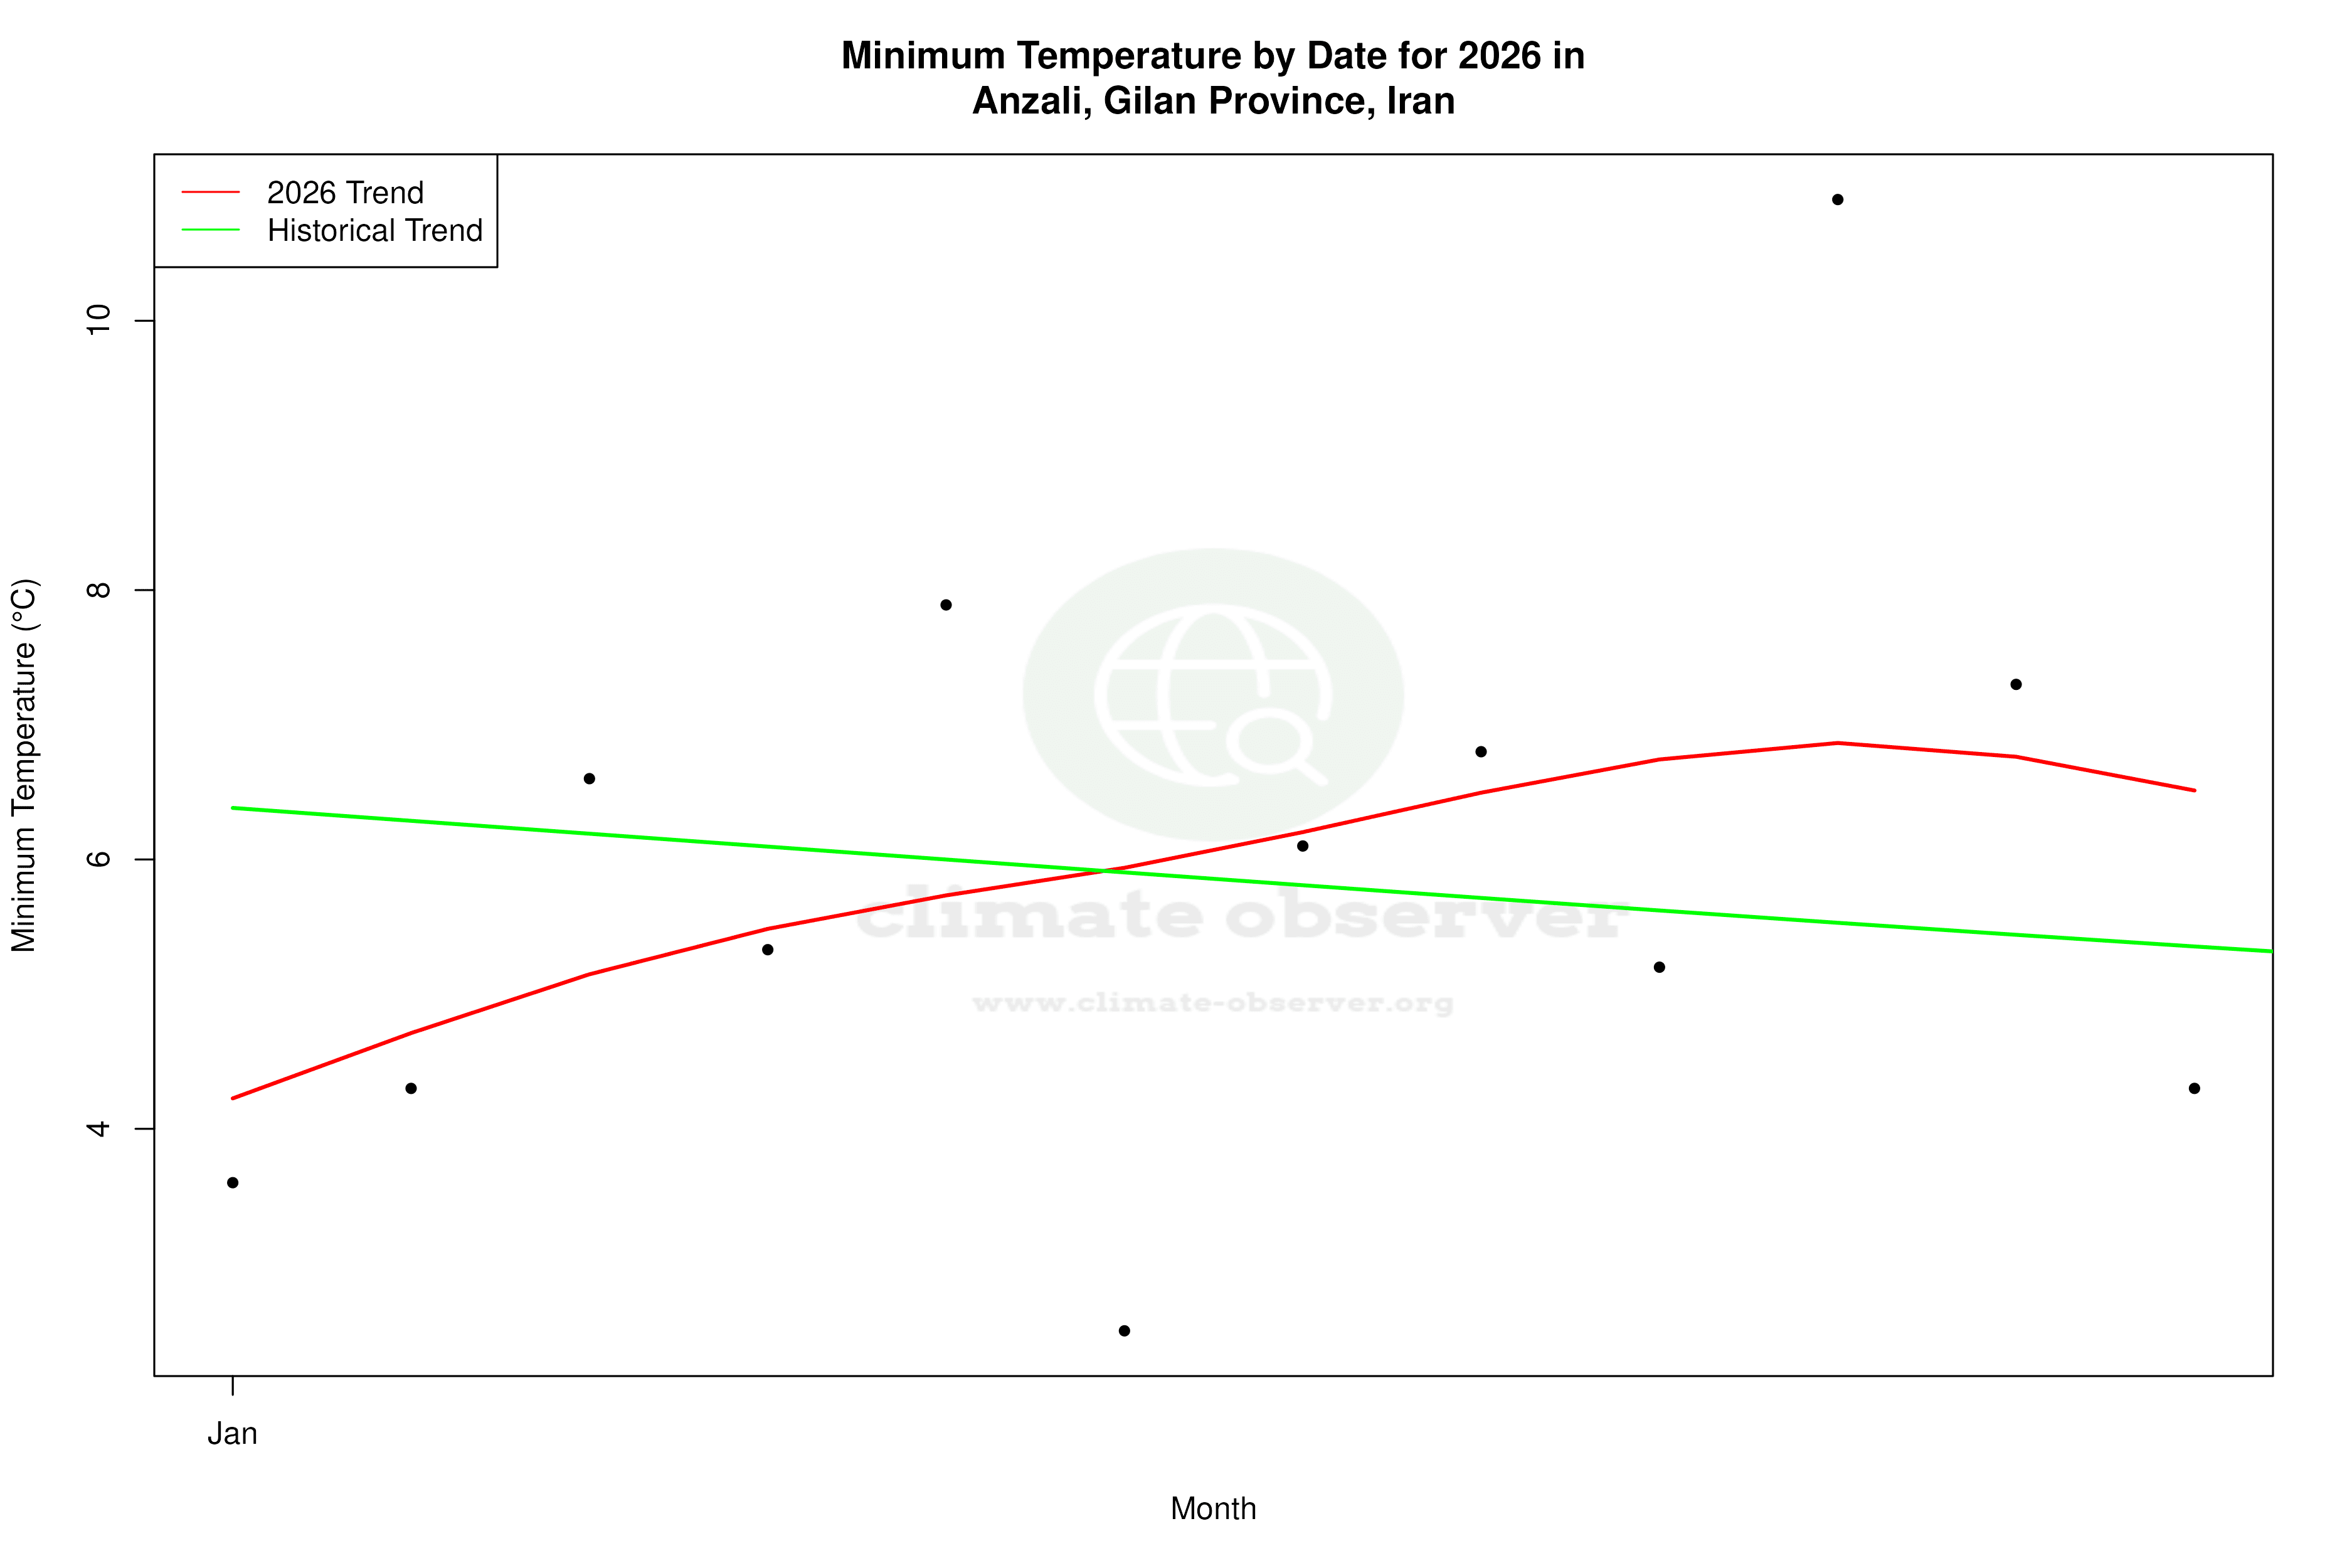
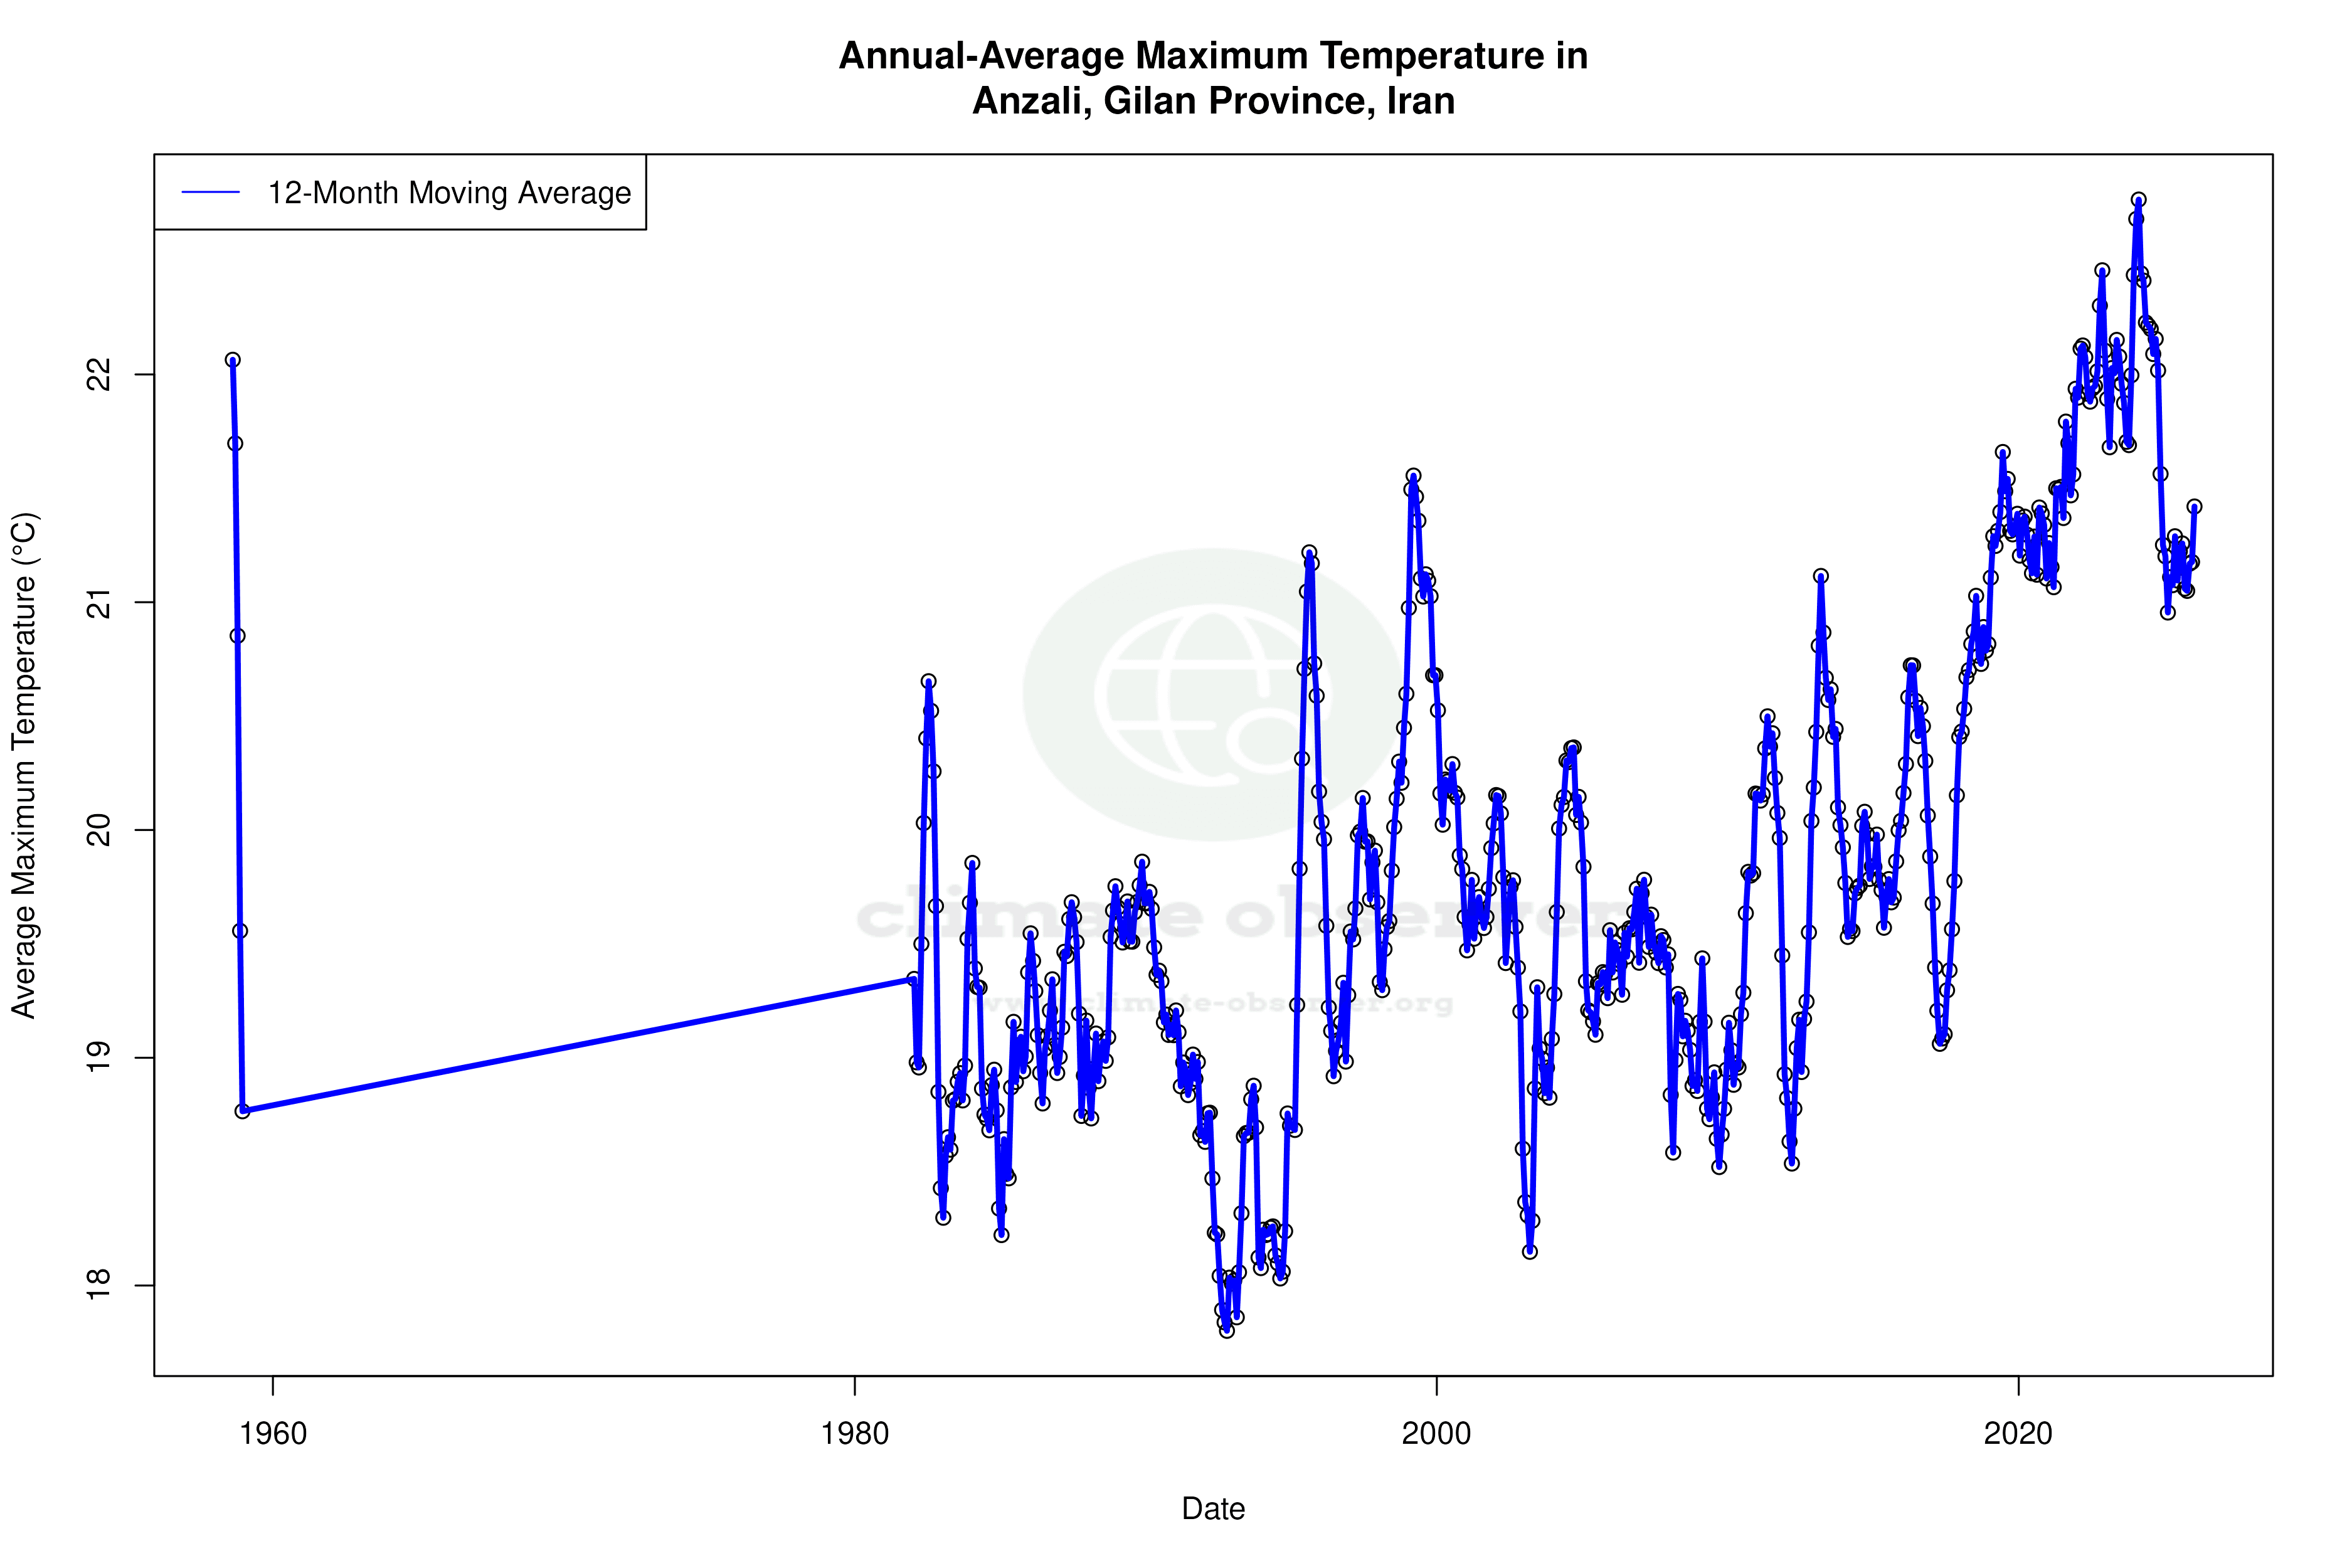
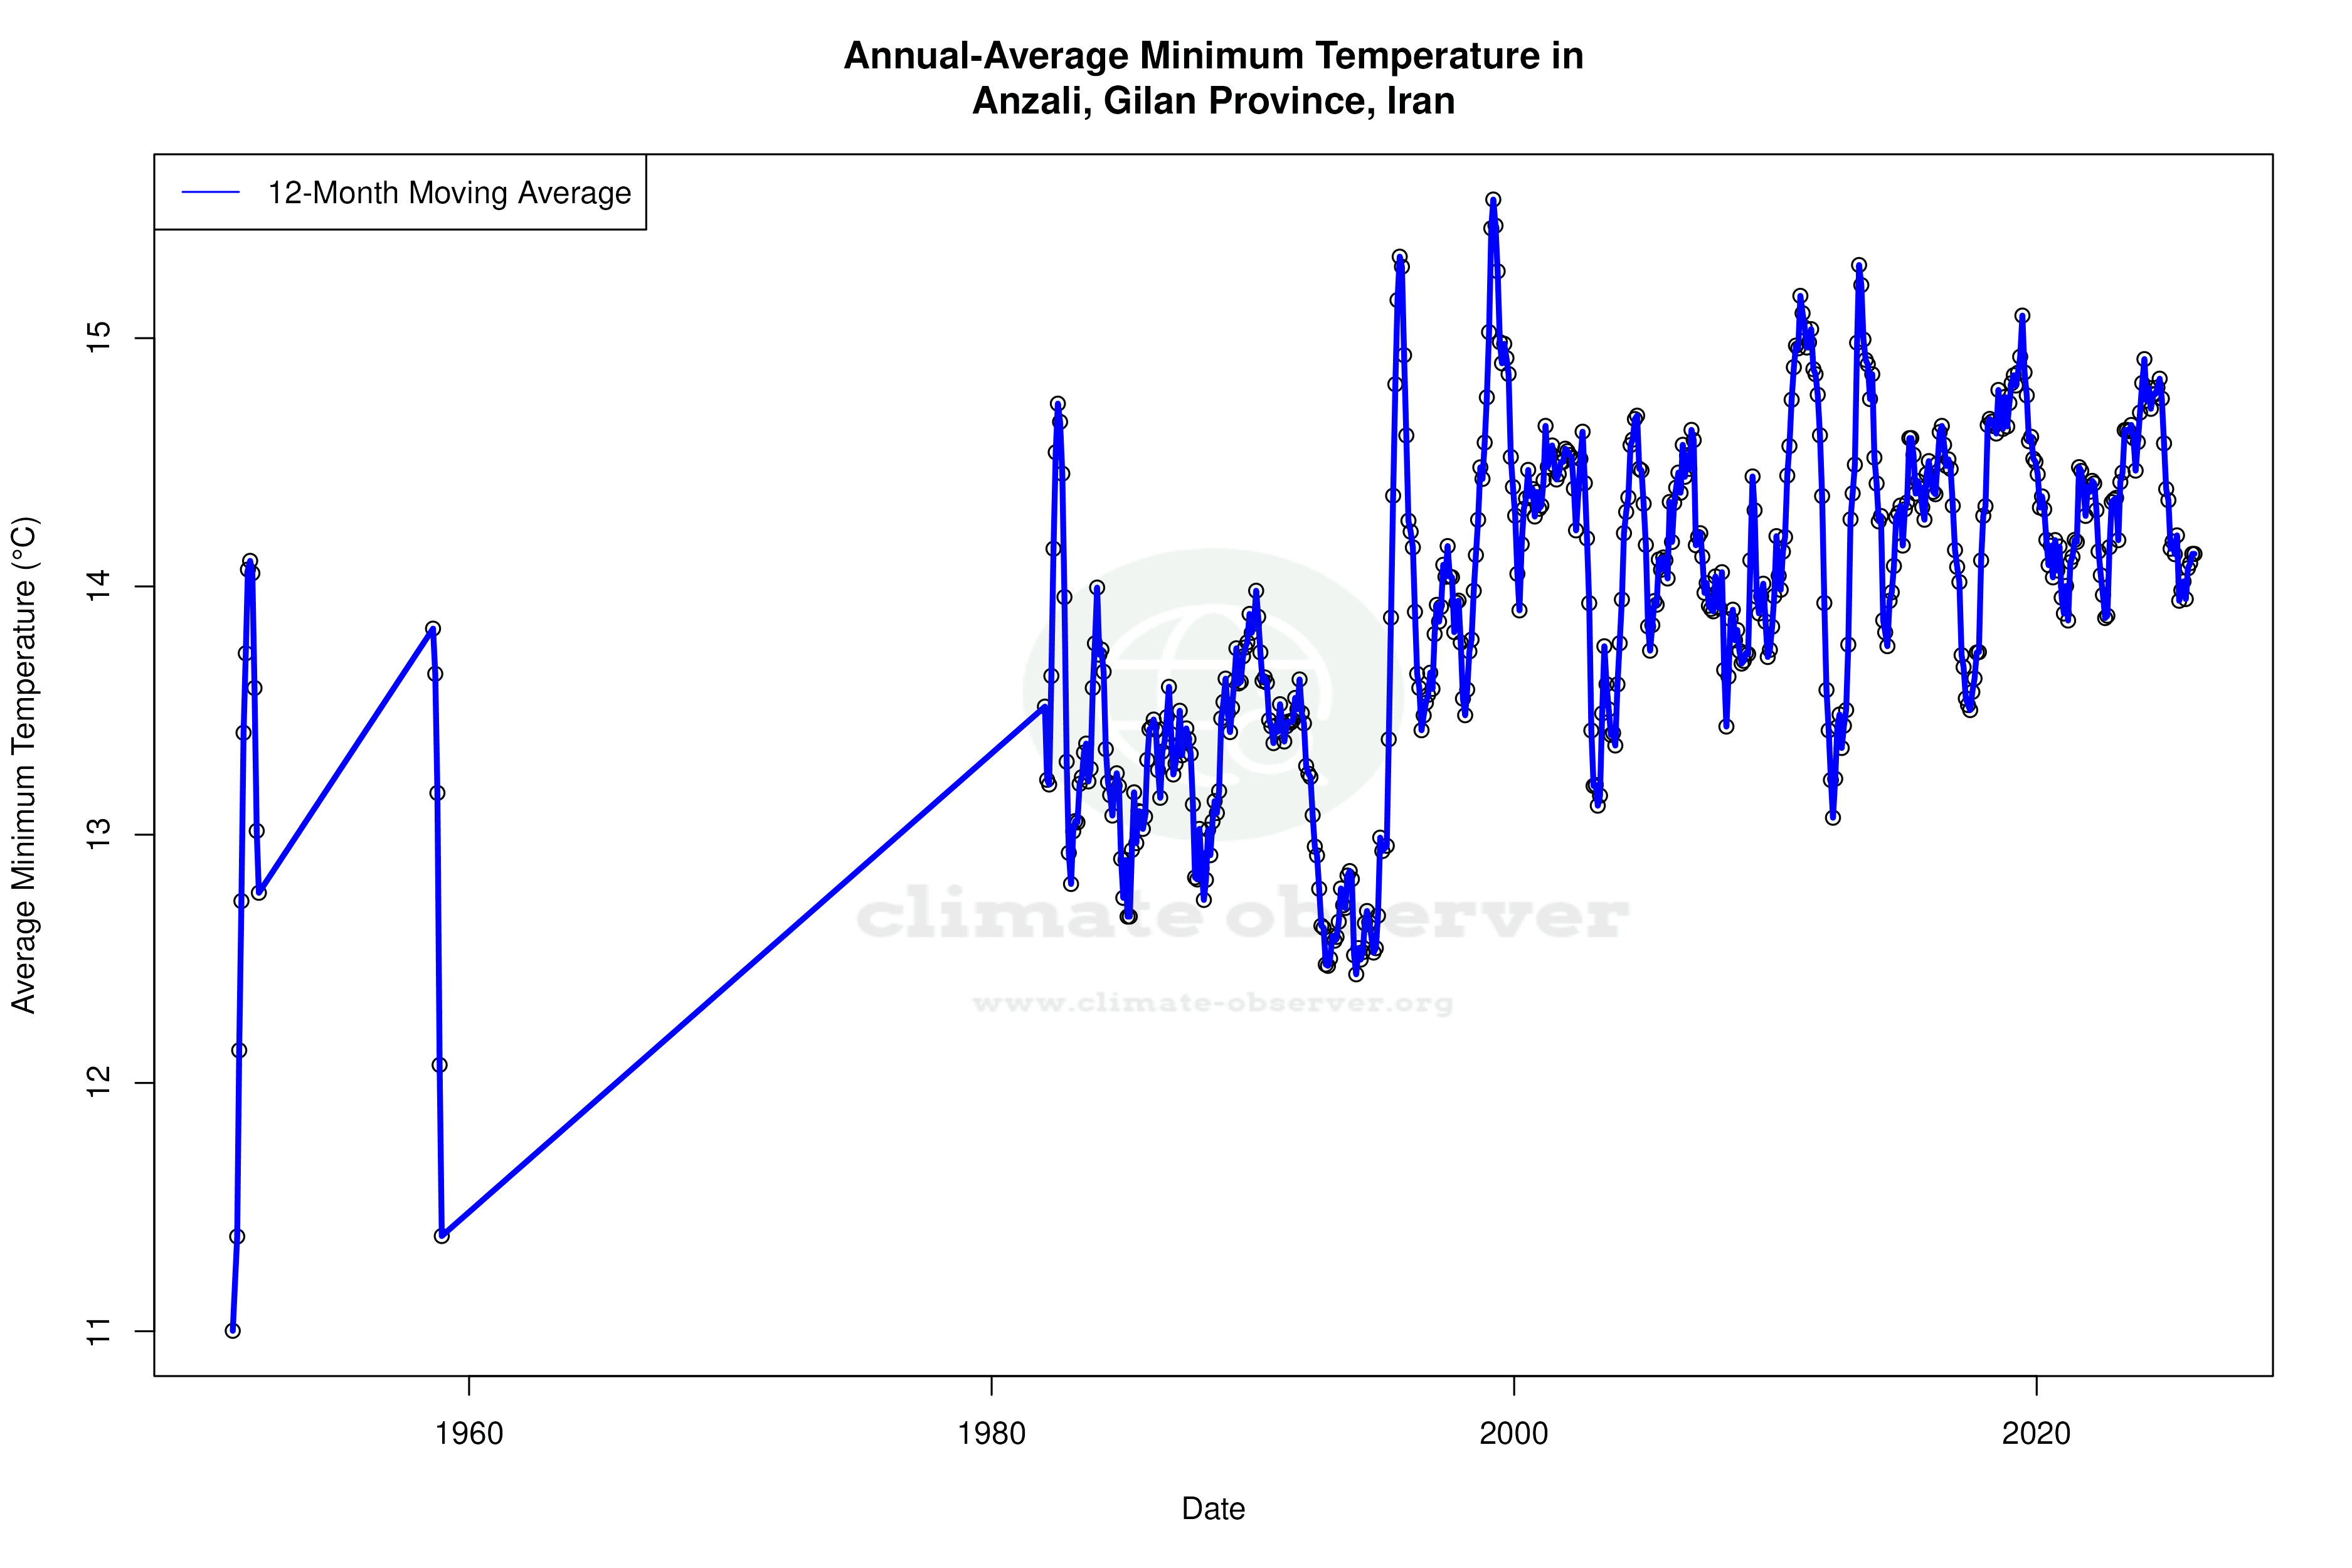
Located in the Gilan Province of Iran, Anzali is characterised by a humid subtropical climate, known in the Köppen classification as Cfa. This coastal city benefits from the moderating effects of the Caspian Sea, which influences its temperature and precipitation patterns. Over the past decade, Anzali has experienced a notable increase in temperature, with high temperatures rising by 1.51°C (2.72°F) and low temperatures by 0.41°C (0.74°F). This recent trend is more pronounced than the all-time warming trend, where highs have increased by 0.44°C (0.79°F) and lows by 0.33°C (0.59°F). This indicates an acceleration in warming over the last ten years.
Temperature Extremes and Records
Anzali's climate is marked by significant temperature extremes, with recorded highs reaching 41.0°C (105.8°F) and lows plummeting to -11.7°C (10.9°F). Such extremes highlight the city's vulnerability to temperature fluctuations, which can impact local agriculture and water resources. The warming trends observed suggest that future temperature records may continue to be challenged, potentially exacerbating heat-related stresses in the region.
Precipitation Patterns and Distribution
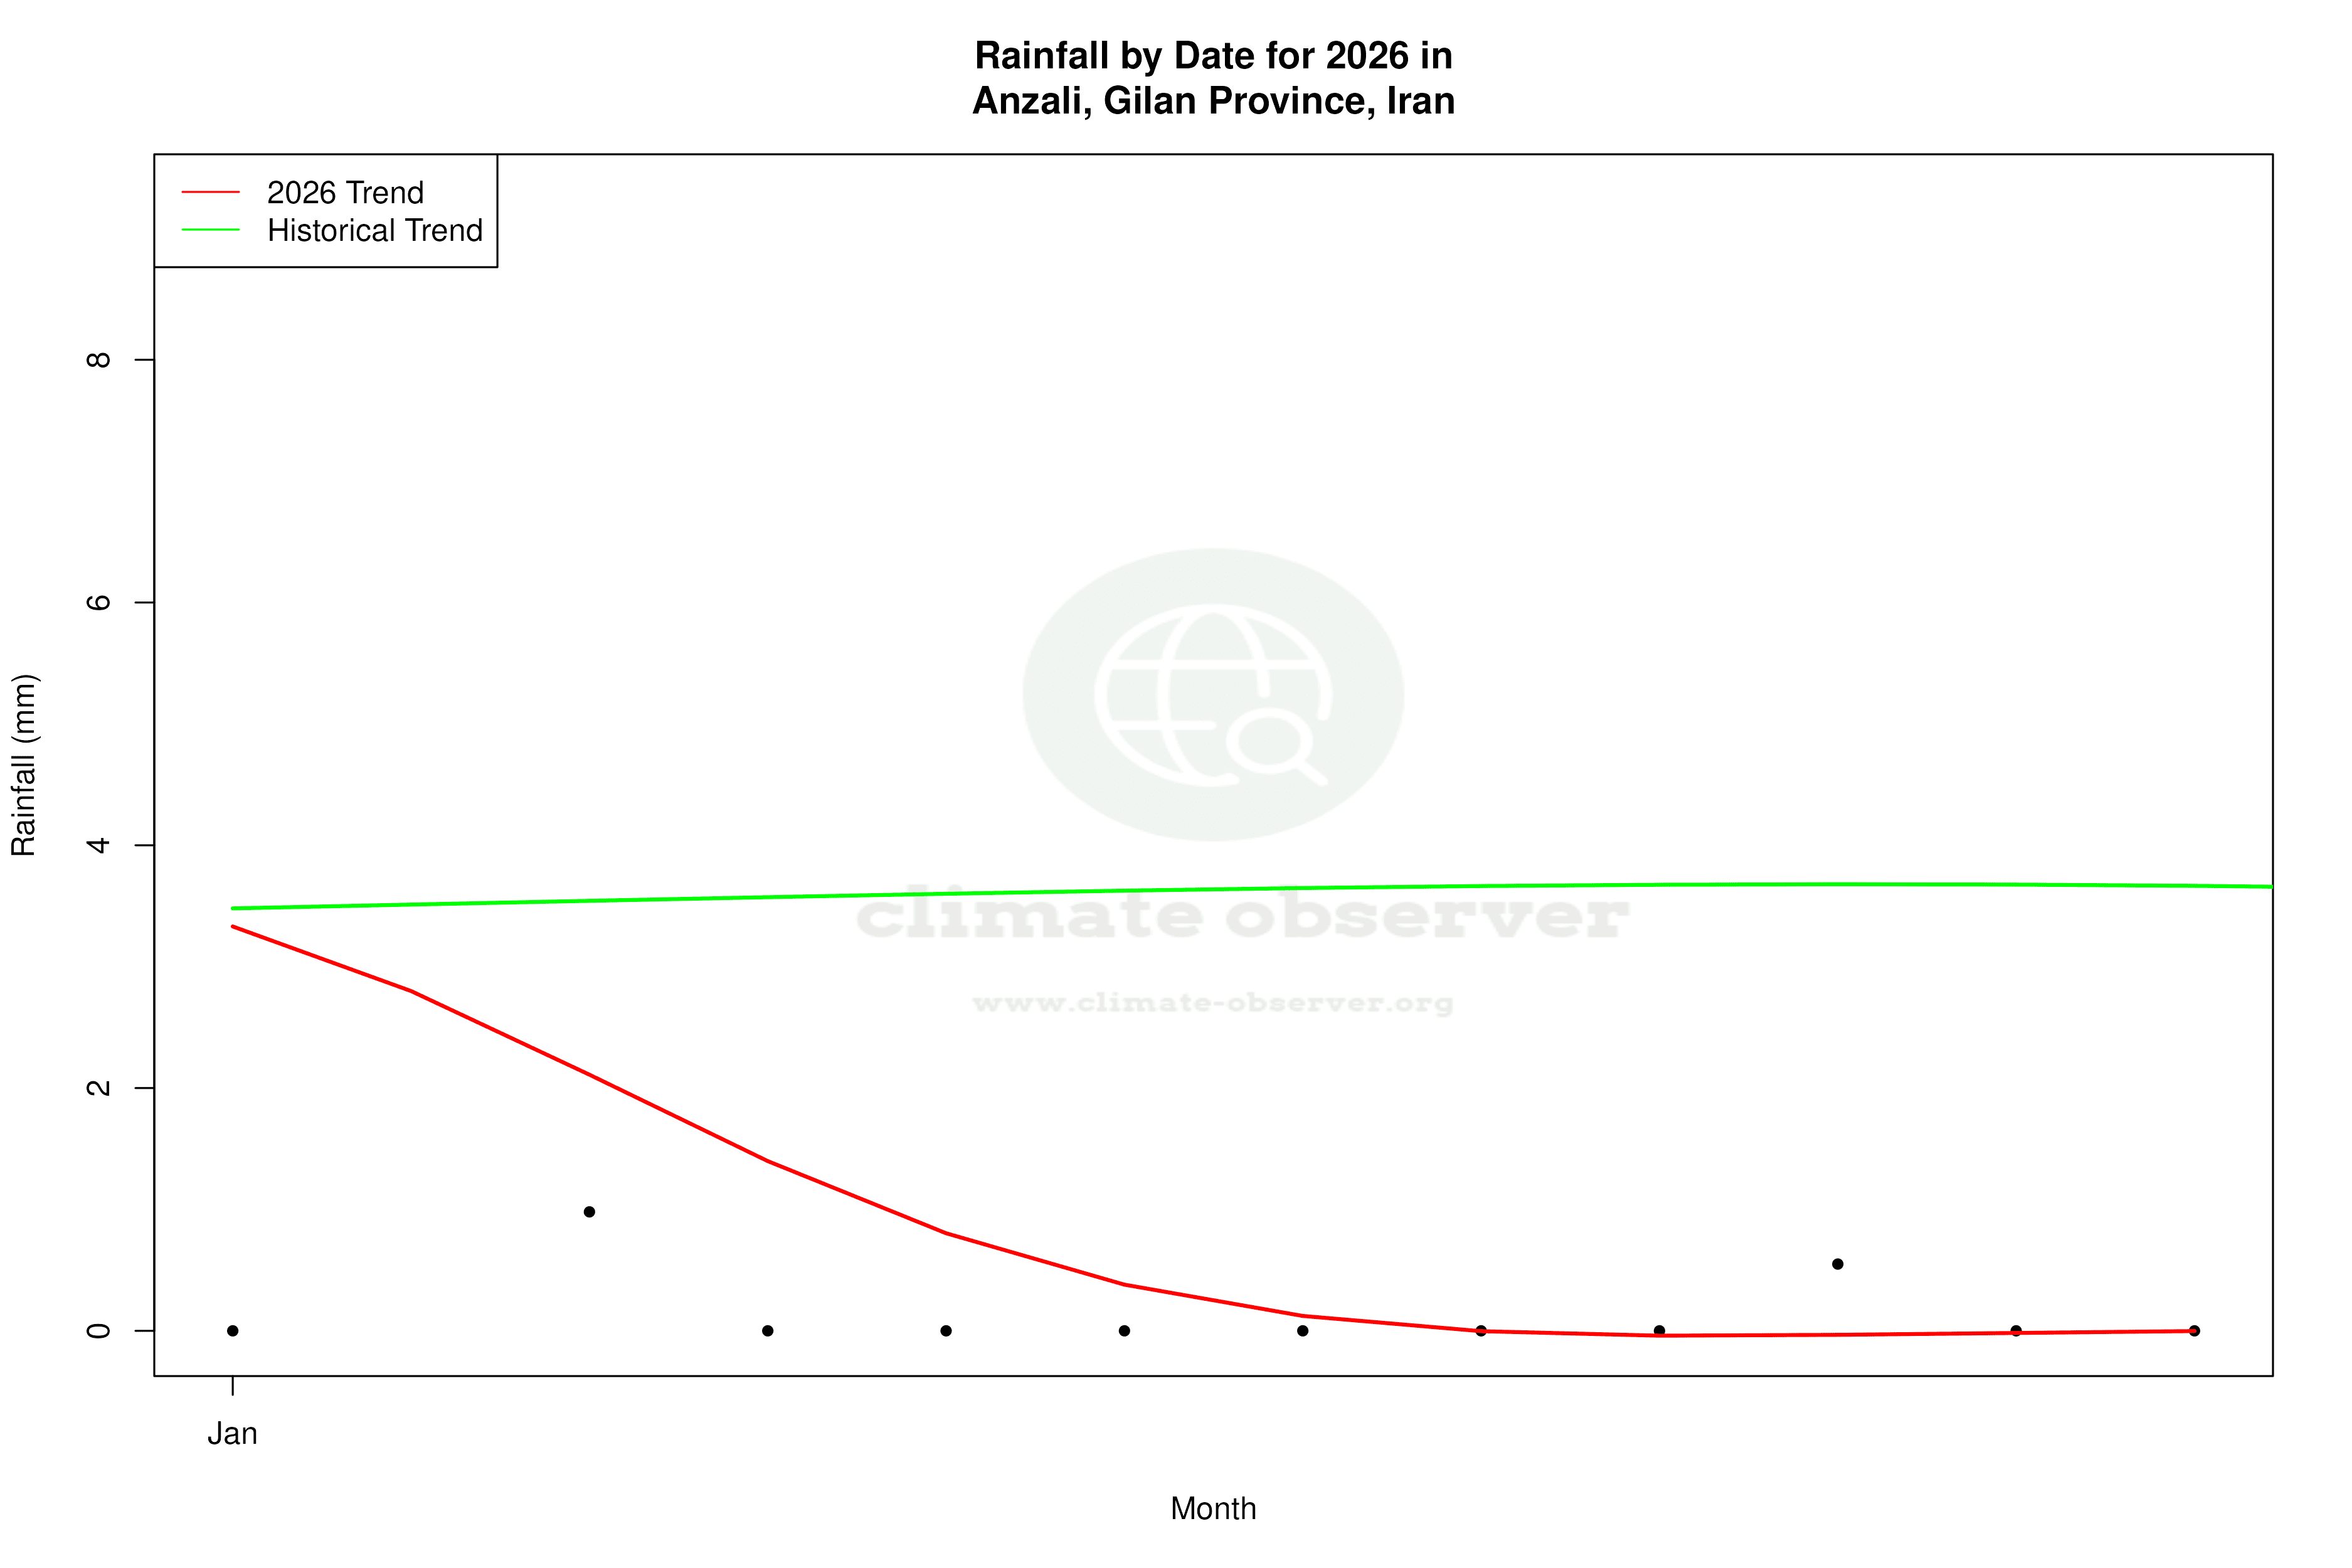
The Precipitation Concentration Index (PCI) for Anzali has shown a slight decrease from a baseline of 14.4 to a current value of 13.5. The PCI is a measure of how precipitation is distributed over time, with lower values indicating a more even distribution. This slight change suggests that rainfall events are becoming marginally more evenly spread throughout the year, which could mitigate the risks of flooding and drought that are often associated with concentrated precipitation patterns.
Geographical Influences on Climate
Anzali's geographical position, nestled between the Alborz mountain range and the Caspian Sea, plays a crucial role in its climate dynamics. The mountains act as a barrier, trapping moisture-laden air from the sea, which contributes to the city's high humidity and frequent rainfall. This unique geographical setting not only influences the local climate but also the observed trends in temperature and precipitation.
Regional Climate Goals and Implications
Iran's commitment to regional climate goals, including reducing greenhouse gas emissions and adapting to climate change impacts, provides an important backdrop to Anzali's climate story. The warming trends observed in Anzali underscore the urgency of these goals, as the city grapples with the implications of rising temperatures and evolving precipitation patterns. As Anzali navigates these changes, understanding the local climate dynamics will be essential in formulating effective adaptation strategies.
Station Statistics
10-Year Trend
High: +1.28 °C/decade
Low: +0.56 °C/decade
Rain: -0.25 mm/decade
25-Year Trend
High: +1.03 °C/decade
Low: +0.18 °C/decade
Rain: +0.19 mm/decade
50-Year Trend
High: +0.52 °C/decade
Low: +0.33 °C/decade
Rain: +0.60 mm/decade
All-Time Trend
High: +0.44 °C/decade
Low: +0.33 °C/decade
Rain: +0.55 mm/decade
Percentage Above-Average Days
Last 12 Months: 55.6%
This Year: 51.3%
Precipitation Concentration Index (PCI) ℹ️
Last 12 Months: 13.6
Historical Average: 14.9
Percentile Rank of Last 12 Months ℹ️
High: 77th percentile
Low: 94th percentile
Rain: 62nd percentile
Change in Variance ℹ️
High: +5.2%
Low: -5.3%
Intraday: +33.8%
Data Coverage
66.1%
First Year of Data
1950
Station Location
Historical Weather Records
| Max High | Avg High | Min High | Max Avg | Avg Avg | Min Avg | Max Low | Avg Low | Min Low | Max Precipitation | Avg Precipitation | Max Snow | Avg Snow | |
|---|---|---|---|---|---|---|---|---|---|---|---|---|---|
| Record | 41.0 °C | — | -0.4 °C | 31.7 °C | — | -4.3 °C | 28.8 °C | — | -11.7 °C | 195.8 mm | — | — | — |
| January | 25.0 °C | 10.9 °C | 0.0 °C | 20.1 °C | 7.7 °C | -4.3 °C | 12.8 °C | 5.2 °C | -8.9 °C | 95.8 mm | 3.5 mm | — | — |
| February | 24.5 °C | 10.5 °C | -0.4 °C | 21.1 °C | 7.3 °C | -2.8 °C | 16.8 °C | 4.8 °C | -11.7 °C | 102.1 mm | 3.5 mm | — | — |
| March | 28.9 °C | 12.5 °C | 0.7 °C | 20.9 °C | 9.4 °C | -0.5 °C | 19.0 °C | 6.8 °C | -5.0 °C | 52.3 mm | 2.6 mm | — | — |
| April | 33.0 °C | 17.3 °C | 4.7 °C | 28.1 °C | 13.9 °C | 3.8 °C | 19.0 °C | 11.1 °C | 0.0 °C | 54.1 mm | 1.6 mm | — | — |
| May | 36.8 °C | 22.4 °C | 8.4 °C | 26.9 °C | 19.2 °C | 9.2 °C | 23.4 °C | 16.2 °C | 5.0 °C | 44.8 mm | 1.0 mm | — | — |
| June | 36.7 °C | 27.2 °C | 17.2 °C | 30.5 °C | 24.0 °C | 15.5 °C | 27.0 °C | 20.6 °C | 12.2 °C | 68.7 mm | 0.8 mm | — | — |
| July | 36.1 °C | 29.3 °C | 19.0 °C | 31.7 °C | 26.3 °C | 17.8 °C | 28.3 °C | 22.8 °C | 15.0 °C | 69.6 mm | 1.3 mm | — | — |
| August | 41.0 °C | 29.4 °C | 21.0 °C | 30.9 °C | 26.2 °C | 17.0 °C | 28.8 °C | 23.0 °C | 16.0 °C | 80.5 mm | 2.0 mm | — | — |
| September | 36.5 °C | 26.3 °C | 17.3 °C | 30.1 °C | 23.1 °C | 15.0 °C | 27.6 °C | 20.2 °C | 10.0 °C | 116.1 mm | 6.3 mm | — | — |
| October | 36.0 °C | 21.8 °C | 9.3 °C | 29.0 °C | 18.5 °C | 8.0 °C | 22.8 °C | 16.0 °C | 6.0 °C | 195.8 mm | 6.8 mm | — | — |
| November | 30.9 °C | 16.9 °C | 2.6 °C | 26.8 °C | 13.7 °C | 0.7 °C | 23.4 °C | 11.1 °C | -2.0 °C | 182.9 mm | 7.1 mm | — | — |
| December | 28.1 °C | 13.0 °C | 3.8 °C | 23.1 °C | 9.9 °C | 2.6 °C | 18.0 °C | 7.4 °C | -1.0 °C | 112.3 mm | 4.3 mm | — | — |
Data Visualisations
Remove WatermarksCurrent Year Climate Trends vs Historical


Max Temperature this Year | 1 of 6
Climate 12-Month Moving Averages


Max Temperature 12-Month MA | 1 of 6
Daily Data Points and Averages Throughout the Year


Average Max Temperature Throughout Year | 1 of 5
