Climate for Station: Abadan, Khuzestan Province, Iran
Loading live weather...
Climate Analysis & Overview
Abadan, situated in Iran's Khuzestan province, is experiencing a warming trend with both high and low temperatures rising over time. The region's precipitation has become slightly more evenly distributed, indicating a shift in weather patterns. These changes align with Iran's broader climate goals, which focus on adapting to and mitigating climate change impacts.
A Desert Climate Under Warming Pressure
Abadan is characterised by a hot desert climate, classified as BWh under the Köppen climate classification. This is typical of regions with extremely high temperatures and minimal rainfall. The city's geographical location near the Persian Gulf and the Shatt al-Arab waterway influences its climate, contributing to high humidity levels during the summer. Over the all-time record, Abadan has seen a warming trend with high temperatures rising by 0.27°C (0.49°F) and low temperatures increasing by 0.42°C (0.75°F). This warming is consistent with global trends and reflects the broader regional climate goals of Iran, which aim to adapt to and mitigate the impacts of climate change.
Temperature Trends: A Decade and Beyond
In the past decade, Abadan has experienced a rise in high temperatures by 0.15°C (0.26°F) and low temperatures by 0.20°C (0.36°F). While these figures are slightly lower than the all-time trends, they still indicate a consistent warming pattern. The increase in low temperatures is particularly notable, suggesting warmer nights which can impact energy consumption and human comfort. This ongoing warming trend necessitates adaptive strategies to cope with the rising heat, particularly in urban planning and infrastructure.
Precipitation Patterns: A Subtle Shift
The Precipitation Concentration Index (PCI) for Abadan has decreased from a baseline of 30.3 to a current value of 28.4. This slight decrease suggests that rainfall is becoming more evenly distributed throughout the year, rather than being concentrated in a few intense events. While still highly concentrated, this change could lead to less severe flooding and better water management opportunities. Understanding these shifts is crucial for local agricultural practices and water resource management, aligning with national efforts to improve sustainability.
Record Extremes: The Heat and the Chill
Abadan's record high temperature stands at a scorching 53.0°C (127.4°F), underscoring the extreme heat potential of the region. Conversely, the record low of -4.4°C (24.1°F) highlights the occasional cold snaps that can occur, although they are rare. These extremes illustrate the broad temperature range that the city can experience, necessitating robust infrastructure and public health measures to protect residents during such events.
Adapting to Change: Regional Implications
As Iran continues to pursue its climate goals, understanding localised climate changes in cities like Abadan is essential. The warming trends and shifting precipitation patterns observed here are reflective of broader regional changes. These insights are critical for informing policy decisions and ensuring that local adaptation strategies are effective in mitigating the impacts of climate change on communities and ecosystems.
Station Statistics
10-Year Trend
High: +2.00 °C/decade
Low: +1.70 °C/decade
Rain: +0.00 mm/decade
25-Year Trend
High: +0.39 °C/decade
Low: +0.78 °C/decade
Rain: +0.03 mm/decade
50-Year Trend
High: +0.23 °C/decade
Low: +0.41 °C/decade
Rain: +0.00 mm/decade
All-Time Trend
High: +0.26 °C/decade
Low: +0.39 °C/decade
Rain: +0.00 mm/decade
Percentage Above-Average Days
Last 12 Months: 53.4%
This Year: 63.2%
Precipitation Concentration Index (PCI) ℹ️
Last 12 Months: 23.7
Historical Average: 30.5
Percentile Rank of Last 12 Months ℹ️
High: 70th percentile
Low: 68th percentile
Rain: 37th percentile
Change in Variance ℹ️
High: +0.9%
Low: -5.0%
Intraday: +18.1%
Data Coverage
68.9%
First Year of Data
1966
Station Location
Historical Weather Records
| Max High | Avg High | Min High | Max Avg | Avg Avg | Min Avg | Max Low | Avg Low | Min Low | Max Precipitation | Avg Precipitation | Max Snow | Avg Snow | |
|---|---|---|---|---|---|---|---|---|---|---|---|---|---|
| Record | 53.0 °C | — | 7.8 °C | 44.1 °C | — | 3.2 °C | 37.1 °C | — | -4.4 °C | 40.0 mm | — | — | — |
| January | 26.9 °C | 18.8 °C | 7.8 °C | 21.2 °C | 12.7 °C | 3.2 °C | 17.8 °C | 7.3 °C | -4.4 °C | 40.0 mm | 0.7 mm | — | — |
| February | 33.4 °C | 21.5 °C | 7.8 °C | 24.8 °C | 15.1 °C | 3.8 °C | 19.4 °C | 9.0 °C | -3.9 °C | 29.1 mm | 0.4 mm | — | — |
| March | 41.1 °C | 26.6 °C | 13.0 °C | 30.9 °C | 19.7 °C | 8.0 °C | 24.0 °C | 13.0 °C | -2.0 °C | 29.6 mm | 0.5 mm | — | — |
| April | 45.0 °C | 33.4 °C | 18.6 °C | 34.7 °C | 25.9 °C | 14.9 °C | 29.0 °C | 18.7 °C | 5.9 °C | 28.1 mm | 0.2 mm | — | — |
| May | 49.4 °C | 40.3 °C | 25.6 °C | 41.1 °C | 32.2 °C | 20.7 °C | 33.8 °C | 24.4 °C | 15.0 °C | 14.3 mm | 0.1 mm | — | — |
| June | 52.2 °C | 45.0 °C | 36.0 °C | 43.0 °C | 36.2 °C | 25.2 °C | 35.4 °C | 27.6 °C | 13.0 °C | 24.1 mm | 0.0 mm | — | — |
| July | 52.8 °C | 46.6 °C | 35.0 °C | 44.1 °C | 37.7 °C | 27.6 °C | 37.1 °C | 29.3 °C | 19.0 °C | 39.4 mm | 0.1 mm | — | — |
| August | 53.0 °C | 46.4 °C | 38.9 °C | 43.0 °C | 37.1 °C | 27.7 °C | 35.6 °C | 28.7 °C | 21.1 °C | 26.4 mm | 0.0 mm | — | — |
| September | 50.1 °C | 43.3 °C | 33.9 °C | 43.2 °C | 33.6 °C | 20.7 °C | 33.6 °C | 24.9 °C | 16.1 °C | 0.2 mm | 0.0 mm | — | — |
| October | 45.0 °C | 36.8 °C | 24.0 °C | 35.4 °C | 27.7 °C | 15.5 °C | 29.8 °C | 20.3 °C | 10.0 °C | 29.9 mm | 0.1 mm | — | — |
| November | 37.7 °C | 27.2 °C | 12.2 °C | 29.4 °C | 20.0 °C | 7.5 °C | 25.0 °C | 14.0 °C | 0.2 °C | 30.1 mm | 0.5 mm | — | — |
| December | 32.0 °C | 20.5 °C | 8.9 °C | 23.8 °C | 14.4 °C | 4.2 °C | 21.0 °C | 9.0 °C | -2.6 °C | 22.1 mm | 0.6 mm | — | — |
Data Visualisations
Remove WatermarksCurrent Year Climate Trends vs Historical


Max Temperature this Year | 1 of 6
Climate 12-Month Moving Averages

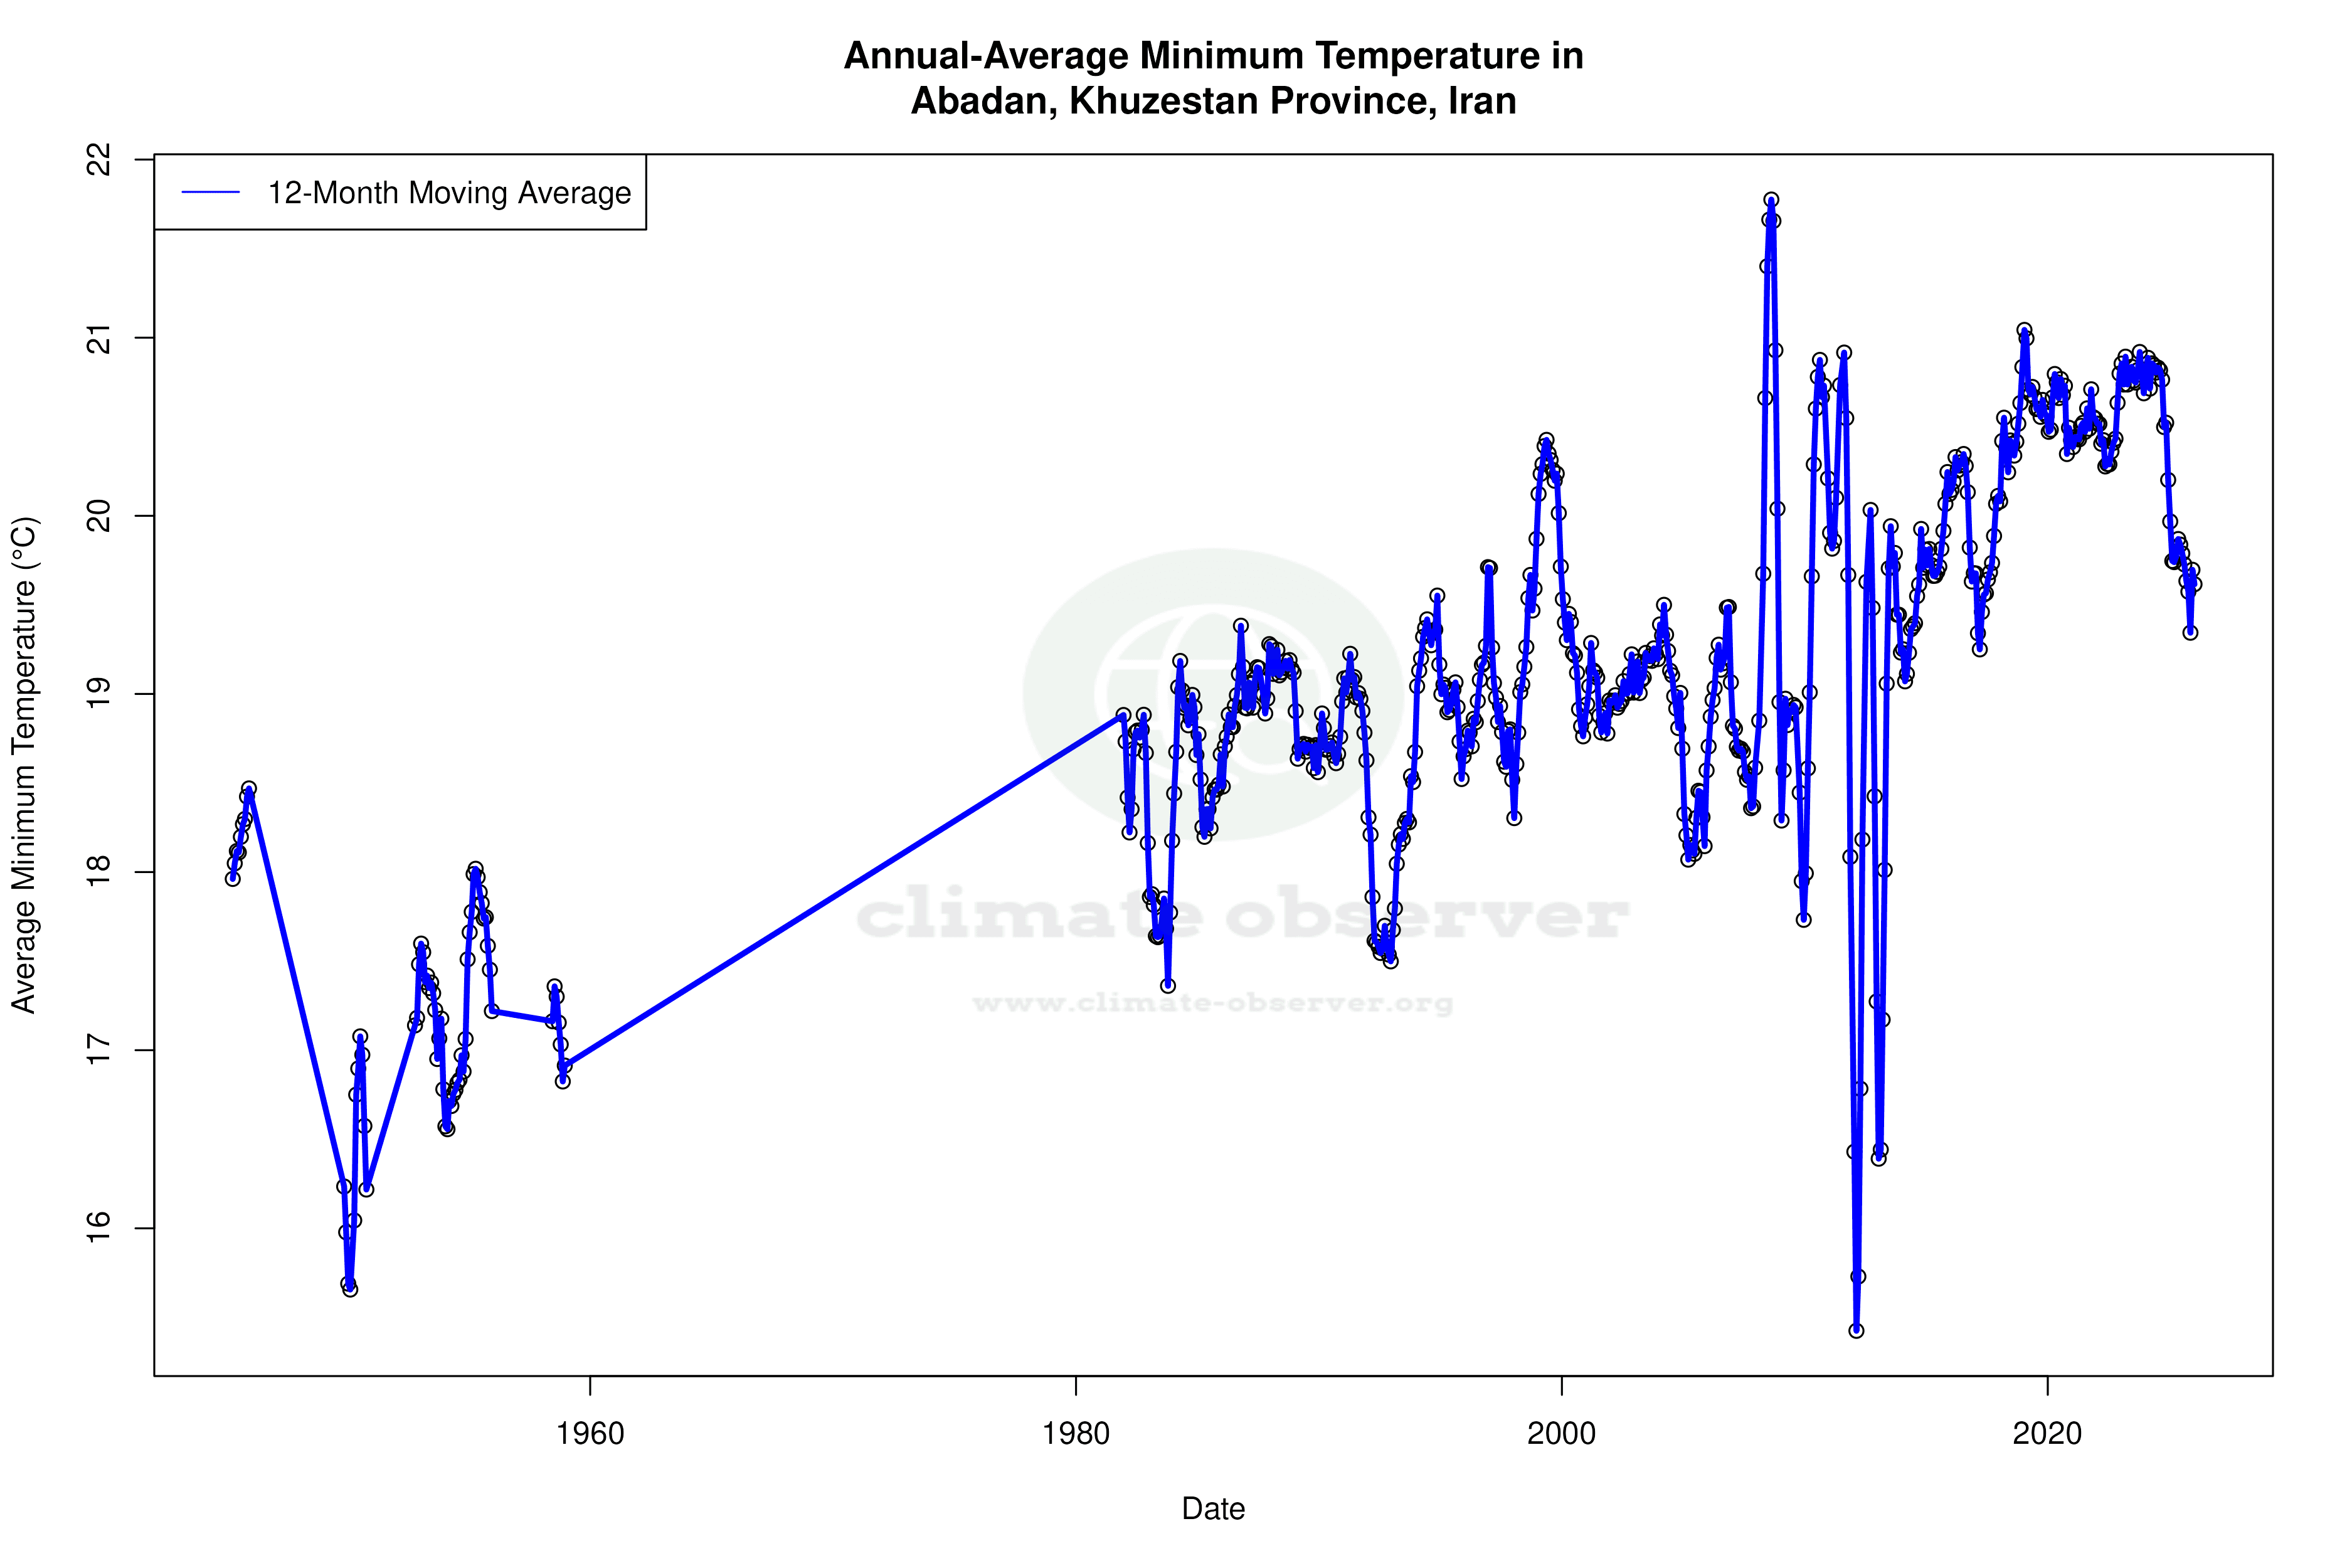


Max Temperature 12-Month MA | 1 of 6
Daily Data Points and Averages Throughout the Year


Average Max Temperature Throughout Year | 1 of 5
