Climate for Station: Verona Villafranca, Veneto, Italy
Loading live weather...
Climate Analysis & Overview
Verona Villafranca is experiencing a notable warming trend, with recent decades showing a sharper rise in temperatures compared to historical data. The precipitation pattern has become slightly more evenly distributed, reflecting broader climate shifts in the region.
Climate Classification and Geographic Influence
Verona Villafranca is situated in a region classified under the Köppen climate system as Cfa, indicating a humid subtropical climate. This classification is characterised by hot summers and no dry season, influenced by the proximity to the Po Valley and the moderate effects of the nearby Alps. The local geography plays a critical role in shaping the climate data, with the mountains acting as a barrier to cold northern winds, while the valley channels warm air masses, contributing to the region's thermal characteristics.
Temperature Trends: A Decade of Change
Over the past decade, Verona Villafranca has experienced a significant warming trend. The average high temperatures have increased by 1.34°C (2.41°F), while the lows have risen by 0.44°C (0.79°F). This sharp increase in highs suggests a shift towards hotter summers, likely impacting local agriculture and energy consumption patterns. In contrast, the all-time temperature trends indicate a more moderate warming, with highs rising by 0.39°C (0.70°F) and lows by 0.31°C (0.56°F). This disparity between the 10-year and all-time trends highlights an acceleration in warming, a critical point for regional climate strategy discussions.
Precipitation Patterns: A Subtle Shift
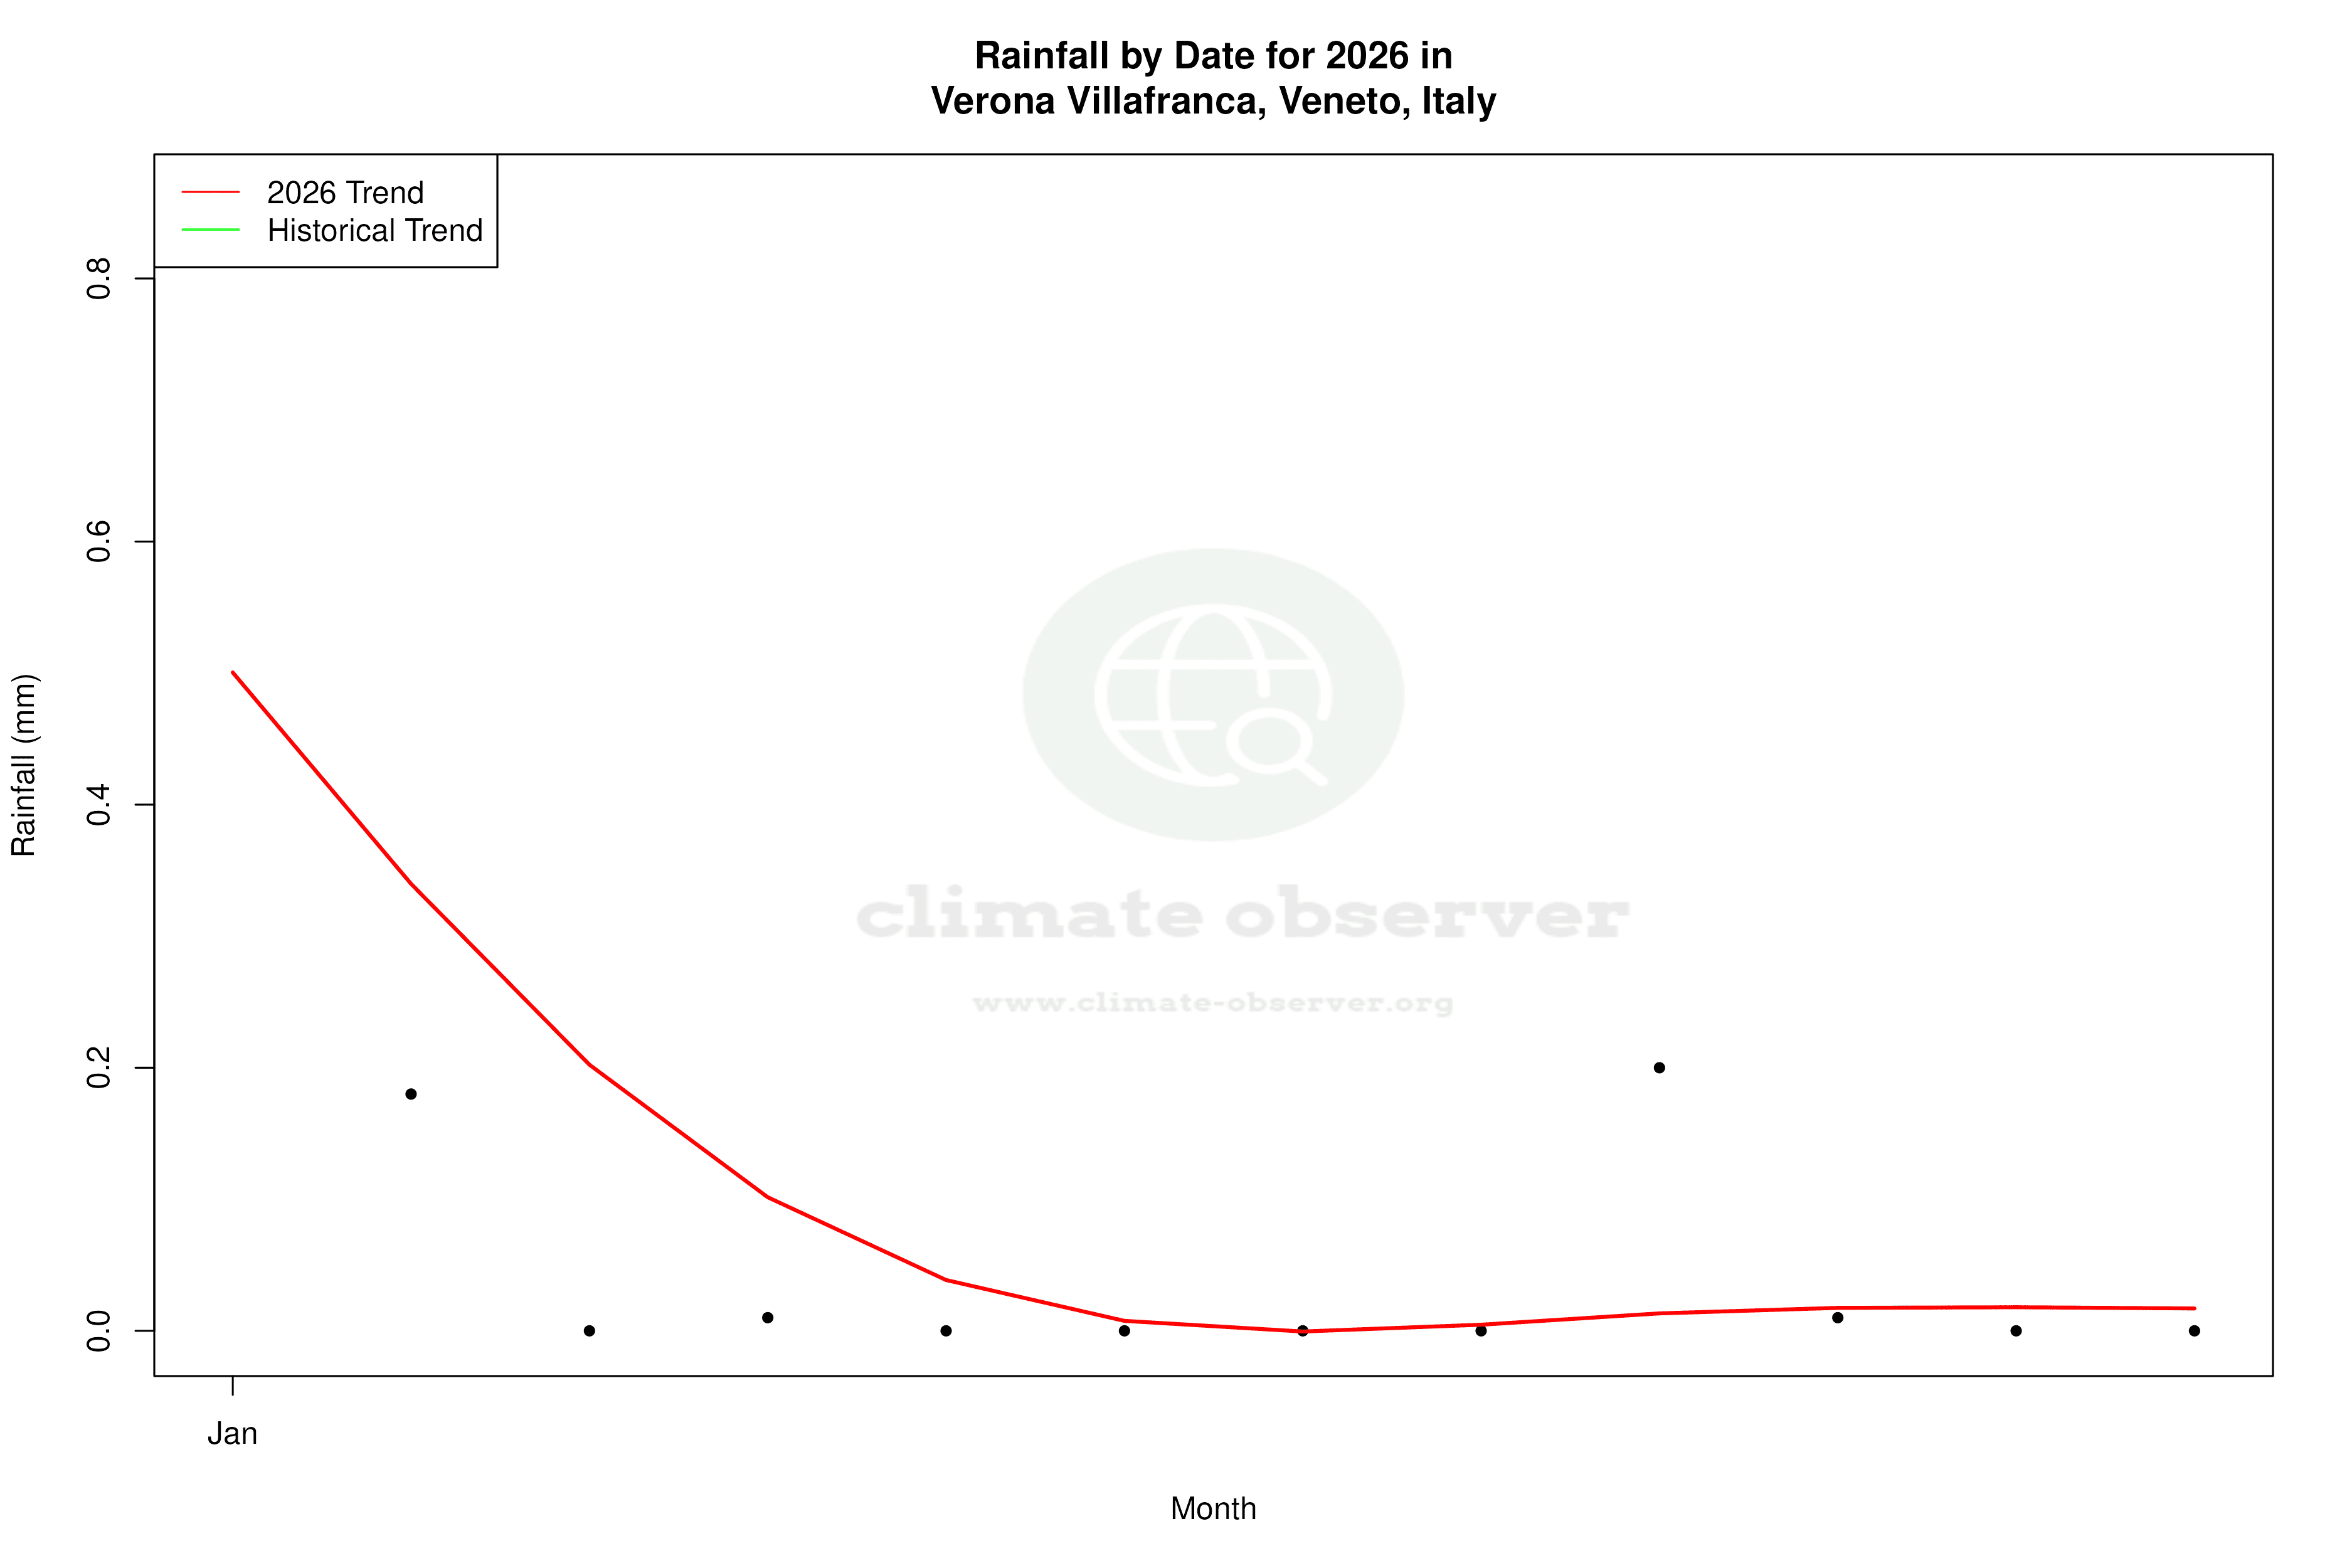
The Precipitation Concentration Index (PCI) for Verona Villafranca has decreased from a baseline of 12.09 to a current value of 10.84. This marginal change suggests that precipitation is becoming slightly more evenly distributed throughout the year. Such a shift can mitigate the risk of flooding and drought, offering a more stable water supply for agriculture and urban use. The PCI is a measure of how precipitation is spread over time, with lower values indicating a more even distribution.
Temperature Extremes: Records and Realities
The station has recorded an absolute maximum temperature of 40.0°C (104.0°F) and a minimum of -18.4°C (-1.1°F). These extremes underscore the variability inherent in the region's climate, which can pose challenges for infrastructure and health systems. The ability to adapt to such extremes is crucial, particularly as climate models predict more frequent and intense weather events.
Regional Climate Goals and Implications
Italy's commitment to the Paris Agreement and its national climate goals underscore the importance of understanding local climate dynamics. The warming trend observed in Verona Villafranca aligns with broader national and global patterns, necessitating adaptive measures to mitigate potential impacts. Recent weather events, such as heatwaves and heavy rainfall, further highlight the urgency of integrating climate resilience into regional planning efforts.
Station Statistics
10-Year Trend
High: +1.20 °C/decade
Low: +0.59 °C/decade
Rain: +0.44 mm/decade
25-Year Trend
High: +0.50 °C/decade
Low: +0.23 °C/decade
Rain: +0.30 mm/decade
50-Year Trend
High: +0.64 °C/decade
Low: +0.41 °C/decade
Rain: +0.00 mm/decade
All-Time Trend
High: +0.39 °C/decade
Low: +0.31 °C/decade
Rain: +0.00 mm/decade
Percentage Above-Average Days
Last 12 Months: 50.7%
This Year: 62.2%
Precipitation Concentration Index (PCI) ℹ️
Last 12 Months: 10.2
Historical Average: 12.5
Percentile Rank of Last 12 Months ℹ️
High: 86th percentile
Low: 92nd percentile
Rain: 75th percentile
Change in Variance ℹ️
High: -4.2%
Low: +2.4%
Intraday: -3.1%
Data Coverage
88.3%
First Year of Data
1945
Station Location
Historical Weather Records
| Max High | Avg High | Min High | Max Avg | Avg Avg | Min Avg | Max Low | Avg Low | Min Low | Max Precipitation | Avg Precipitation | Max Snow | Avg Snow | |
|---|---|---|---|---|---|---|---|---|---|---|---|---|---|
| Record | 40.0 °C | — | -4.4 °C | 32.6 °C | — | -12.0 °C | 26.5 °C | — | -18.4 °C | 83.2 mm | — | — | — |
| January | 20.0 °C | 6.2 °C | -4.4 °C | 13.5 °C | 2.3 °C | -12.0 °C | 12.0 °C | -1.4 °C | -18.4 °C | 43.2 mm | 1.5 mm | — | — |
| February | 22.0 °C | 9.1 °C | -4.0 °C | 12.9 °C | 4.6 °C | -7.2 °C | 10.0 °C | 0.2 °C | -18.4 °C | 58.0 mm | 1.6 mm | — | — |
| March | 27.2 °C | 13.7 °C | -1.0 °C | 17.8 °C | 8.8 °C | -4.3 °C | 13.5 °C | 3.6 °C | -10.4 °C | 44.4 mm | 1.7 mm | — | — |
| April | 40.0 °C | 18.0 °C | 6.0 °C | 22.7 °C | 12.7 °C | 3.7 °C | 17.0 °C | 7.3 °C | -5.2 °C | 45.0 mm | 2.3 mm | — | — |
| May | 36.6 °C | 22.9 °C | 9.9 °C | 28.6 °C | 17.8 °C | 7.2 °C | 21.7 °C | 11.9 °C | 0.0 °C | 77.4 mm | 2.6 mm | — | — |
| June | 38.1 °C | 27.2 °C | 13.0 °C | 31.3 °C | 22.1 °C | 11.2 °C | 26.0 °C | 16.1 °C | 3.8 °C | 67.8 mm | 2.6 mm | — | — |
| July | 38.2 °C | 29.7 °C | 17.0 °C | 32.6 °C | 24.5 °C | 14.3 °C | 25.5 °C | 18.3 °C | 9.2 °C | 65.4 mm | 2.1 mm | — | — |
| August | 39.0 °C | 29.1 °C | 18.0 °C | 32.4 °C | 23.8 °C | 15.3 °C | 26.5 °C | 17.8 °C | 8.1 °C | 63.8 mm | 2.4 mm | — | — |
| September | 34.8 °C | 24.8 °C | 14.0 °C | 27.8 °C | 19.4 °C | 10.9 °C | 21.0 °C | 14.0 °C | 2.0 °C | 83.2 mm | 2.5 mm | — | — |
| October | 31.4 °C | 18.6 °C | 7.0 °C | 21.6 °C | 13.8 °C | 3.8 °C | 18.1 °C | 9.0 °C | -8.8 °C | 69.1 mm | 2.6 mm | — | — |
| November | 23.6 °C | 11.8 °C | 0.0 °C | 18.8 °C | 7.7 °C | -3.8 °C | 15.5 °C | 4.0 °C | -7.9 °C | 67.0 mm | 2.6 mm | — | — |
| December | 20.0 °C | 7.0 °C | -4.0 °C | 13.7 °C | 3.0 °C | -8.2 °C | 11.7 °C | -0.3 °C | -14.0 °C | 46.6 mm | 1.8 mm | — | — |
Data Visualisations
Remove WatermarksCurrent Year Climate Trends vs Historical


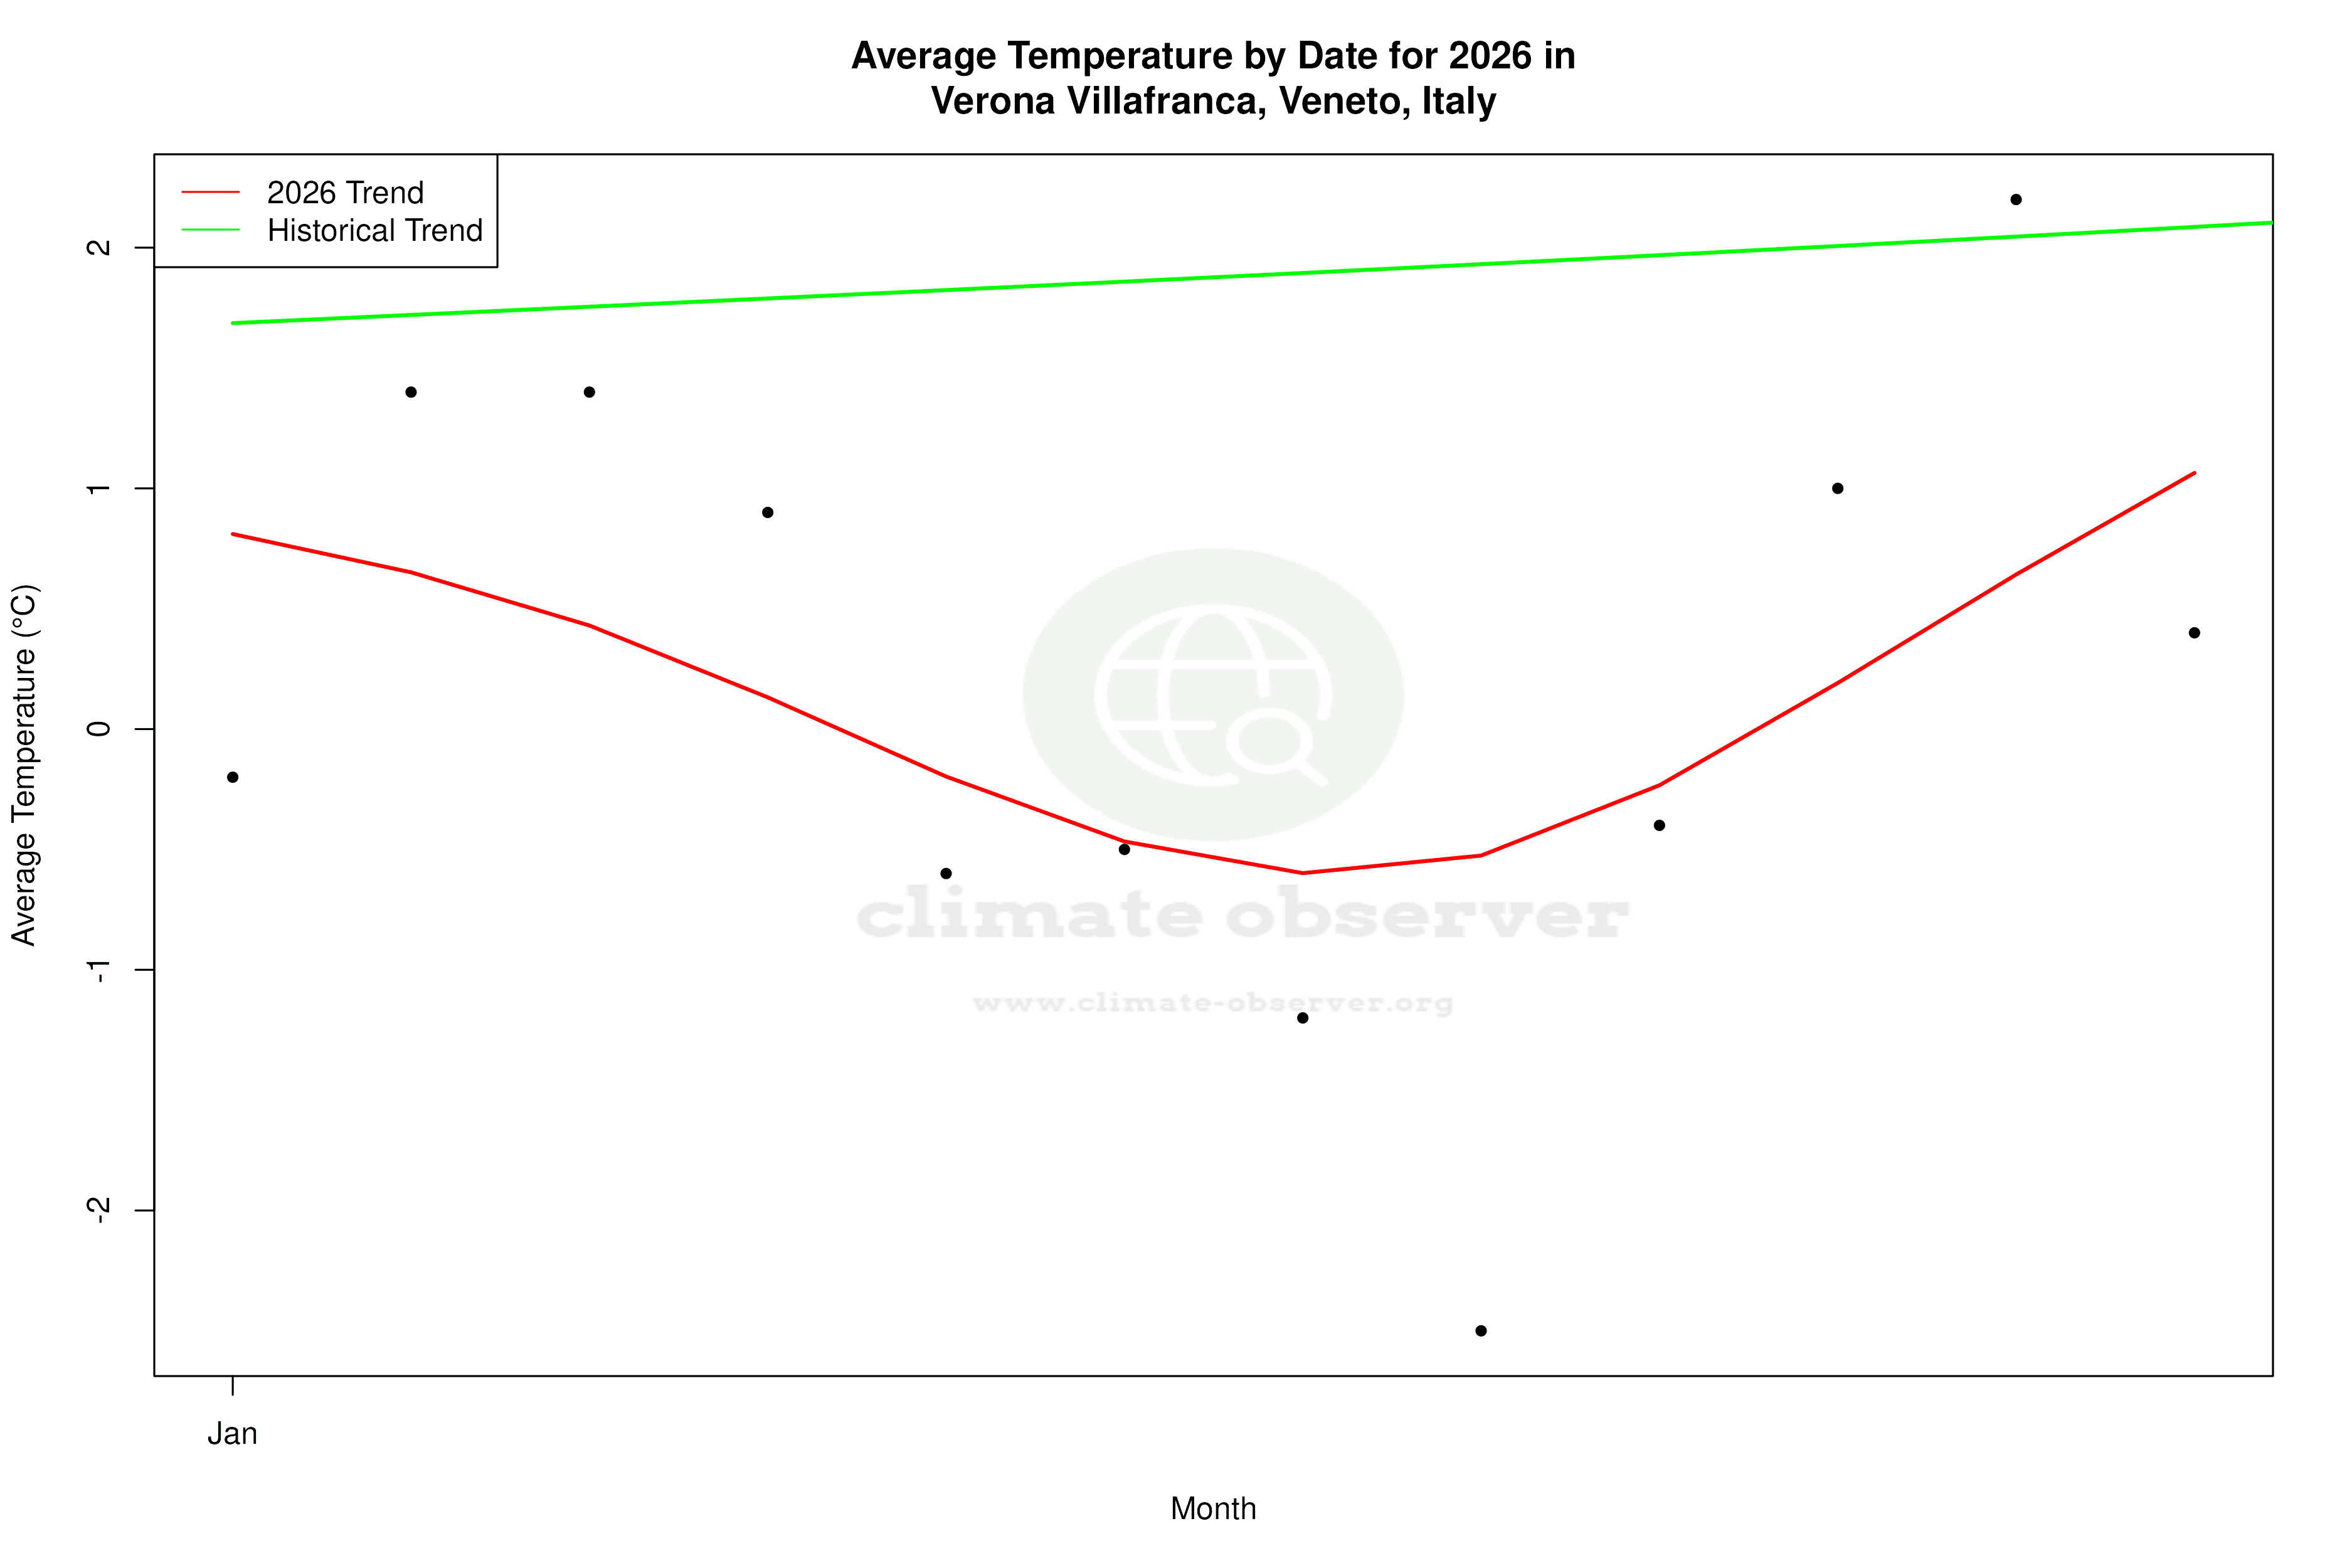

Max Temperature this Year | 1 of 6
Climate 12-Month Moving Averages
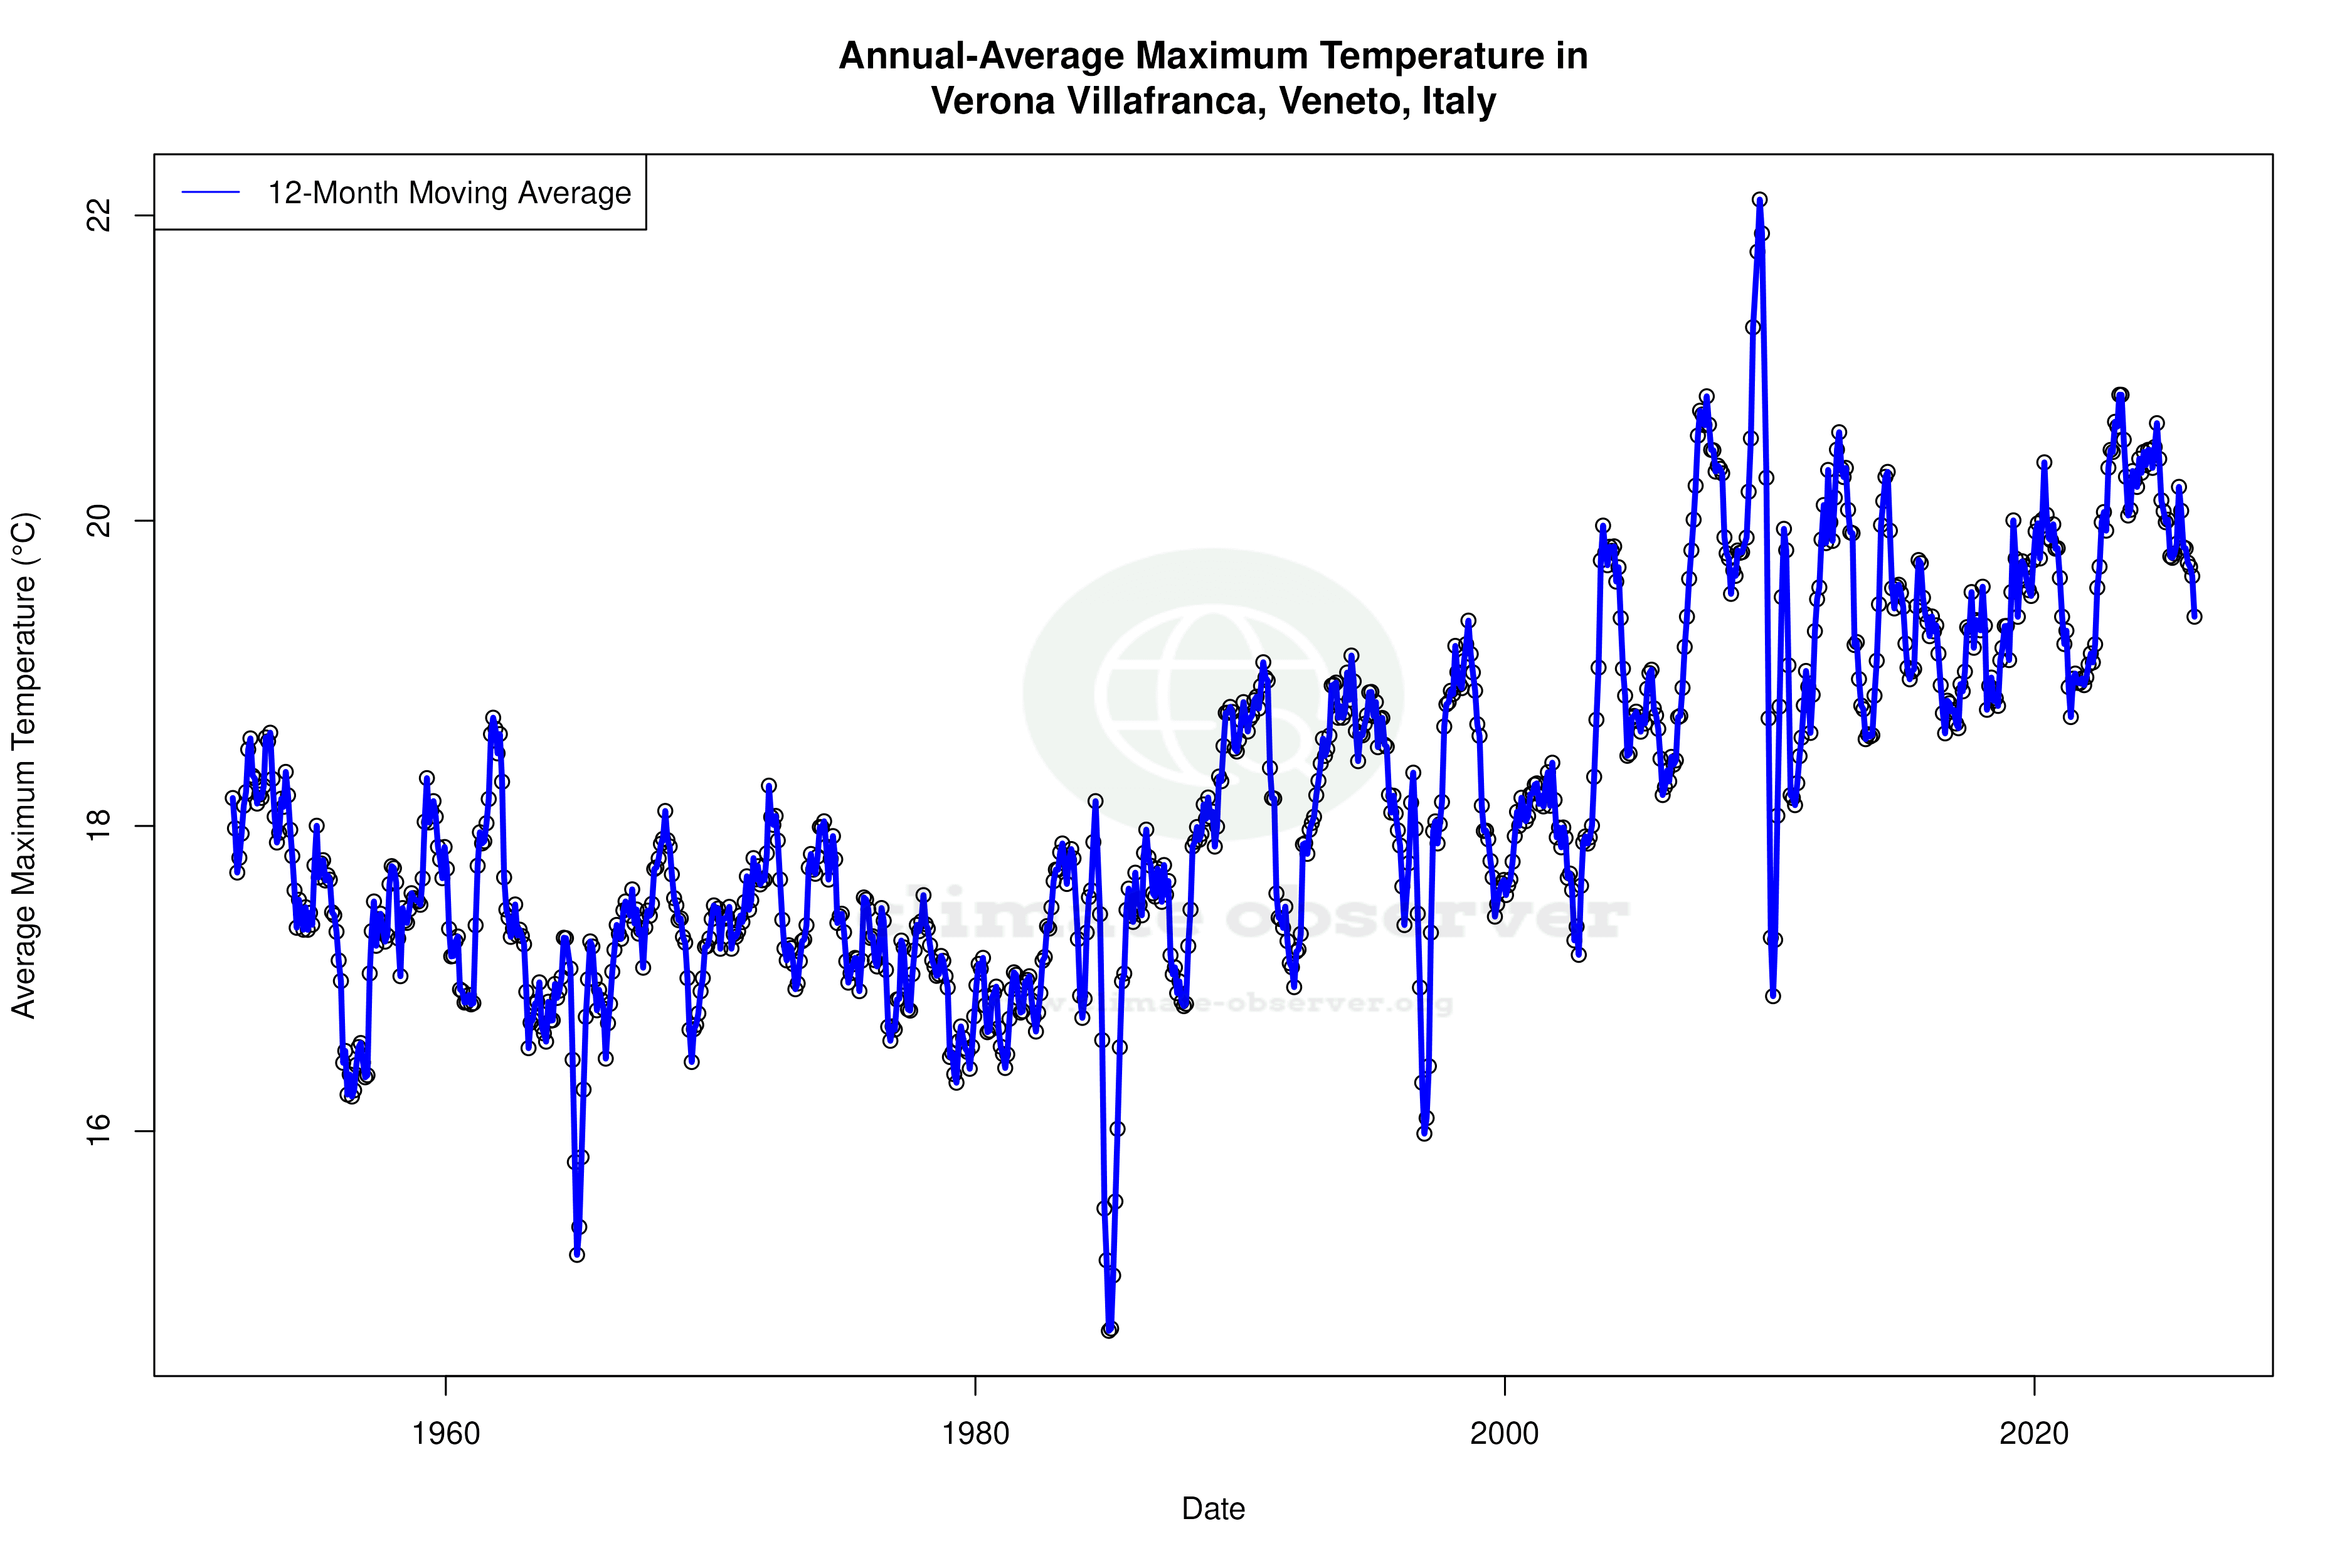
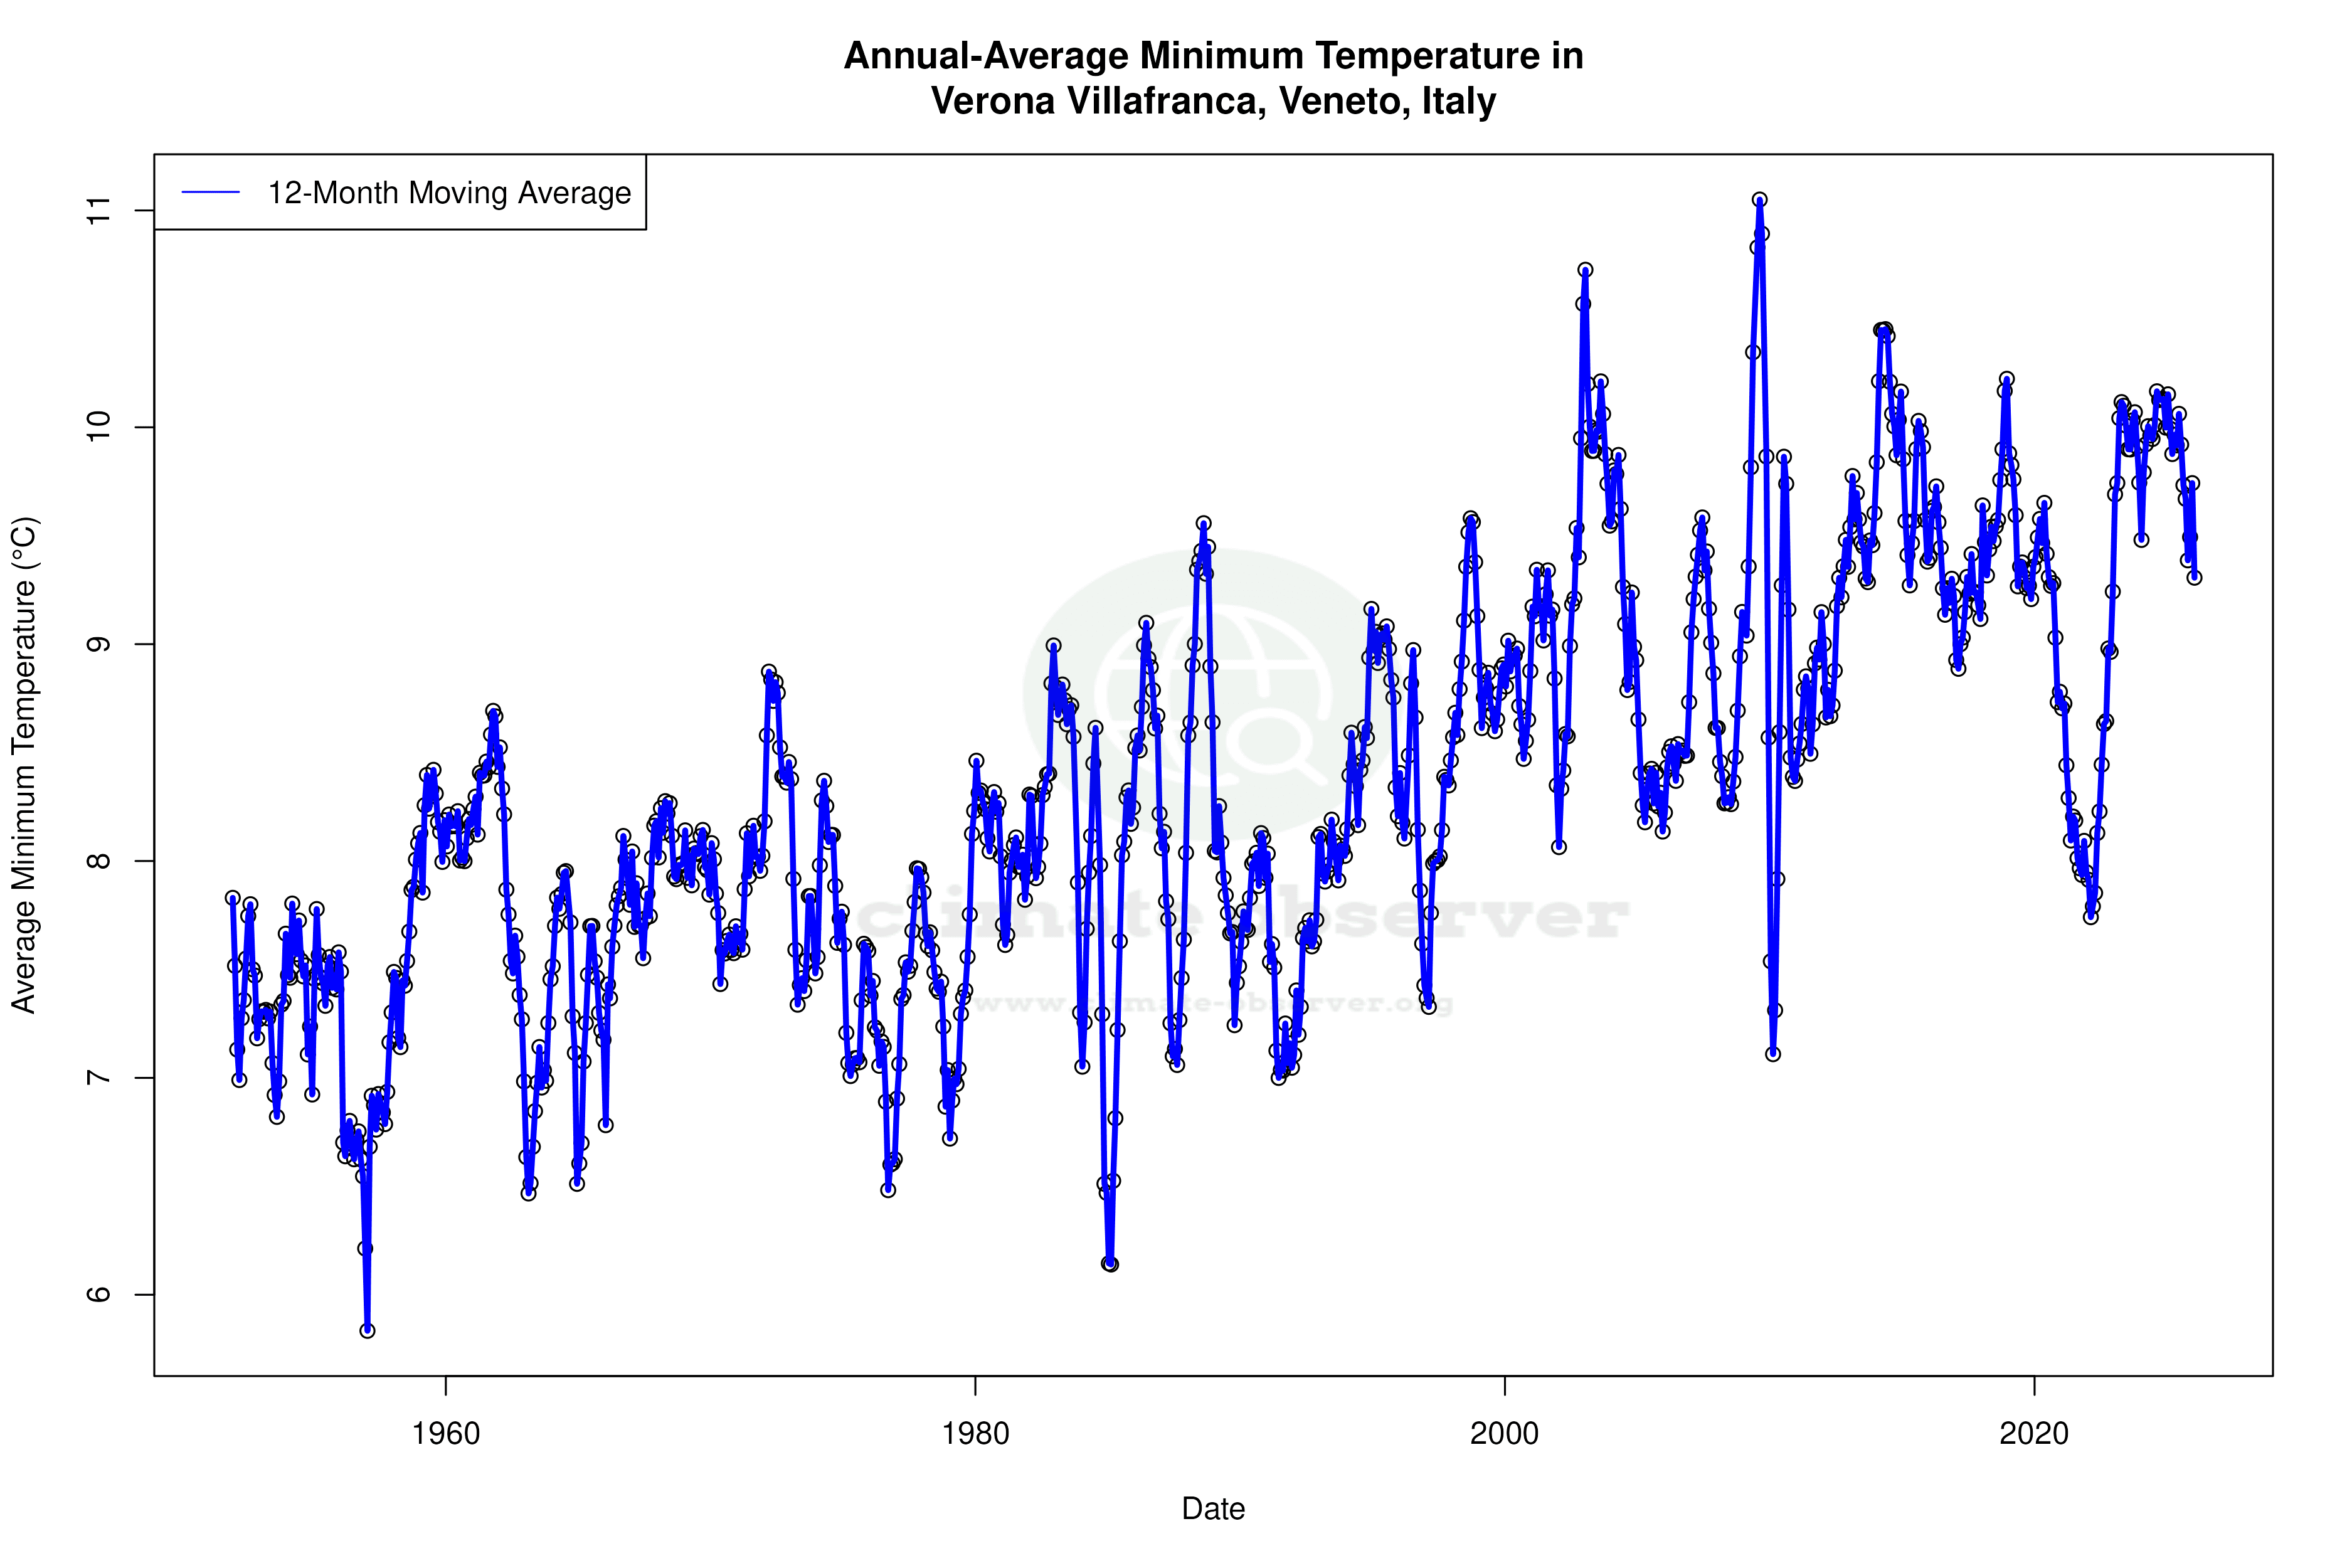
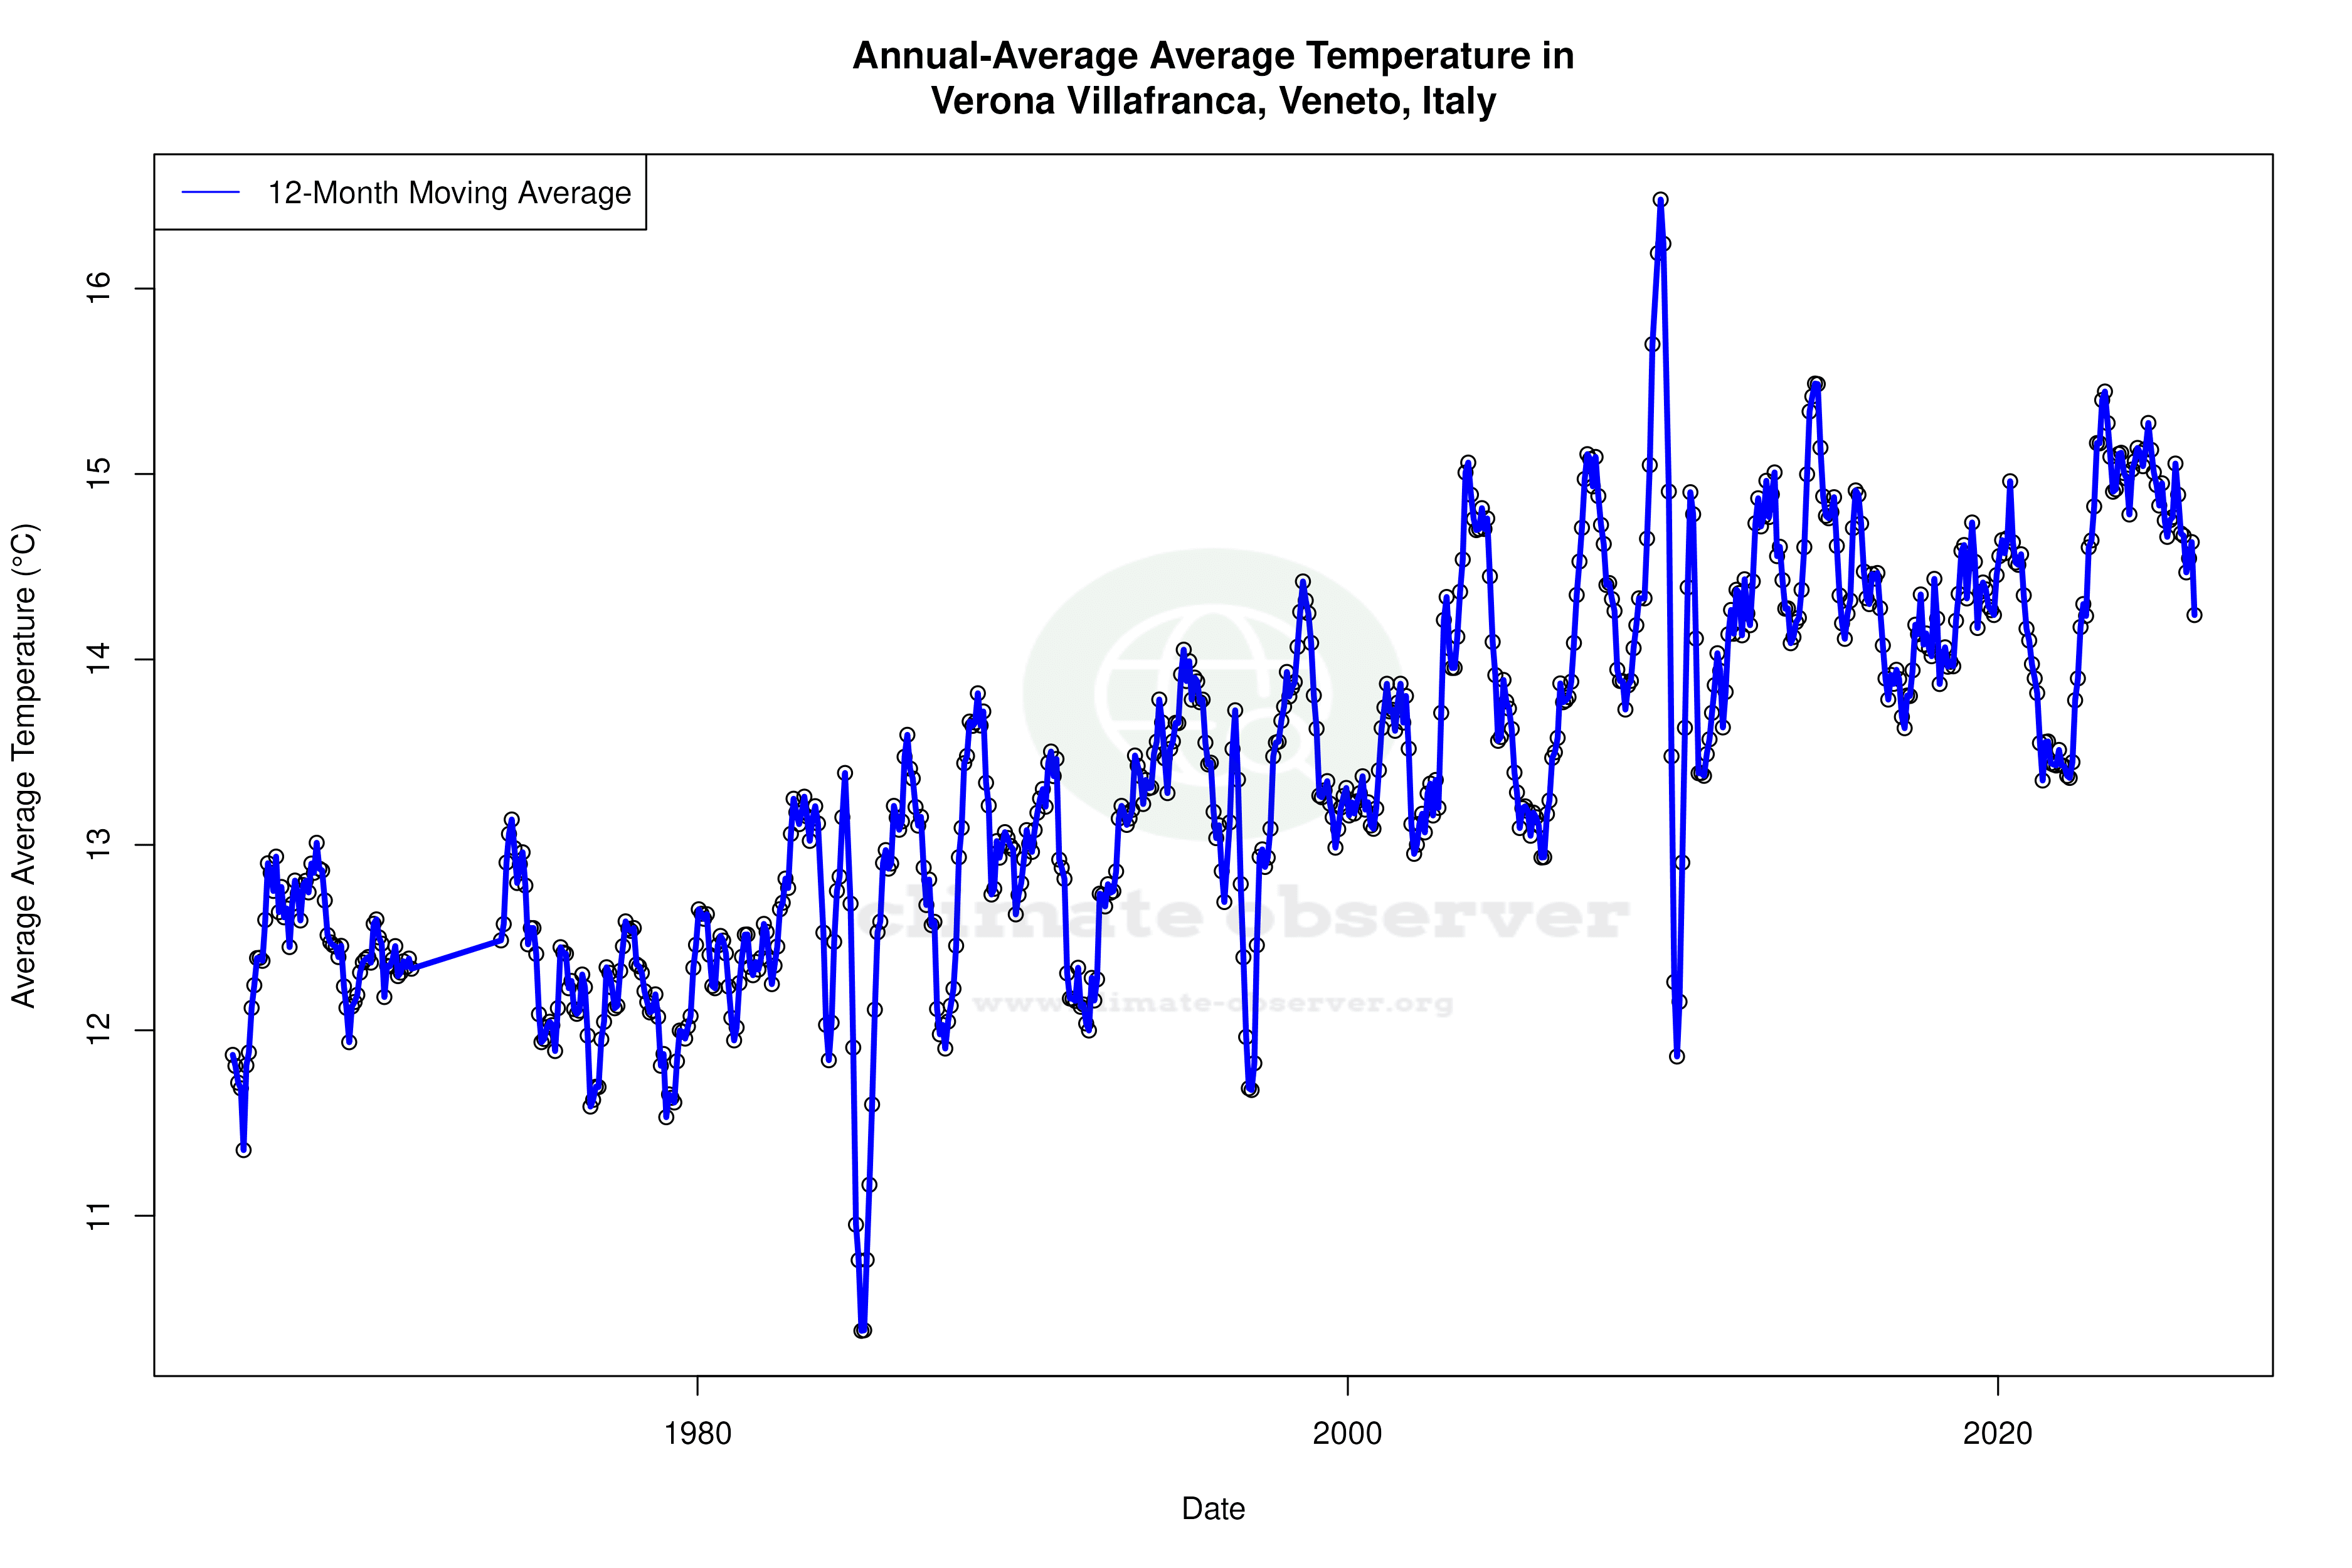


Max Temperature 12-Month MA | 1 of 6
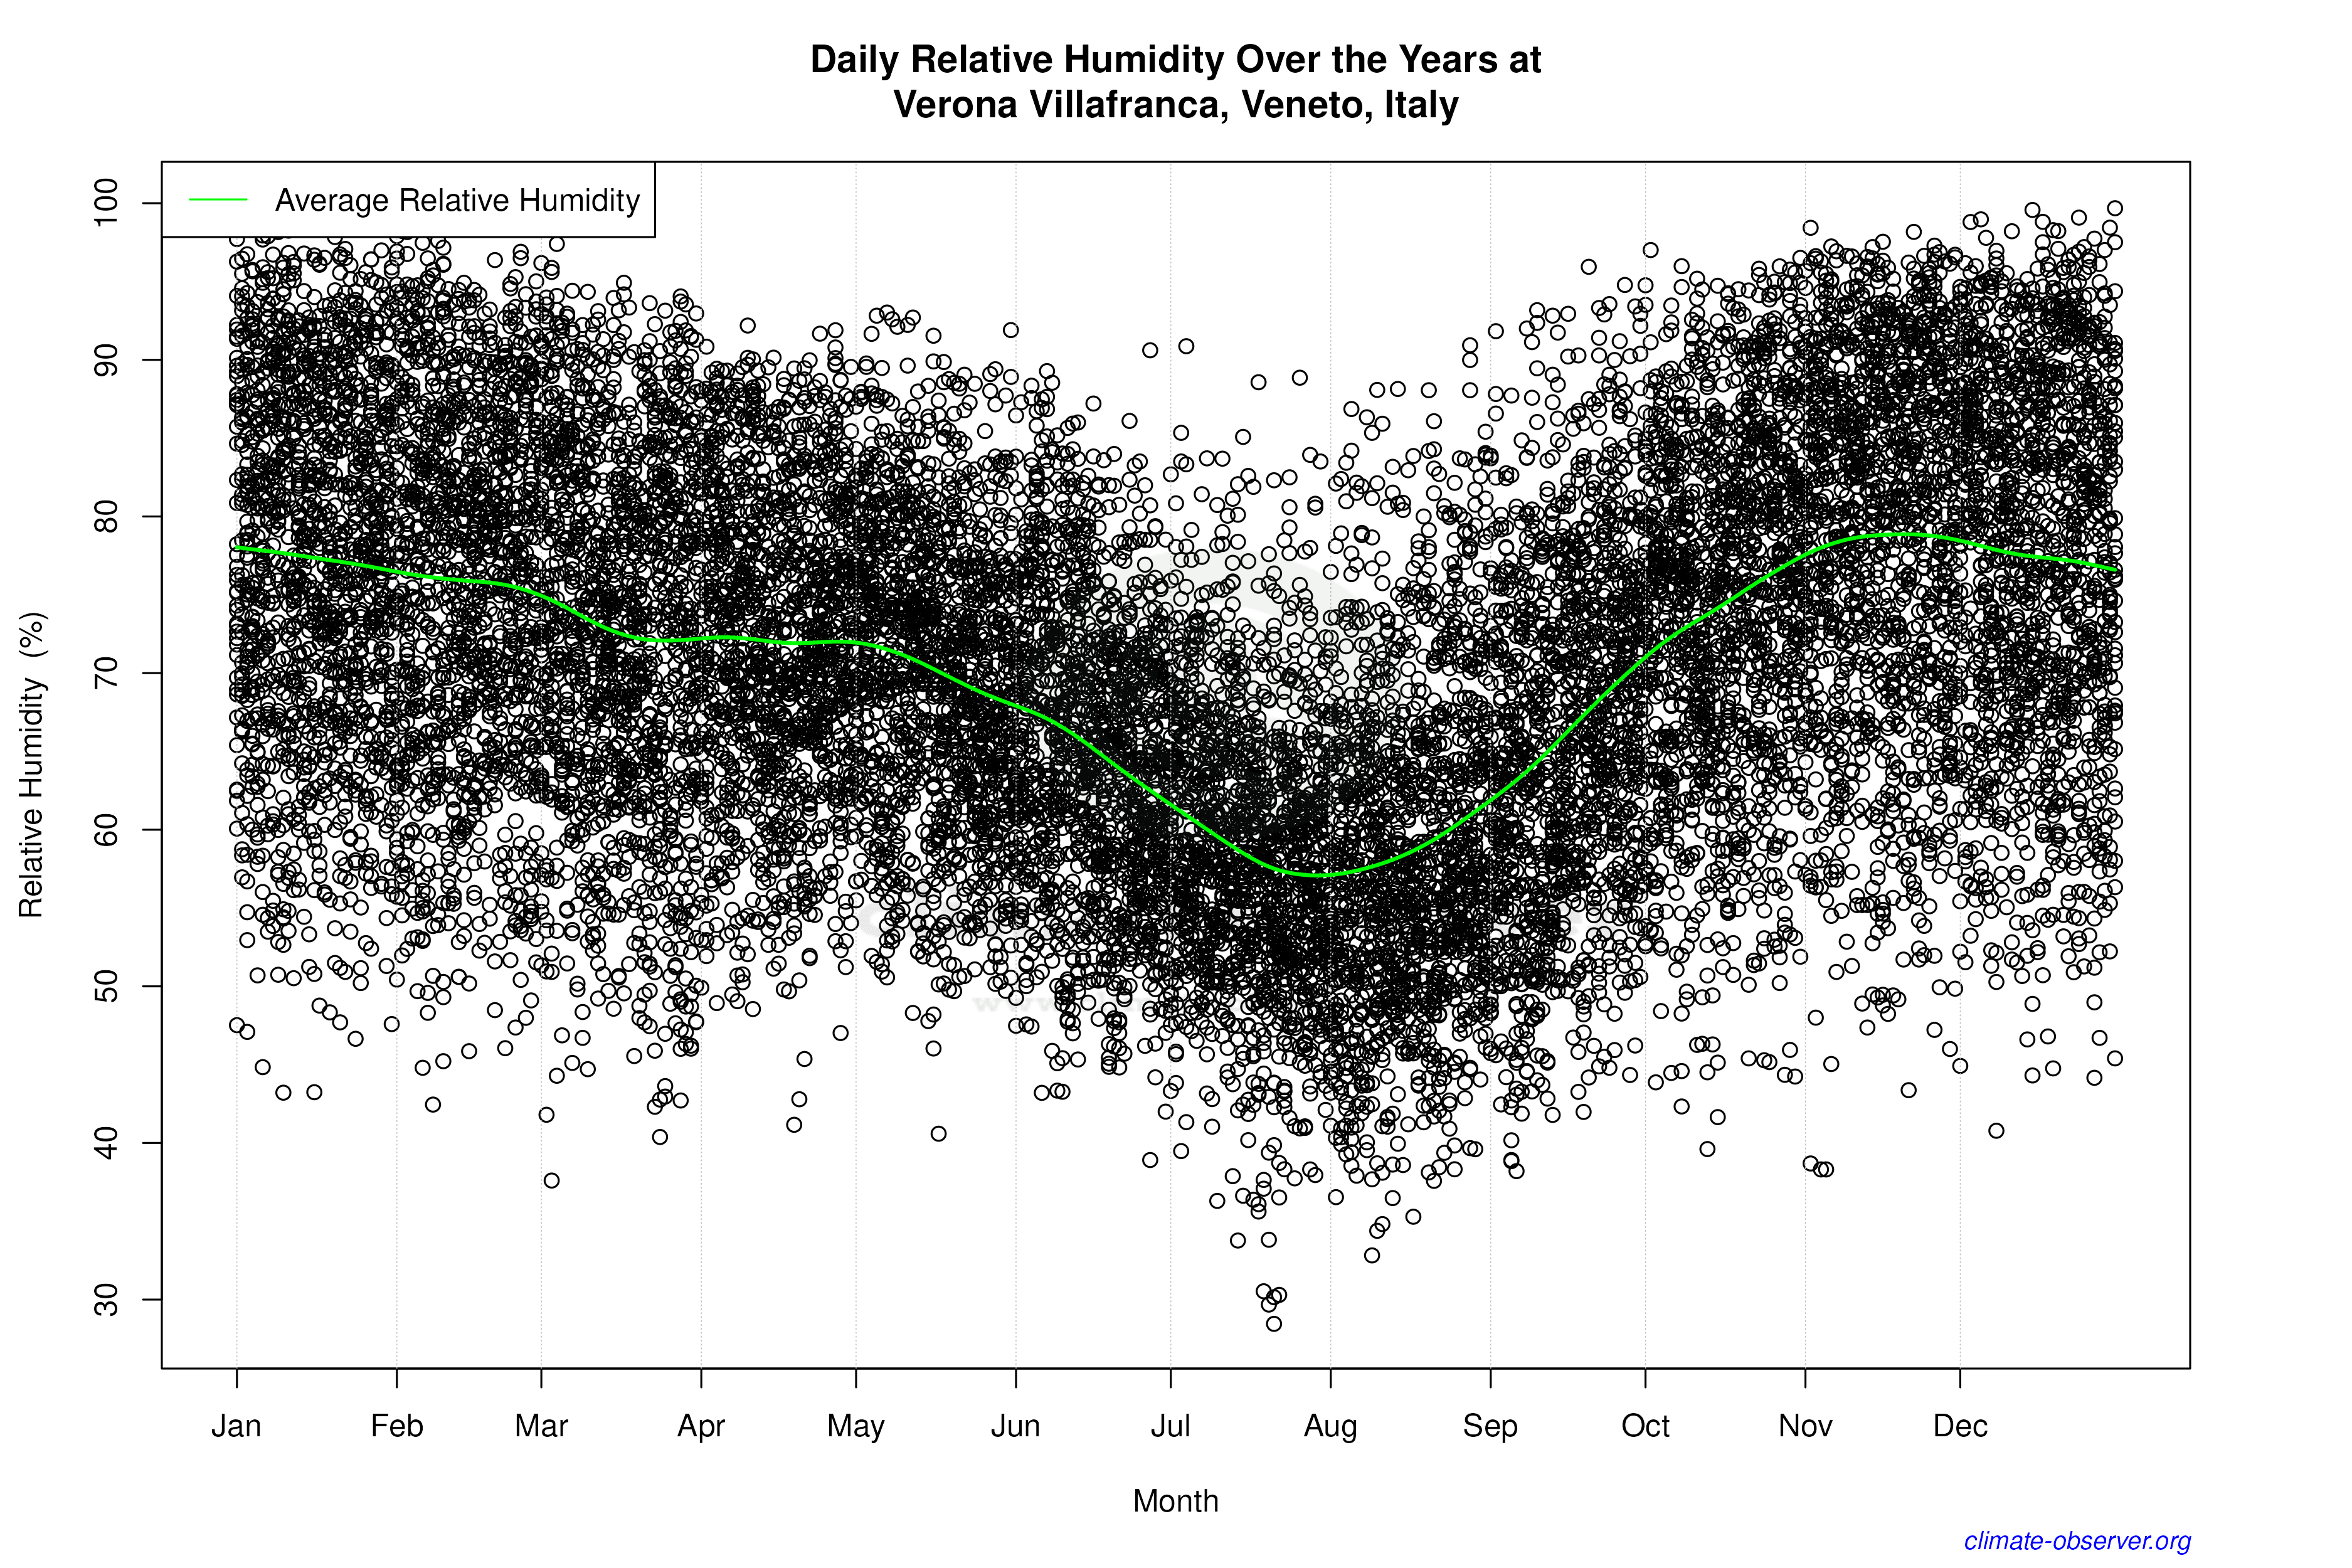
Daily Data Points and Averages Throughout the Year
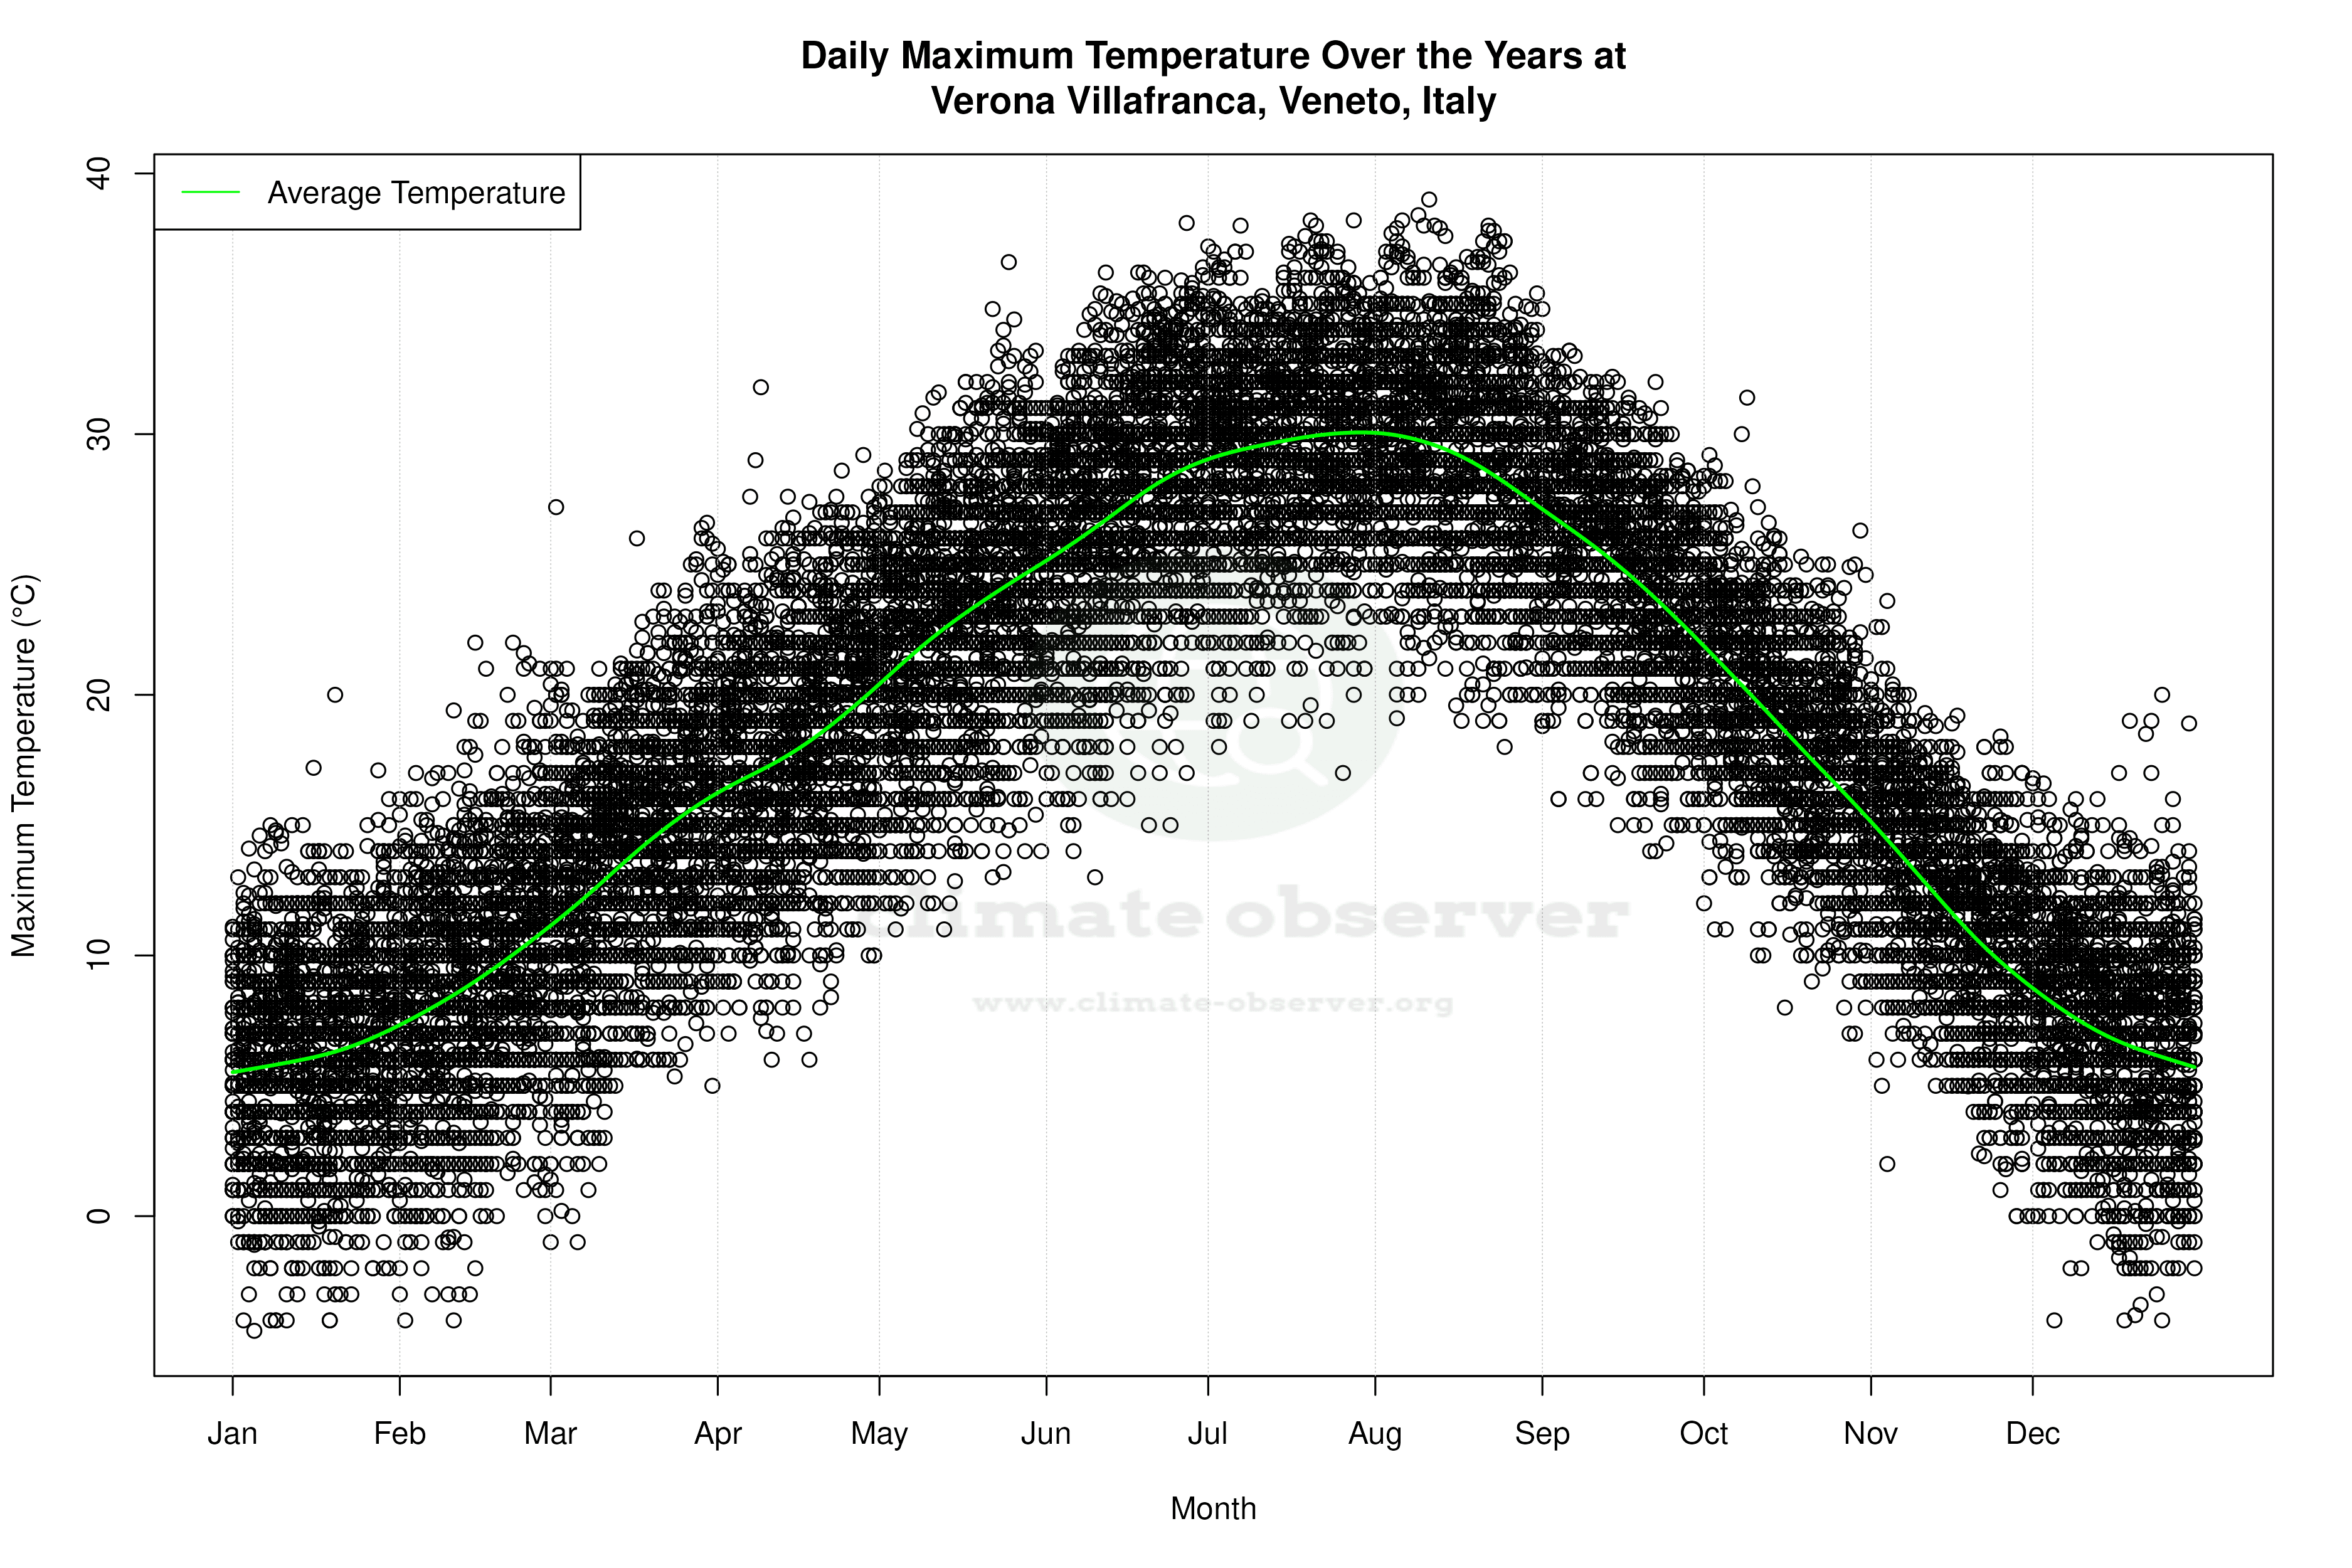

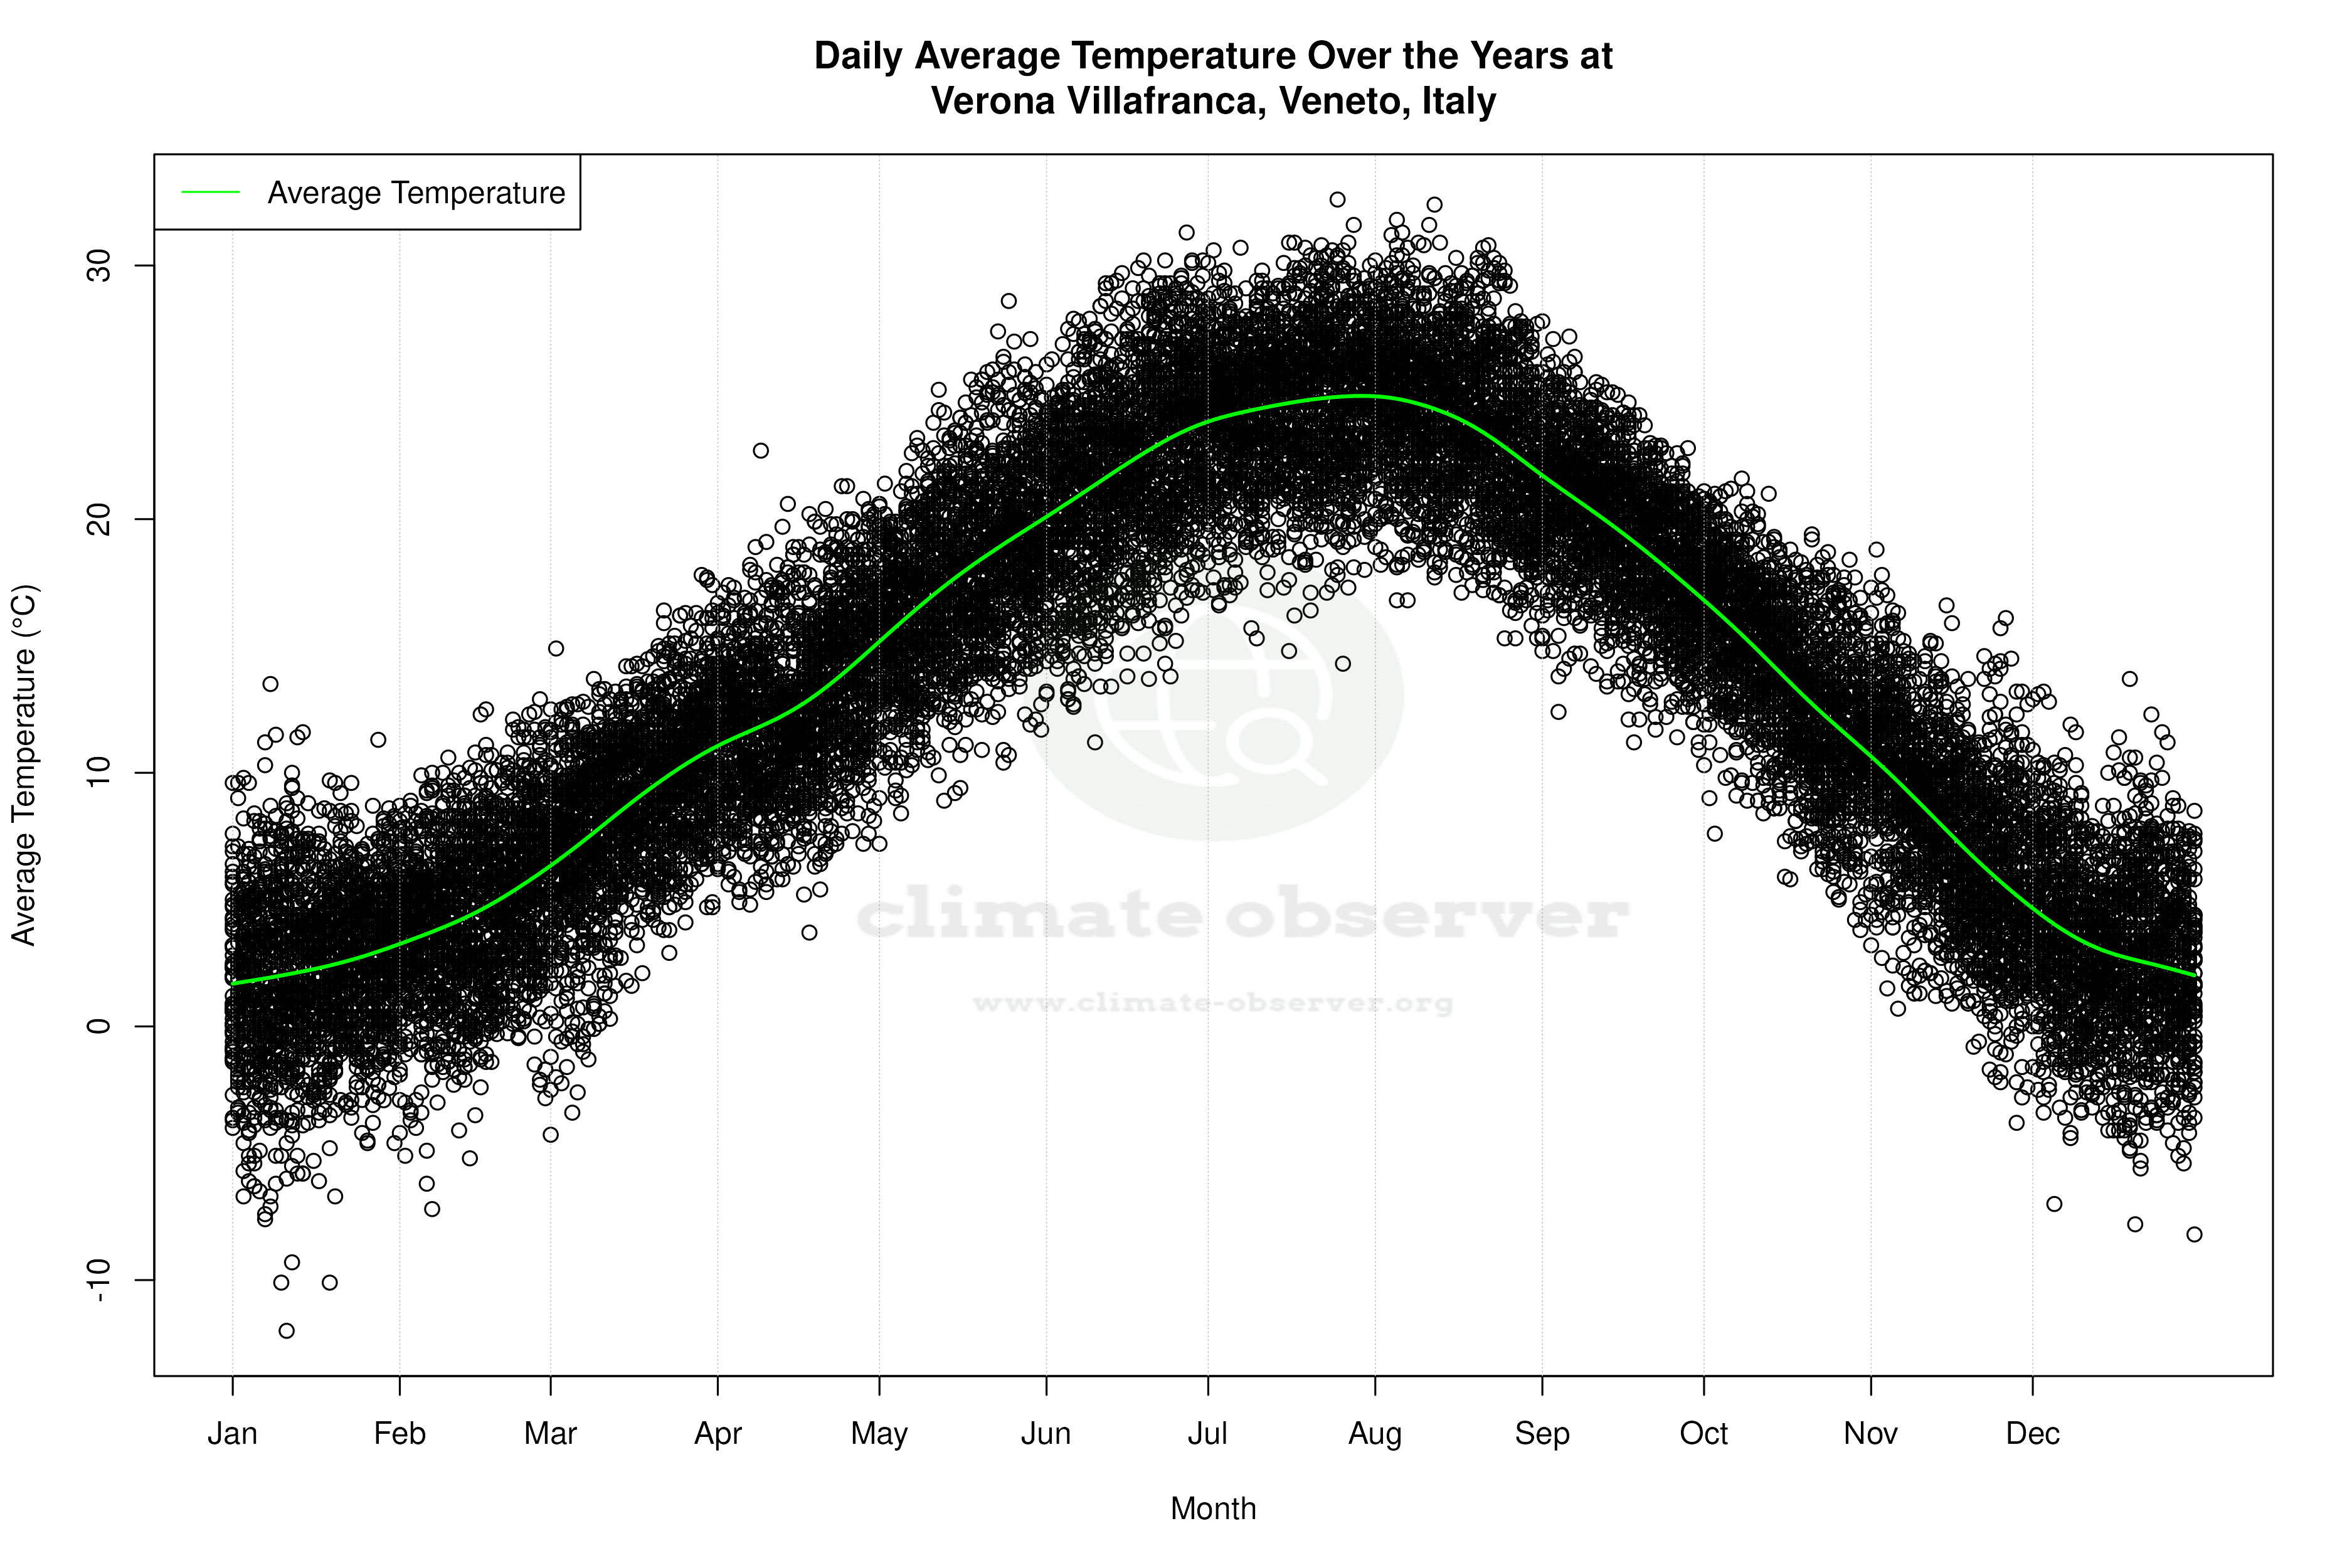

Average Max Temperature Throughout Year | 1 of 5
