Climate for Station: Gagnoa, Goh-Djiboua, Cote D'Ivoire
Loading live weather...
Climate Analysis & Overview
Gagnoa, located in the heart of Côte d'Ivoire, is experiencing a warming trend with notable increases in both high and low temperatures over the past decade. Precipitation patterns have become slightly more evenly distributed, reflecting a subtle shift in the region's climate dynamics.
Tropical Climate Dynamics
Gagnoa, situated at coordinates 6.13°N, -5.95°W, falls under the Köppen climate classification of Aw, indicating a tropical savanna climate with a distinct wet and dry season. The region's geography, characterised by its proximity to the equator and relatively flat terrain, influences its warm temperatures and seasonal rainfall patterns. Over the past decade, Gagnoa has experienced a warming trend, with high temperatures increasing by 0.06°C (0.11°F) and low temperatures rising significantly by 1.49°C (2.68°F). These changes suggest an intensification of the region's thermal profile, potentially impacting local agriculture and water resources.
Long-term Thermal Shifts
Examining the all-time temperature trends, Gagnoa has seen a rise in high temperatures by 0.23°C (0.42°F), while low temperatures have increased by 0.13°C (0.23°F). This long-term warming trend aligns with global climate patterns, where rising temperatures are a common theme. The record high of 43.3°C (109.9°F) and the record low of 10.2°C (50.4°F) illustrate the range of temperatures experienced in the region, highlighting the potential for extreme weather events.
Evolving Precipitation Patterns
The Precipitation Concentration Index (PCI) for Gagnoa shows a slight decrease from a baseline of 12.5 to a current value of 11.5. The PCI measures how precipitation is distributed over time, with a decrease indicating a more even distribution of rainfall events. This subtle change suggests that rainfall in Gagnoa has become more consistent throughout the year, which could benefit agricultural planning and water management strategies.
Regional Climate Considerations
Côte d'Ivoire has been actively pursuing climate resilience strategies, focusing on sustainable agriculture and water resource management to combat the impacts of climate change. The warming trends observed in Gagnoa could influence these regional goals, necessitating adaptive measures to ensure food security and resource sustainability. Recent weather events, such as unseasonal heavy rains or prolonged dry spells, underscore the importance of understanding and adapting to these climatic shifts.
Implications for Local Ecosystems
The warming trends and evolving precipitation patterns in Gagnoa have implications for local ecosystems, particularly in terms of biodiversity and habitat stability. As temperatures rise, species may need to adapt or migrate to maintain their ecological niches. Additionally, changes in rainfall distribution could affect the availability of water resources, impacting both natural ecosystems and human communities reliant on consistent water supply.
Station Statistics
10-Year Trend
High: -0.21 °C/decade
Low: +1.49 °C/decade
Rain: -1.34 mm/decade
25-Year Trend
High: -0.10 °C/decade
Low: +0.30 °C/decade
Rain: +0.13 mm/decade
50-Year Trend
High: +0.32 °C/decade
Low: +0.20 °C/decade
Rain: +0.13 mm/decade
All-Time Trend
High: +0.22 °C/decade
Low: +0.13 °C/decade
Rain: +0.05 mm/decade
Percentage Above-Average Days
Last 12 Months: 44.9%
This Year: 40.1%
Precipitation Concentration Index (PCI) ℹ️
Last 12 Months: 13.2
Historical Average: 11.8
Percentile Rank of Last 12 Months ℹ️
High: 48th percentile
Low: 99th percentile
Rain: 18th percentile
Change in Variance ℹ️
High: -5.8%
Low: -17.1%
Intraday: -2.2%
Data Coverage
89.5%
First Year of Data
1945
Station Location
Historical Weather Records
| Max High | Avg High | Min High | Max Avg | Avg Avg | Min Avg | Max Low | Avg Low | Min Low | Max Precipitation | Avg Precipitation | Max Snow | Avg Snow | |
|---|---|---|---|---|---|---|---|---|---|---|---|---|---|
| Record | 43.3 °C | — | 20.2 °C | 35.0 °C | — | 18.3 °C | 26.7 °C | — | 10.2 °C | 152.9 mm | — | — | — |
| January | 43.3 °C | 32.7 °C | 25.0 °C | 35.0 °C | 26.6 °C | 18.3 °C | 26.3 °C | 20.9 °C | 10.2 °C | 98.3 mm | 0.9 mm | — | — |
| February | 40.4 °C | 33.8 °C | 24.5 °C | 32.5 °C | 27.7 °C | 21.4 °C | 26.7 °C | 22.3 °C | 13.1 °C | 122.8 mm | 2.7 mm | — | — |
| March | 39.1 °C | 33.3 °C | 25.2 °C | 31.8 °C | 27.5 °C | 23.4 °C | 26.2 °C | 22.5 °C | 16.5 °C | 80.0 mm | 4.7 mm | — | — |
| April | 39.3 °C | 32.8 °C | 25.1 °C | 32.4 °C | 27.3 °C | 21.8 °C | 26.7 °C | 22.6 °C | 17.5 °C | 152.9 mm | 5.8 mm | — | — |
| May | 36.0 °C | 31.7 °C | 24.7 °C | 30.7 °C | 26.7 °C | 22.3 °C | 26.5 °C | 22.6 °C | 18.8 °C | 99.1 mm | 6.2 mm | — | — |
| June | 39.5 °C | 30.0 °C | 23.7 °C | 29.8 °C | 25.6 °C | 21.4 °C | 25.4 °C | 22.1 °C | 18.0 °C | 91.9 mm | 7.2 mm | — | — |
| July | 38.3 °C | 28.9 °C | 23.8 °C | 28.1 °C | 24.9 °C | 21.4 °C | 24.0 °C | 21.4 °C | 17.2 °C | 98.5 mm | 3.3 mm | — | — |
| August | 34.1 °C | 28.8 °C | 20.2 °C | 29.7 °C | 24.7 °C | 19.6 °C | 23.6 °C | 21.3 °C | 16.6 °C | 65.8 mm | 3.0 mm | — | — |
| September | 37.0 °C | 30.0 °C | 24.2 °C | 29.6 °C | 25.3 °C | 21.2 °C | 24.6 °C | 21.8 °C | 18.6 °C | 117.5 mm | 5.6 mm | — | — |
| October | 37.8 °C | 30.9 °C | 24.2 °C | 31.3 °C | 25.9 °C | 22.0 °C | 24.7 °C | 22.1 °C | 19.0 °C | 118.1 mm | 5.7 mm | — | — |
| November | 36.0 °C | 31.5 °C | 25.2 °C | 29.8 °C | 26.3 °C | 22.4 °C | 24.8 °C | 22.1 °C | 17.4 °C | 111.7 mm | 3.4 mm | — | — |
| December | 36.8 °C | 31.5 °C | 25.0 °C | 30.6 °C | 26.1 °C | 20.2 °C | 25.7 °C | 21.3 °C | 12.5 °C | 67.7 mm | 1.5 mm | — | — |
Data Visualisations
Remove WatermarksCurrent Year Climate Trends vs Historical


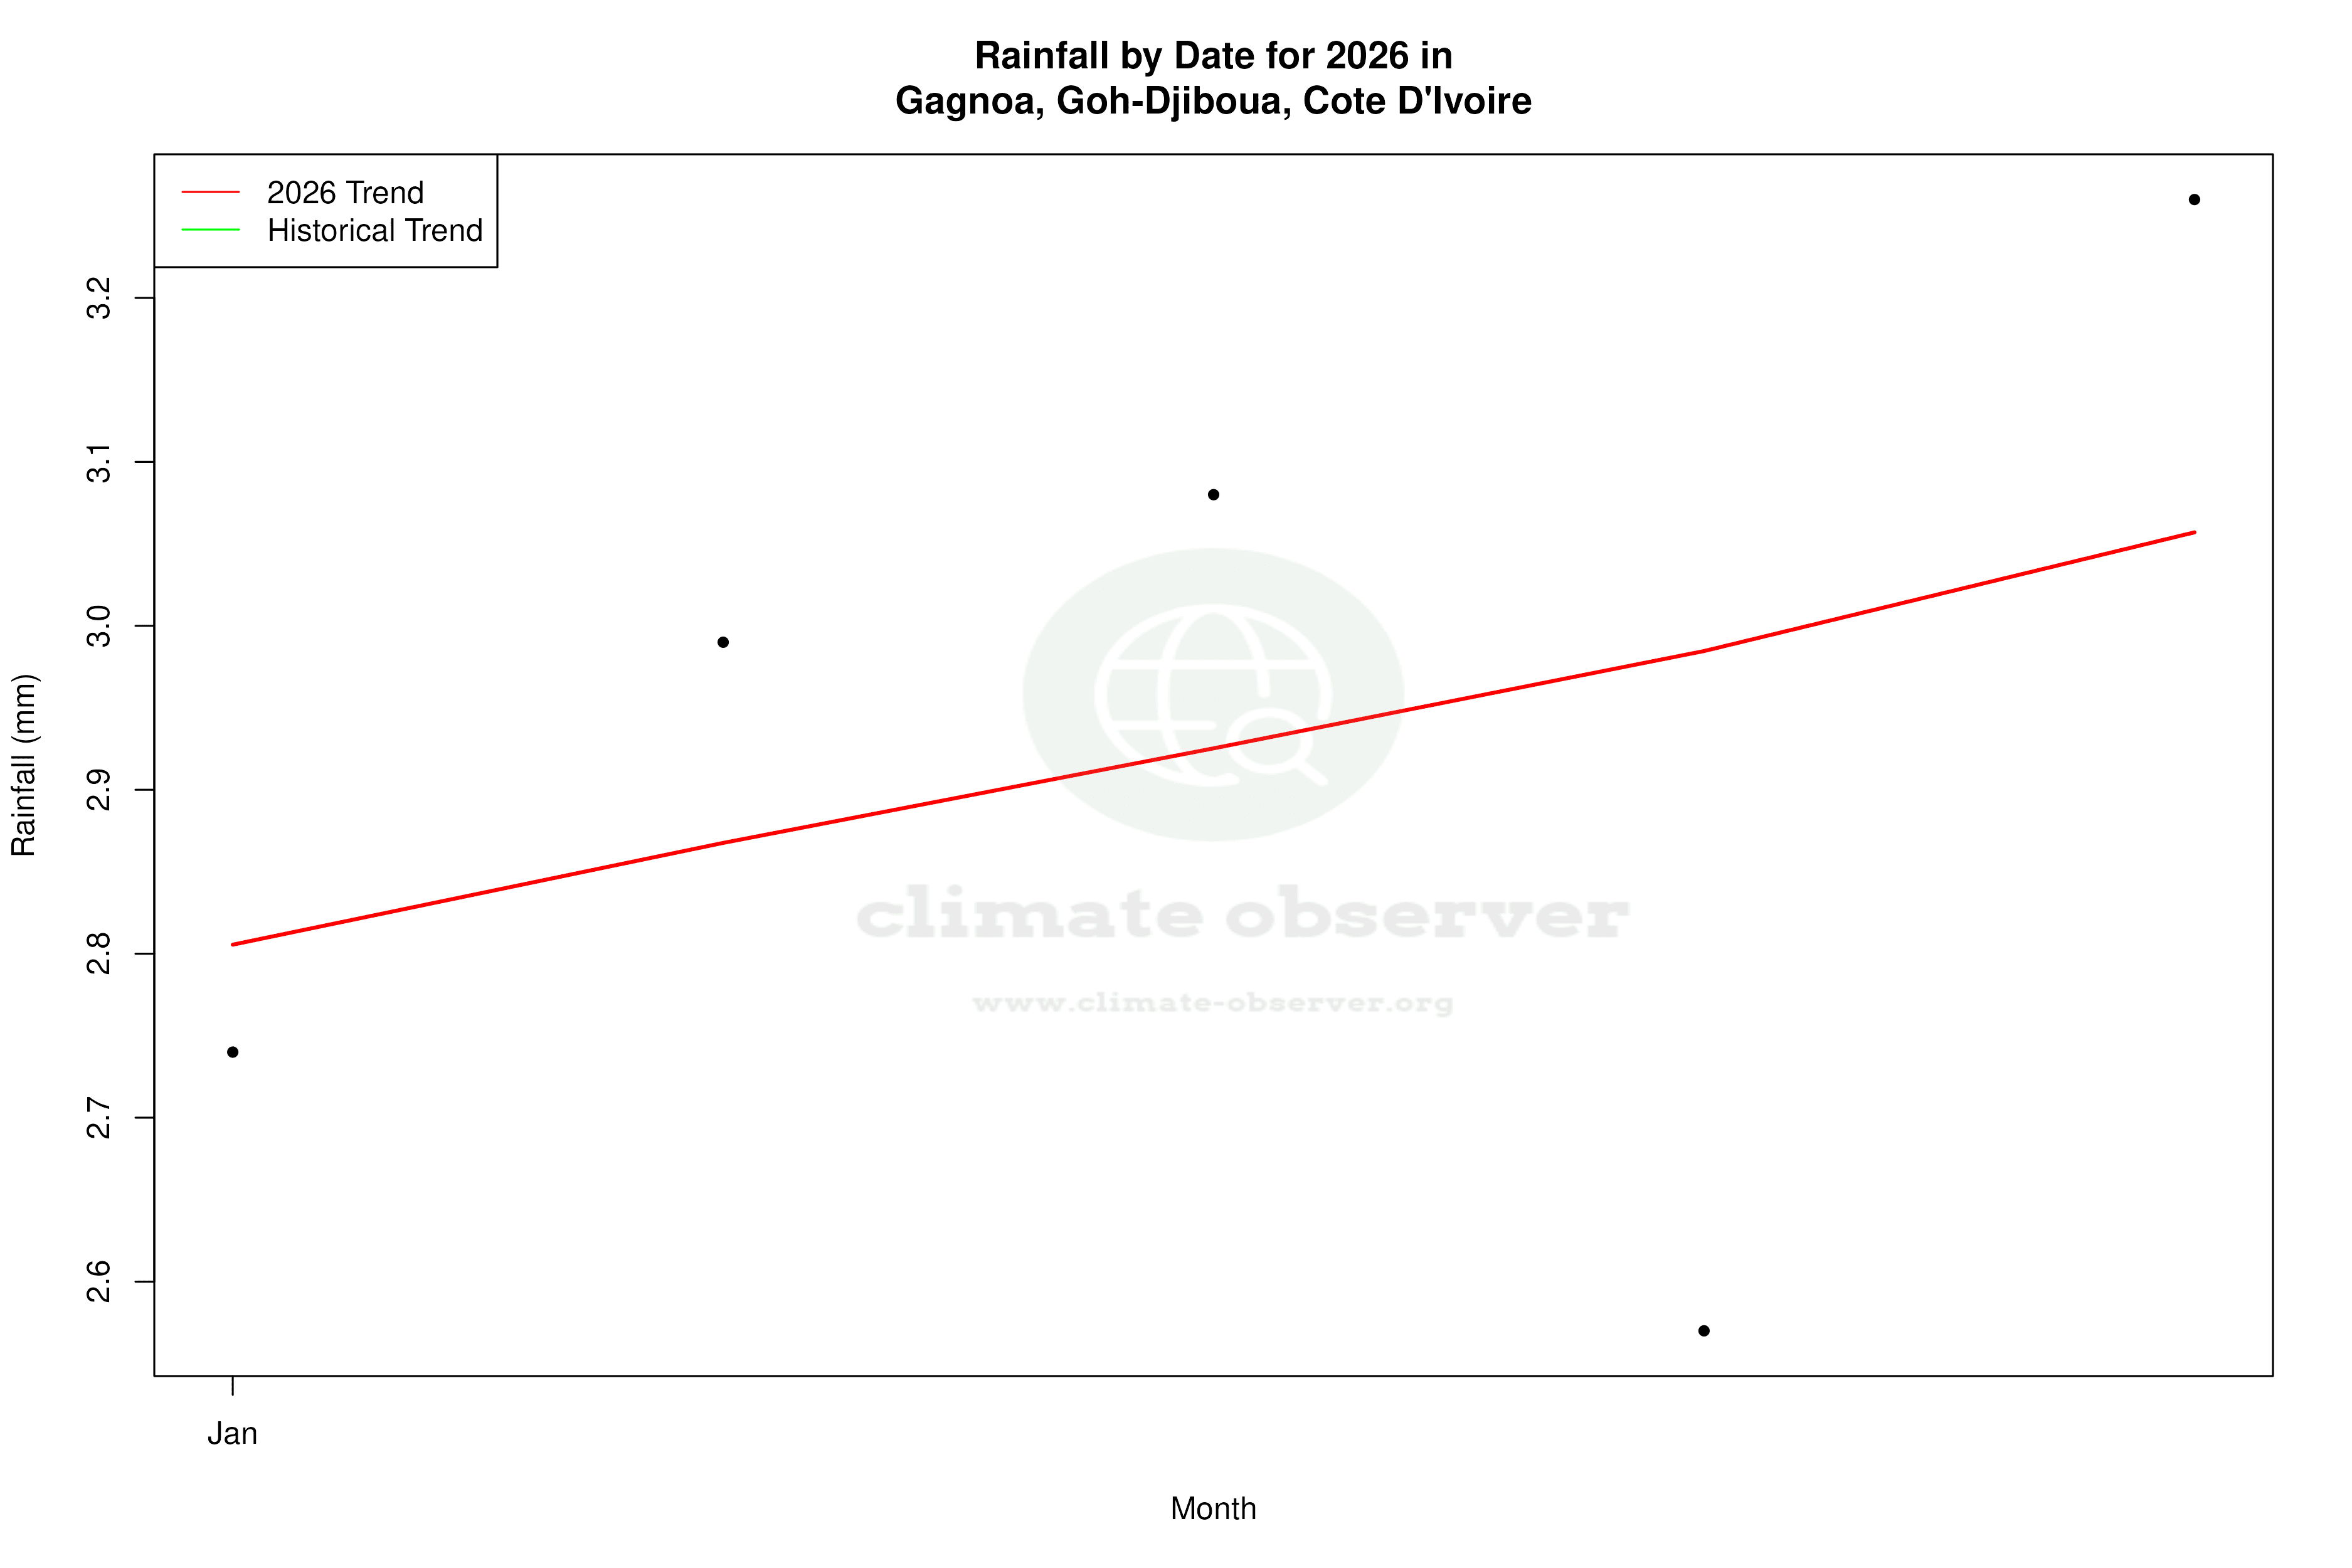


Max Temperature this Year | 1 of 6
Climate 12-Month Moving Averages
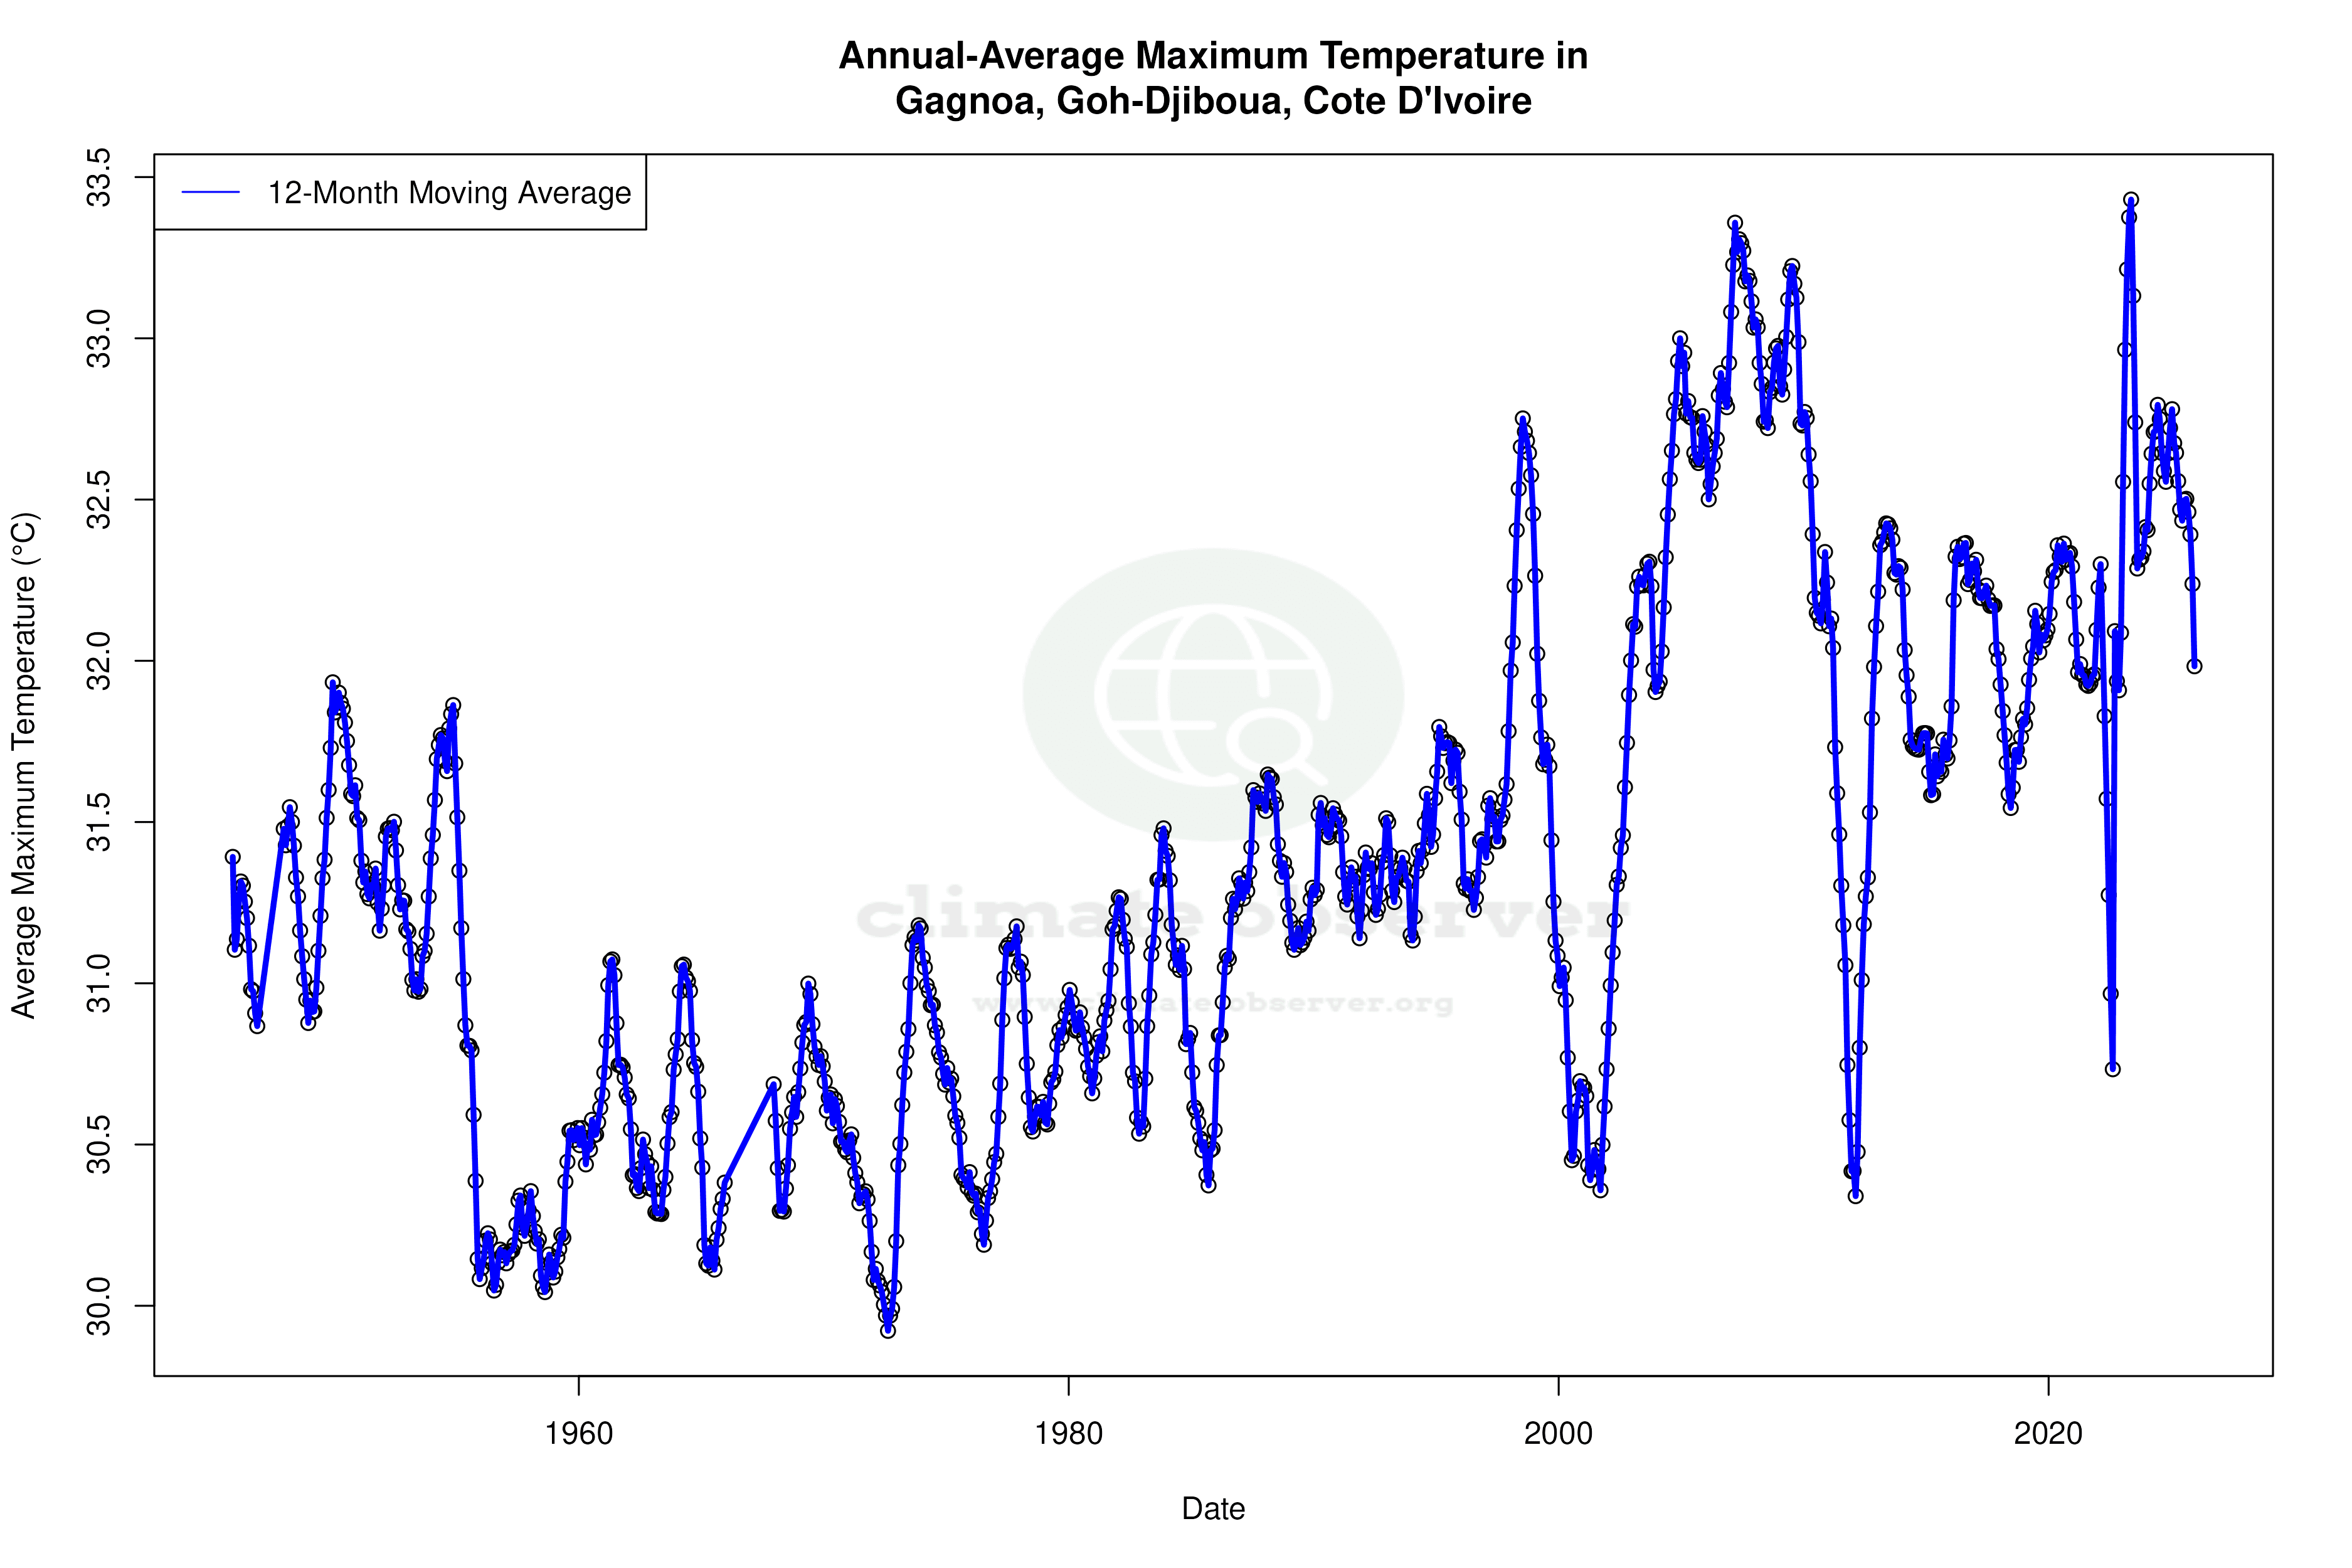


Max Temperature 12-Month MA | 1 of 6
Daily Data Points and Averages Throughout the Year


Average Max Temperature Throughout Year | 1 of 5
