Climate for Station: Kut-Al-Hai, Wasit Governorate, Iraq
Loading live weather...
Climate Analysis & Overview
The climate profile of Kut-Al-Hai reveals a complex interplay of warming and cooling trends, with a notable increase in temperature extremes and a shift towards more concentrated precipitation events. These changes underscore the broader climate dynamics affecting Iraq and its regional climate goals.
Geographical Context and Climate Classification
Located at 32.17°N, 46.05°E, Kut-Al-Hai falls under the Köppen climate classification of BWh, indicating a hot desert climate. This region is characterised by extremely high temperatures in the summer and mild winters. The Euphrates River, which flows nearby, provides a modicum of moisture to an otherwise arid landscape, impacting local microclimates and contributing to occasional variability in temperature and precipitation patterns.
Temperature Trends: A Dichotomy of Extremes
Over the past decade, Kut-Al-Hai has experienced contrasting temperature trends. The highs have shown a cooling trend of -0.27°C (-0.49°F), while the lows have risen by 0.90°C (1.62°F). This divergence suggests a narrowing of the diurnal temperature range, potentially affecting local agriculture and energy consumption patterns. The all-time trends, however, indicate a warming pattern with highs increasing by 0.19°C (0.34°F) and lows by 0.43°C (0.77°F). This long-term warming aligns with Iraq's broader climate challenges, as the nation seeks to mitigate the impacts of rising temperatures.
Record Temperatures: Extremes in Focus
Kut-Al-Hai's temperature records are marked by significant extremes, with a maximum of 52.89°C (127.20°F) and a minimum of -5.01°C (22.98°F). These records highlight the region's susceptibility to extreme weather events, which are becoming more frequent and intense as global temperatures rise. Such extremes pose challenges to infrastructure and public health, necessitating adaptive strategies to cope with heatwaves and cold spells.
Precipitation Patterns: A Shift Towards Concentration
The Precipitation Concentration Index (PCI) for Kut-Al-Hai has increased from a baseline of 25.90 to a current value of 27.58. This rise indicates a shift towards more concentrated precipitation events, where rainfall occurs in fewer, more intense bursts. Such changes can lead to increased risk of flooding and soil erosion, impacting agriculture and water management in the region. The PCI value above 20 suggests highly concentrated precipitation, necessitating improved infrastructure to manage these intense rainfall events.
Regional Climate Goals and Implications
Iraq's regional climate goals focus on adapting to and mitigating the impacts of climate change, with particular emphasis on managing water resources and reducing vulnerability to extreme weather. The trends observed in Kut-Al-Hai, including the warming lows and concentrated precipitation, highlight the urgency of these goals. As the nation grapples with these challenges, understanding localised climate dynamics becomes crucial for effective policy-making and sustainable development.
Station Statistics
10-Year Trend
High: +0.22 °C/decade
Low: +0.78 °C/decade
Rain: -0.02 mm/decade
25-Year Trend
High: -0.03 °C/decade
Low: +0.92 °C/decade
Rain: -0.14 mm/decade
50-Year Trend
High: +0.07 °C/decade
Low: +0.47 °C/decade
Rain: +0.04 mm/decade
All-Time Trend
High: +0.20 °C/decade
Low: +0.42 °C/decade
Rain: +0.03 mm/decade
Percentage Above-Average Days
Last 12 Months: 53.7%
This Year: 60.5%
Precipitation Concentration Index (PCI) ℹ️
Last 12 Months: 35.2
Historical Average: 27.7
Percentile Rank of Last 12 Months ℹ️
High: 54th percentile
Low: 93rd percentile
Rain: 20th percentile
Change in Variance ℹ️
High: +0.8%
Low: -0.9%
Intraday: +8.9%
Data Coverage
73.6%
First Year of Data
1949
Station Location
Historical Weather Records
| Max High | Avg High | Min High | Max Avg | Avg Avg | Min Avg | Max Low | Avg Low | Min Low | Max Precipitation | Avg Precipitation | Max Snow | Avg Snow | |
|---|---|---|---|---|---|---|---|---|---|---|---|---|---|
| Record | 52.9 °C | — | 5.6 °C | 45.0 °C | — | -1.3 °C | 39.9 °C | — | -5.0 °C | 53.8 mm | — | — | — |
| January | 28.8 °C | 17.7 °C | 5.6 °C | 20.6 °C | 11.3 °C | -1.3 °C | 16.1 °C | 5.5 °C | -5.0 °C | 53.8 mm | 0.9 mm | — | — |
| February | 30.8 °C | 20.4 °C | 6.8 °C | 24.4 °C | 13.6 °C | 2.9 °C | 17.6 °C | 7.1 °C | -3.8 °C | 39.6 mm | 0.8 mm | — | — |
| March | 42.4 °C | 25.5 °C | 12.0 °C | 32.1 °C | 18.2 °C | 6.7 °C | 22.1 °C | 11.1 °C | -2.3 °C | 40.0 mm | 0.8 mm | — | — |
| April | 43.4 °C | 32.5 °C | 16.3 °C | 35.0 °C | 24.7 °C | 11.9 °C | 29.2 °C | 17.1 °C | 3.0 °C | 30.7 mm | 0.5 mm | — | — |
| May | 50.0 °C | 39.0 °C | 25.1 °C | 41.7 °C | 31.2 °C | 20.2 °C | 32.4 °C | 23.1 °C | 12.6 °C | 32.1 mm | 0.2 mm | — | — |
| June | 51.4 °C | 44.0 °C | 33.0 °C | 43.4 °C | 36.0 °C | 26.1 °C | 36.1 °C | 27.4 °C | 18.9 °C | 1.7 mm | 0.0 mm | — | — |
| July | 52.9 °C | 46.1 °C | 38.0 °C | 45.0 °C | 38.1 °C | 29.8 °C | 39.9 °C | 29.7 °C | 21.0 °C | 15.0 mm | 0.0 mm | — | — |
| August | 52.0 °C | 46.1 °C | 37.8 °C | 44.3 °C | 37.6 °C | 27.5 °C | 38.1 °C | 29.3 °C | 19.2 °C | 5.7 mm | 0.0 mm | — | — |
| September | 50.2 °C | 42.7 °C | 31.7 °C | 42.9 °C | 34.0 °C | 23.2 °C | 35.2 °C | 25.6 °C | 16.1 °C | 6.3 mm | 0.0 mm | — | — |
| October | 45.0 °C | 35.8 °C | 22.3 °C | 36.8 °C | 27.5 °C | 14.0 °C | 29.6 °C | 20.3 °C | 8.9 °C | 38.3 mm | 0.3 mm | — | — |
| November | 36.5 °C | 25.9 °C | 12.2 °C | 29.0 °C | 18.8 °C | 7.1 °C | 22.9 °C | 12.8 °C | 0.5 °C | 46.1 mm | 0.8 mm | — | — |
| December | 30.2 °C | 19.4 °C | 6.5 °C | 22.2 °C | 13.0 °C | 2.9 °C | 17.3 °C | 7.5 °C | -3.6 °C | 51.9 mm | 0.8 mm | — | — |
Data Visualisations
Remove WatermarksCurrent Year Climate Trends vs Historical


Max Temperature this Year | 1 of 6
Climate 12-Month Moving Averages


Max Temperature 12-Month MA | 1 of 6
Daily Data Points and Averages Throughout the Year


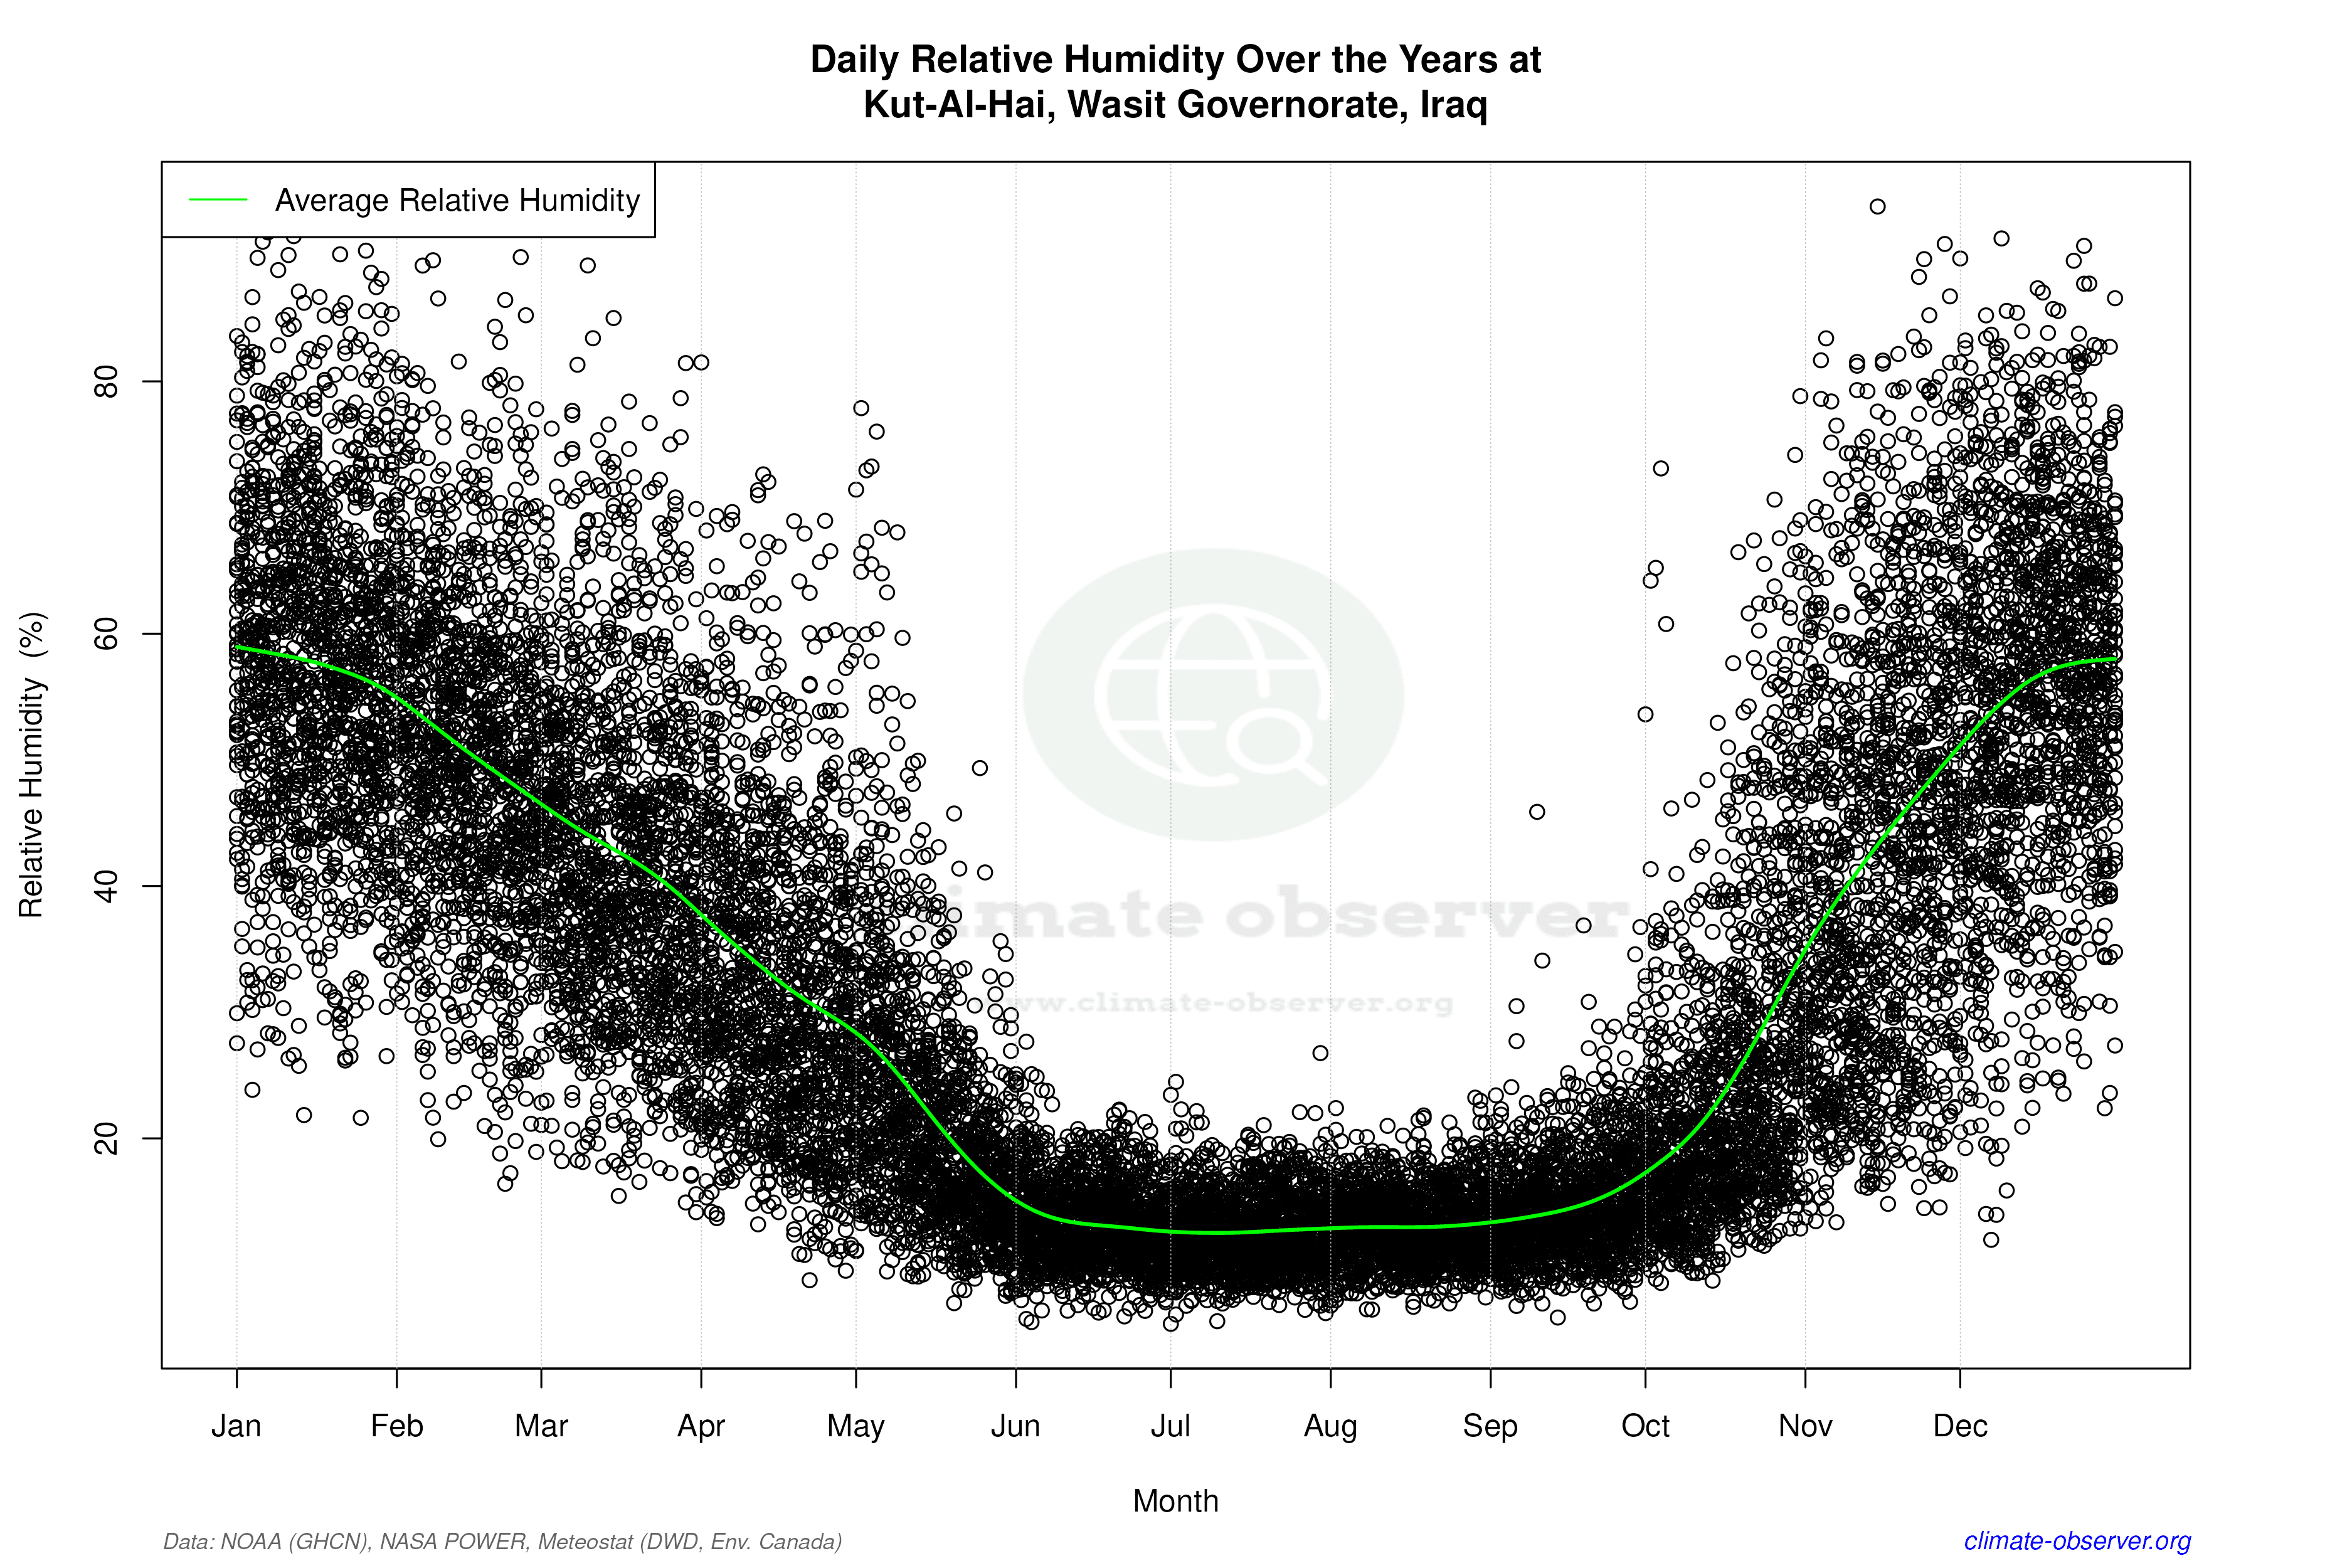

Average Max Temperature Throughout Year | 1 of 5
