Climate for Station: Kitamiesashi, Hokkaido, Japan
Loading live weather...
Climate Analysis & Overview
Kitamiesashi, located in northern Hokkaido, is experiencing a warming trend, with significant increases in both high and low temperatures over the past decade. Precipitation patterns have become slightly more even, reflecting a subtle shift in climate dynamics. These changes align with Japan's broader climate goals of reducing greenhouse gas emissions and adapting to climate variability.
Warming Trends in Northern Hokkaido
Kitamiesashi, situated at latitude 44.933 and longitude 142.583, lies within the humid continental climate zone, characterised by cold winters and warm summers. Over the past decade, the region has experienced a pronounced warming trend, with high temperatures increasing by 2.14°C (3.85°F) and low temperatures by 2.68°C (4.83°F). This recent warming is more pronounced than the all-time trends, which show a more modest rise in highs by 0.15°C (0.27°F) and lows by 0.24°C (0.43°F). These trends suggest a significant shift in temperature dynamics, possibly influenced by the area's coastal proximity and the moderating effects of the Sea of Japan.
Temperature Extremes: A New Normal?
Temperature extremes in Kitamiesashi highlight the region's climatic variability. The highest recorded temperature is 35.0°C (95.0°F), while the lowest is -23.9°C (-11.0°F). These extremes underscore the challenges faced by local ecosystems and communities in adapting to such temperature fluctuations. The increase in average temperatures could lead to more frequent occurrences of these extremes, impacting agriculture and energy consumption.
Precipitation Patterns: A Subtle Shift
The Precipitation Concentration Index (PCI) in Kitamiesashi has seen a slight decrease from a baseline of 11.13 to a current value of 10.50. This indicates a marginal shift towards more evenly distributed precipitation events. For the local population, this could mean fewer intense rainfall events and more consistent water availability, which is crucial for agriculture and water resource management. The PCI provides insight into how precipitation is distributed over time, with lower values suggesting more even distribution.
Implications for Regional Climate Goals
Japan has set ambitious climate goals, including reducing greenhouse gas emissions and enhancing resilience to climate change. The warming trends observed in Kitamiesashi align with national efforts to monitor and mitigate climate impacts. As temperatures rise, the region may need to adapt its agricultural practices and infrastructure to cope with the changing climate. The slight shift towards more evenly distributed precipitation could offer some relief in terms of water management, but ongoing monitoring and adaptation are essential to ensure sustainability.
Geographical Influences on Climate Dynamics
Kitamiesashi's climate is shaped by its geographical features, including its proximity to the Sea of Japan and the surrounding mountainous terrain. These factors contribute to the region's unique climate patterns, such as the marked seasonal temperature variations and precipitation distribution. Understanding these influences is crucial for predicting future climate trends and implementing effective adaptation strategies.
Station Statistics
10-Year Trend
High: +2.06 °C/decade
Low: +2.81 °C/decade
Rain: -0.53 mm/decade
25-Year Trend
High: +0.61 °C/decade
Low: +0.81 °C/decade
Rain: -0.01 mm/decade
50-Year Trend
High: +0.38 °C/decade
Low: +0.41 °C/decade
Rain: +0.05 mm/decade
All-Time Trend
High: +0.15 °C/decade
Low: +0.24 °C/decade
Rain: -0.03 mm/decade
Percentage Above-Average Days
Last 12 Months: 51.2%
This Year: 44.4%
Precipitation Concentration Index (PCI) ℹ️
Last 12 Months: 10.7
Historical Average: 10.7
Percentile Rank of Last 12 Months ℹ️
High: 98th percentile
Low: 99th percentile
Rain: 42nd percentile
Change in Variance ℹ️
High: +5.0%
Low: +0.8%
Intraday: -1.9%
Data Coverage
92.6%
First Year of Data
1951
Station Location
Historical Weather Records
| Max High | Avg High | Min High | Max Avg | Avg Avg | Min Avg | Max Low | Avg Low | Min Low | Max Precipitation | Avg Precipitation | Max Snow | Avg Snow | |
|---|---|---|---|---|---|---|---|---|---|---|---|---|---|
| Record | 35.0 °C | — | -15.0 °C | 28.8 °C | — | -17.9 °C | 26.6 °C | — | -23.9 °C | 123.5 mm | — | — | — |
| January | 7.2 °C | -3.6 °C | -15.0 °C | 3.7 °C | -6.2 °C | -17.9 °C | 1.0 °C | -9.6 °C | -22.3 °C | 52.1 mm | 2.9 mm | — | — |
| February | 12.9 °C | -3.2 °C | -14.7 °C | 6.7 °C | -6.0 °C | -17.1 °C | 3.6 °C | -10.3 °C | -23.5 °C | 42.5 mm | 2.2 mm | — | — |
| March | 16.2 °C | 1.1 °C | -12.1 °C | 10.7 °C | -1.9 °C | -15.6 °C | 5.2 °C | -5.9 °C | -23.9 °C | 41.5 mm | 2.3 mm | — | — |
| April | 26.1 °C | 8.0 °C | -4.5 °C | 18.4 °C | 4.4 °C | -5.1 °C | 11.8 °C | 0.5 °C | -14.1 °C | 57.5 mm | 2.1 mm | — | — |
| May | 31.9 °C | 13.3 °C | 0.2 °C | 25.3 °C | 9.0 °C | 0.1 °C | 16.4 °C | 5.1 °C | -3.0 °C | 63.2 mm | 2.5 mm | — | — |
| June | 32.6 °C | 15.9 °C | 4.3 °C | 25.0 °C | 12.5 °C | 4.0 °C | 21.1 °C | 9.1 °C | 0.6 °C | 77.6 mm | 2.9 mm | — | — |
| July | 35.0 °C | 19.9 °C | 8.7 °C | 28.4 °C | 16.8 °C | 8.3 °C | 26.6 °C | 13.8 °C | 4.2 °C | 92.2 mm | 3.7 mm | — | — |
| August | 34.6 °C | 22.2 °C | 12.5 °C | 28.8 °C | 19.0 °C | 11.9 °C | 24.5 °C | 16.0 °C | 6.6 °C | 123.5 mm | 4.8 mm | — | — |
| September | 32.1 °C | 20.1 °C | 8.1 °C | 25.3 °C | 16.1 °C | 6.8 °C | 21.8 °C | 12.4 °C | 2.6 °C | 103.1 mm | 4.6 mm | — | — |
| October | 27.7 °C | 14.0 °C | 1.1 °C | 21.3 °C | 9.9 °C | -0.8 °C | 17.4 °C | 5.9 °C | -3.1 °C | 103.9 mm | 4.2 mm | — | — |
| November | 21.1 °C | 5.6 °C | -8.5 °C | 15.1 °C | 2.6 °C | -9.8 °C | 10.9 °C | -0.6 °C | -11.5 °C | 74.4 mm | 4.3 mm | — | — |
| December | 12.4 °C | -0.7 °C | -13.4 °C | 7.8 °C | -3.2 °C | -12.9 °C | 3.8 °C | -6.2 °C | -19.2 °C | 85.0 mm | 3.5 mm | — | — |
Data Visualisations
Remove WatermarksCurrent Year Climate Trends vs Historical


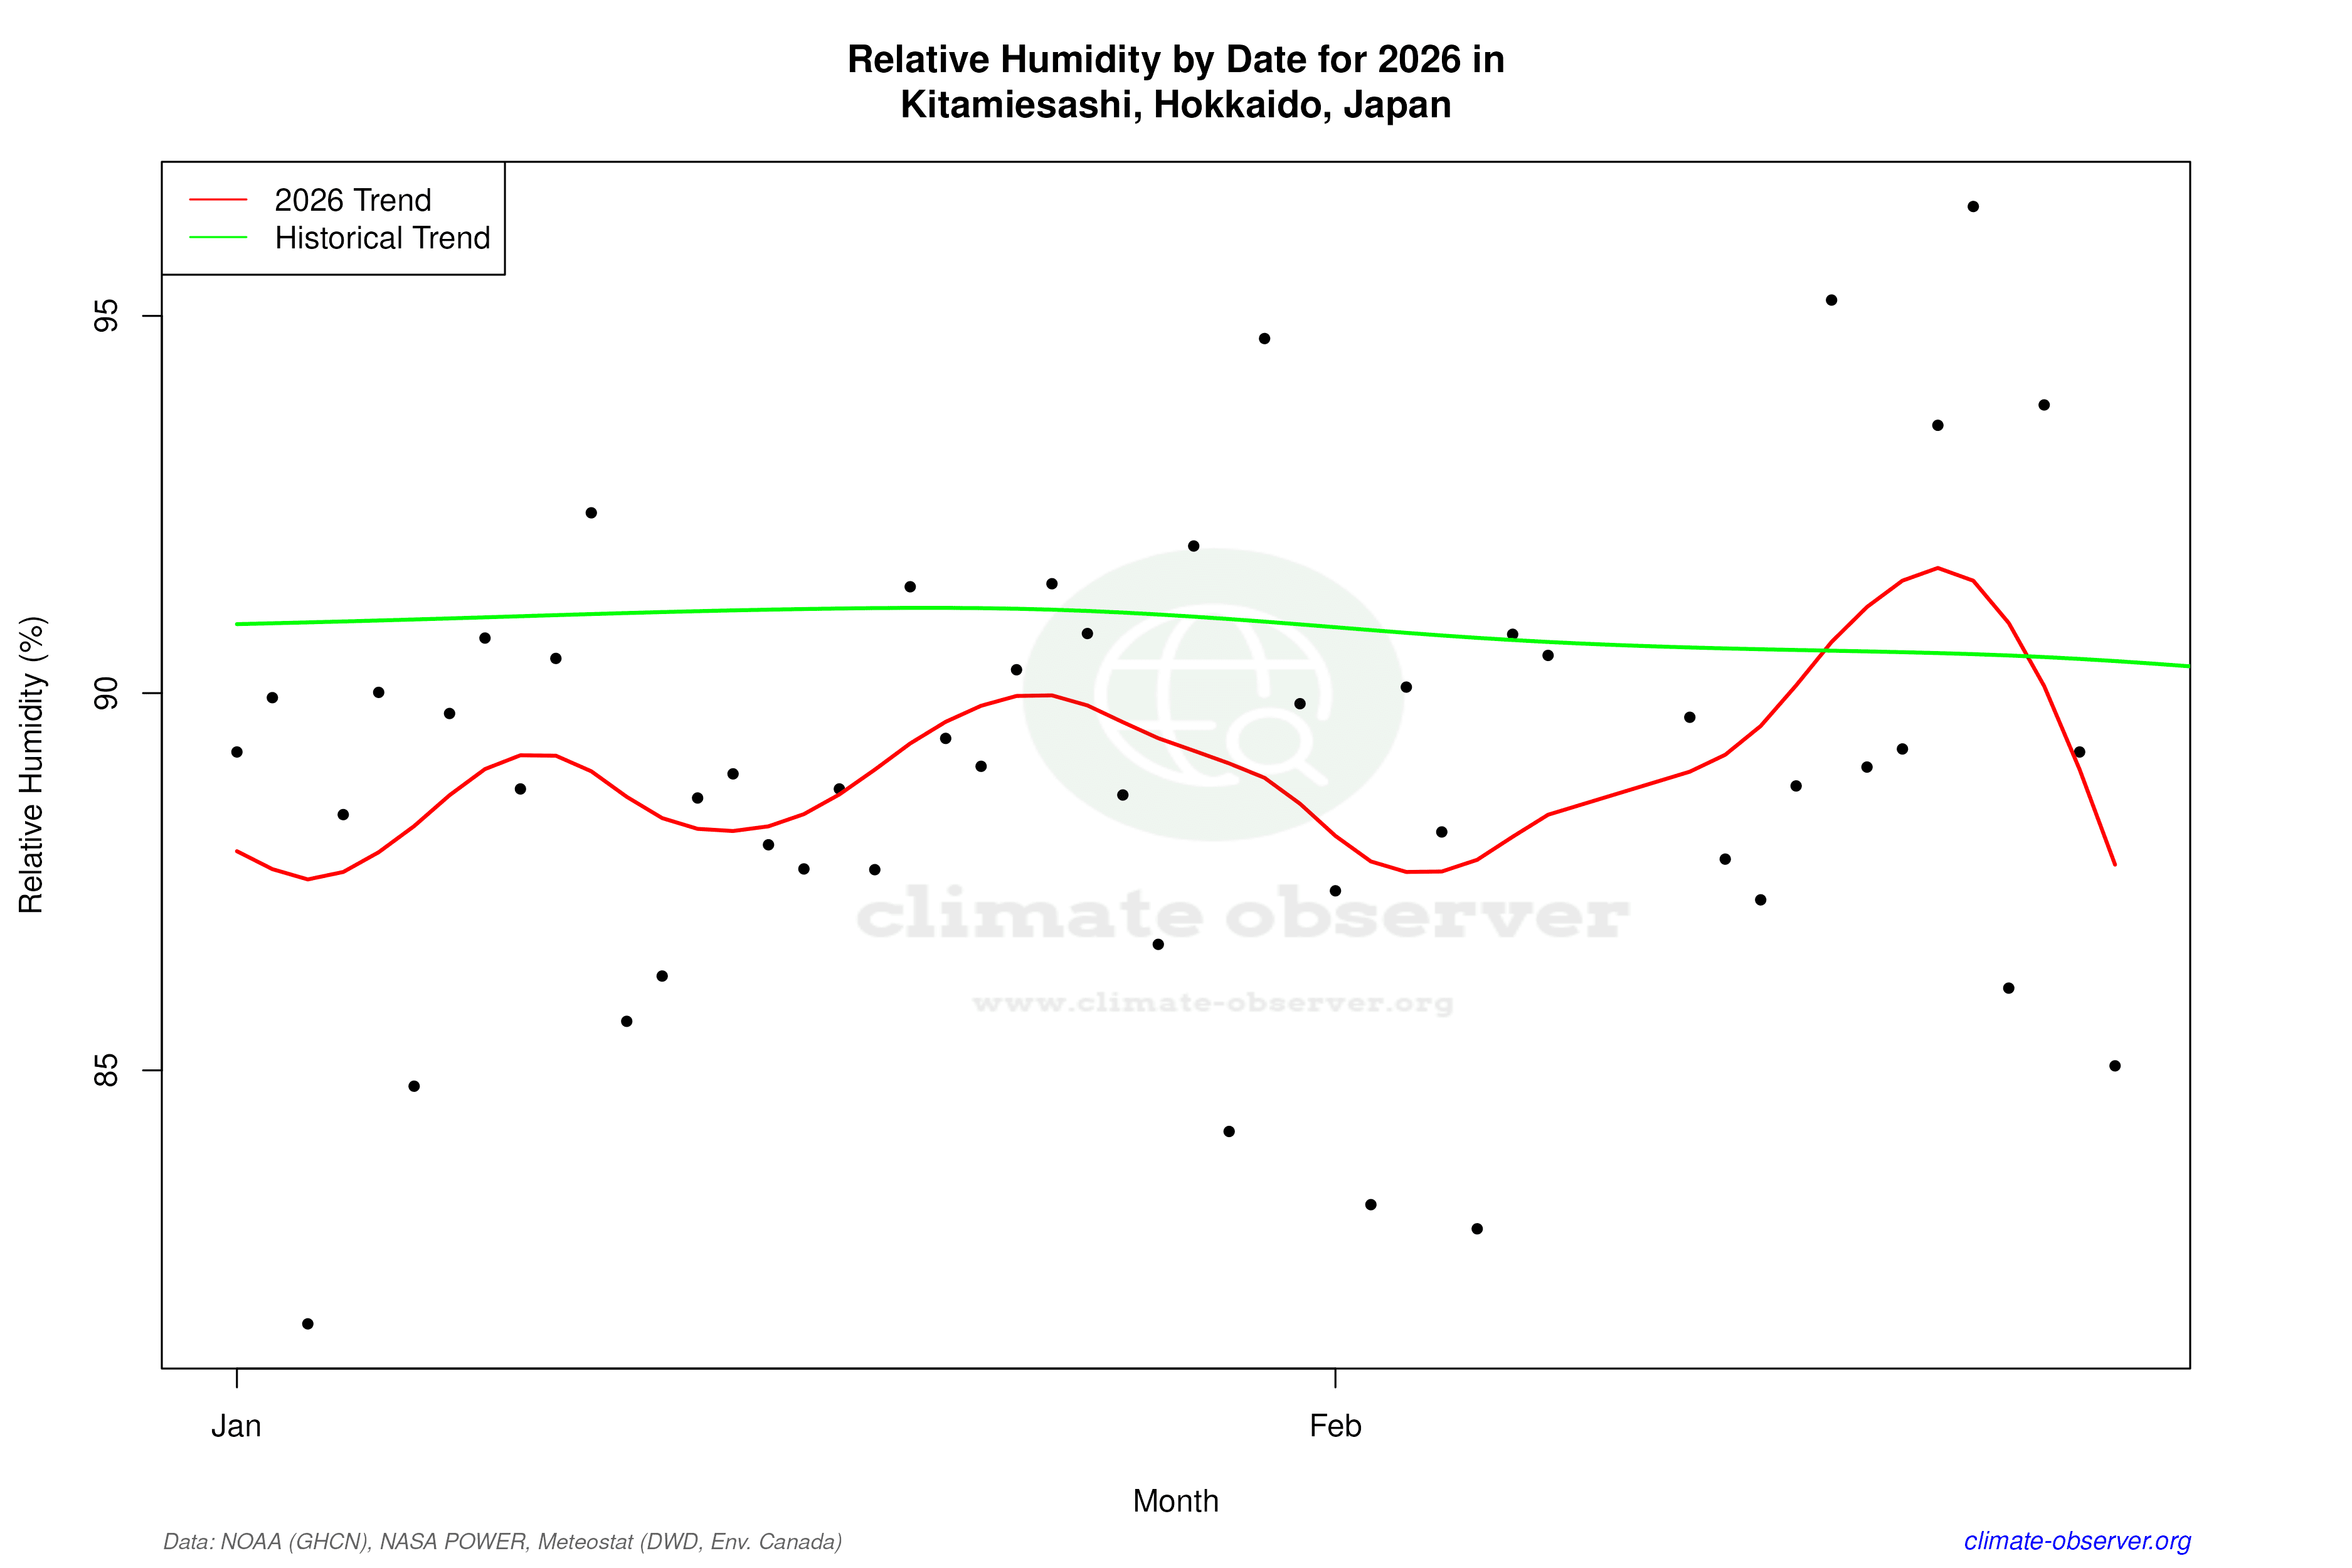

Max Temperature this Year | 1 of 6
Climate 12-Month Moving Averages


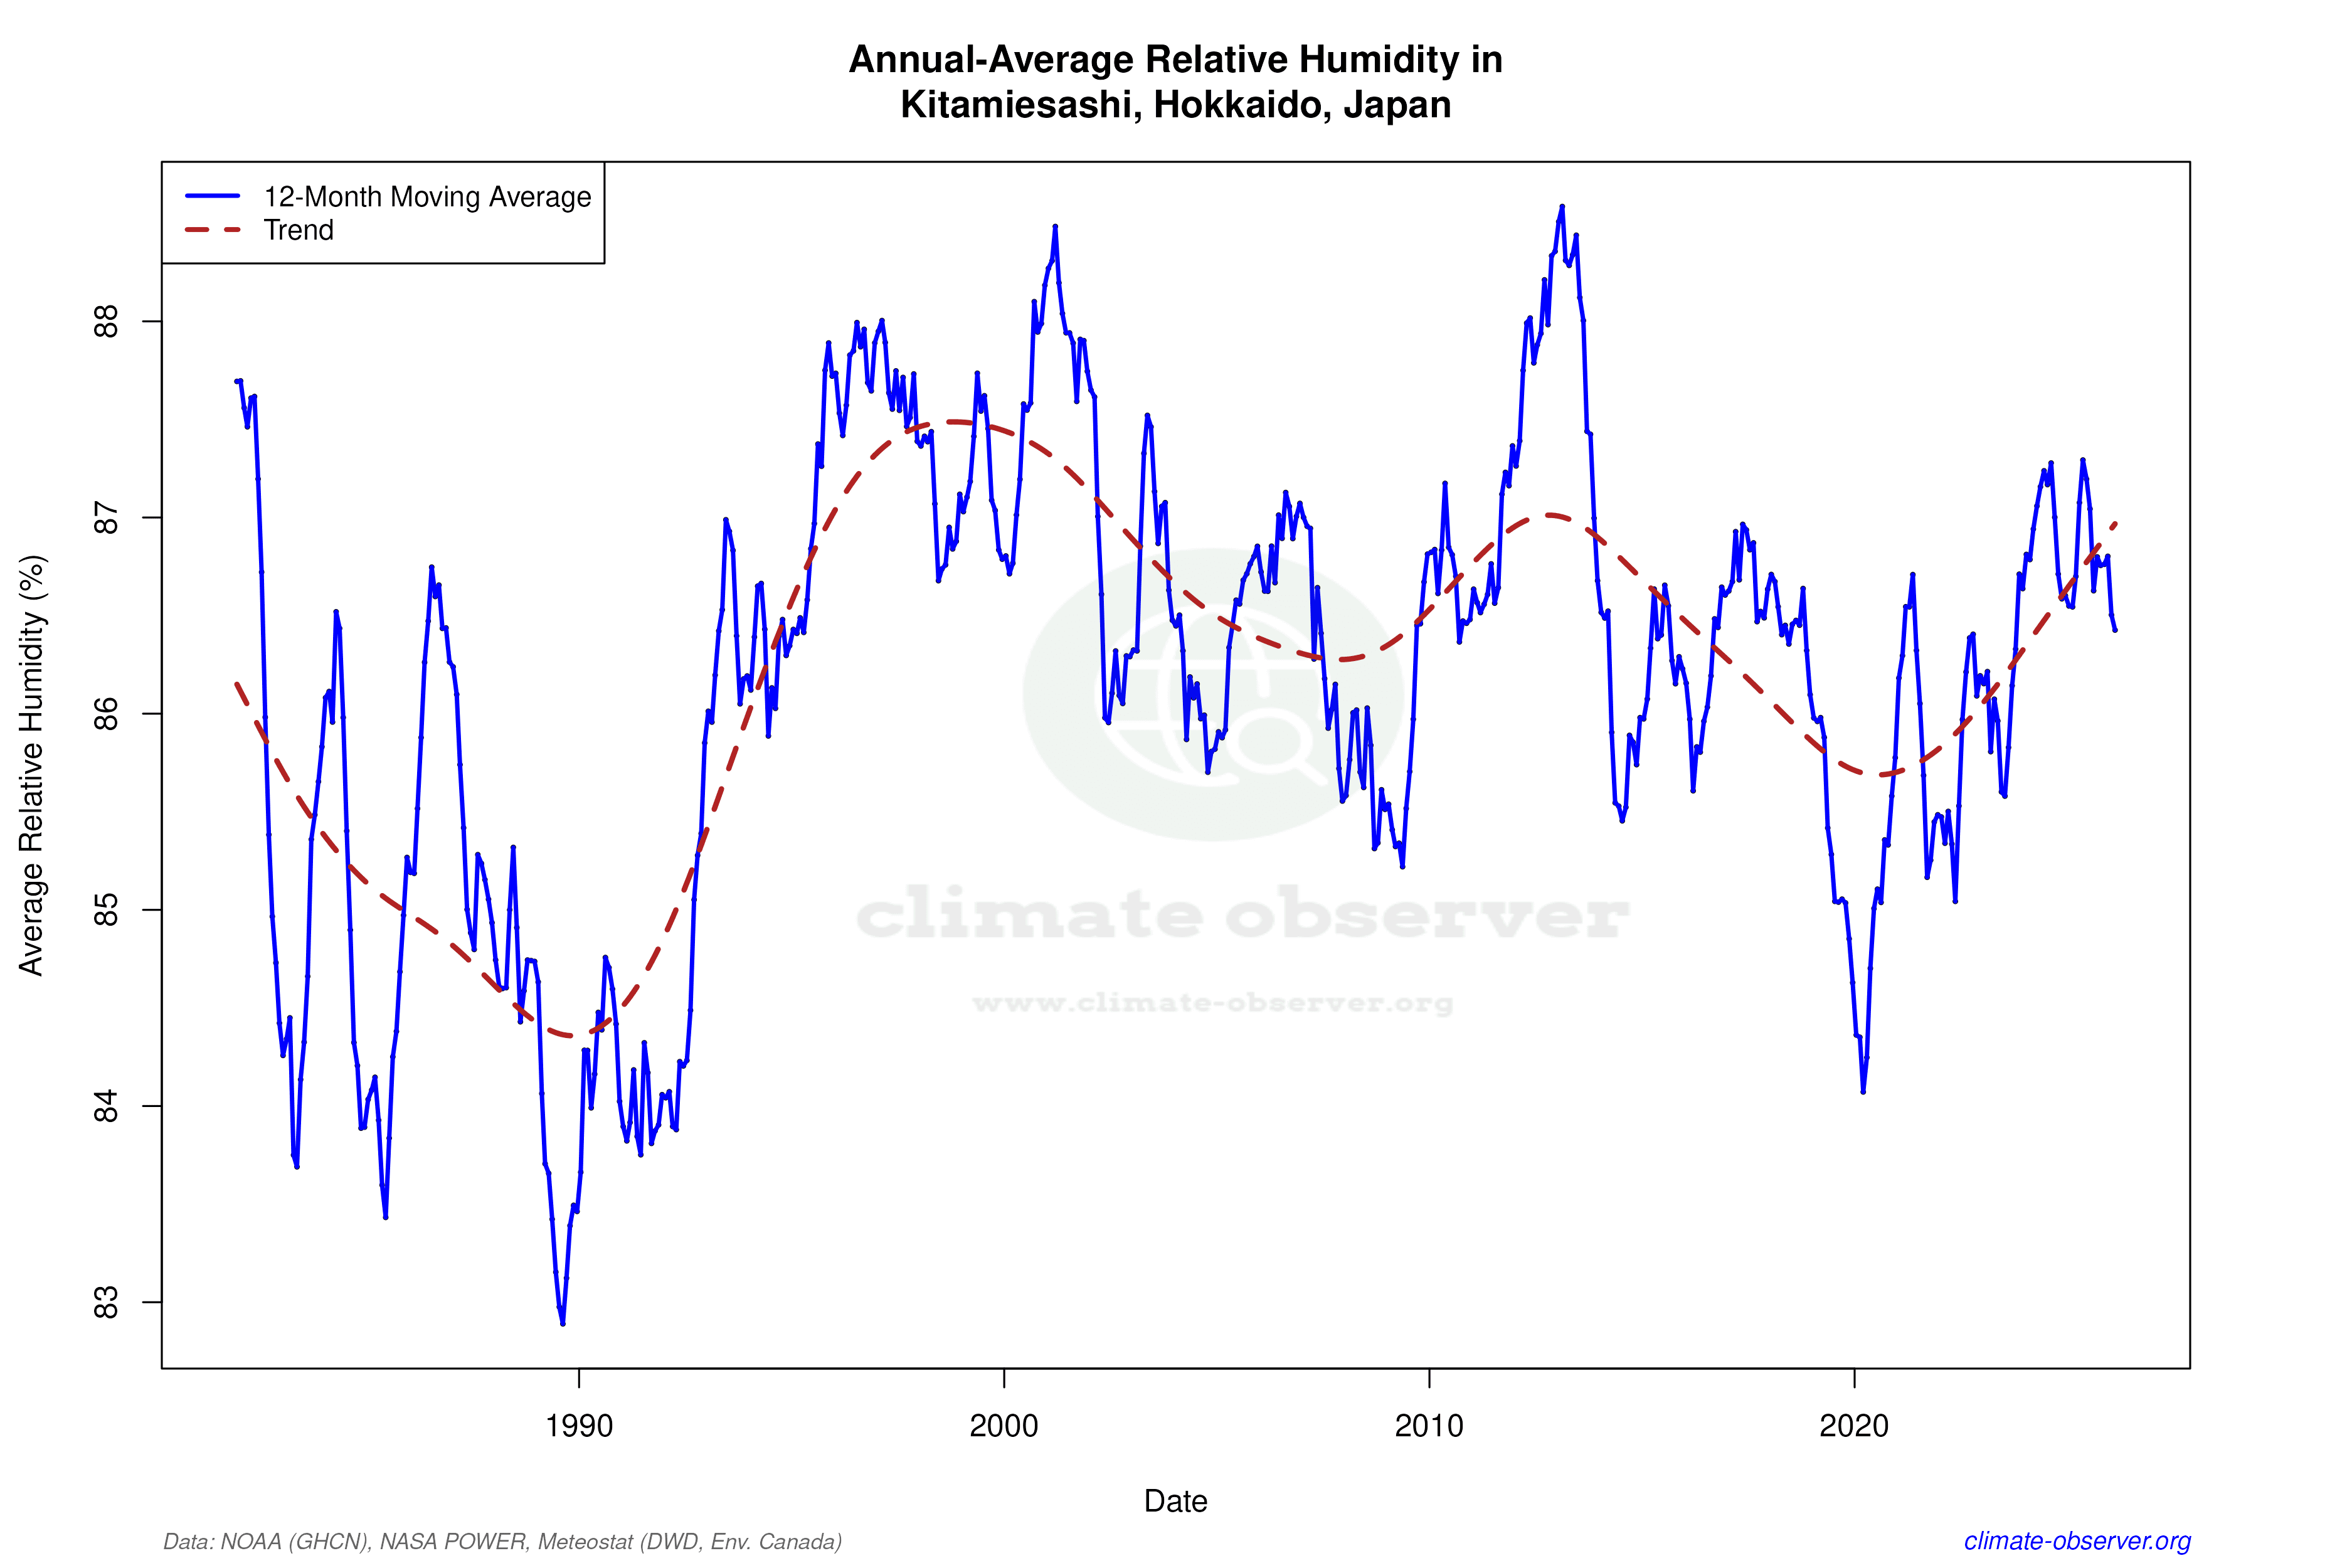

Max Temperature 12-Month MA | 1 of 6
Daily Data Points and Averages Throughout the Year


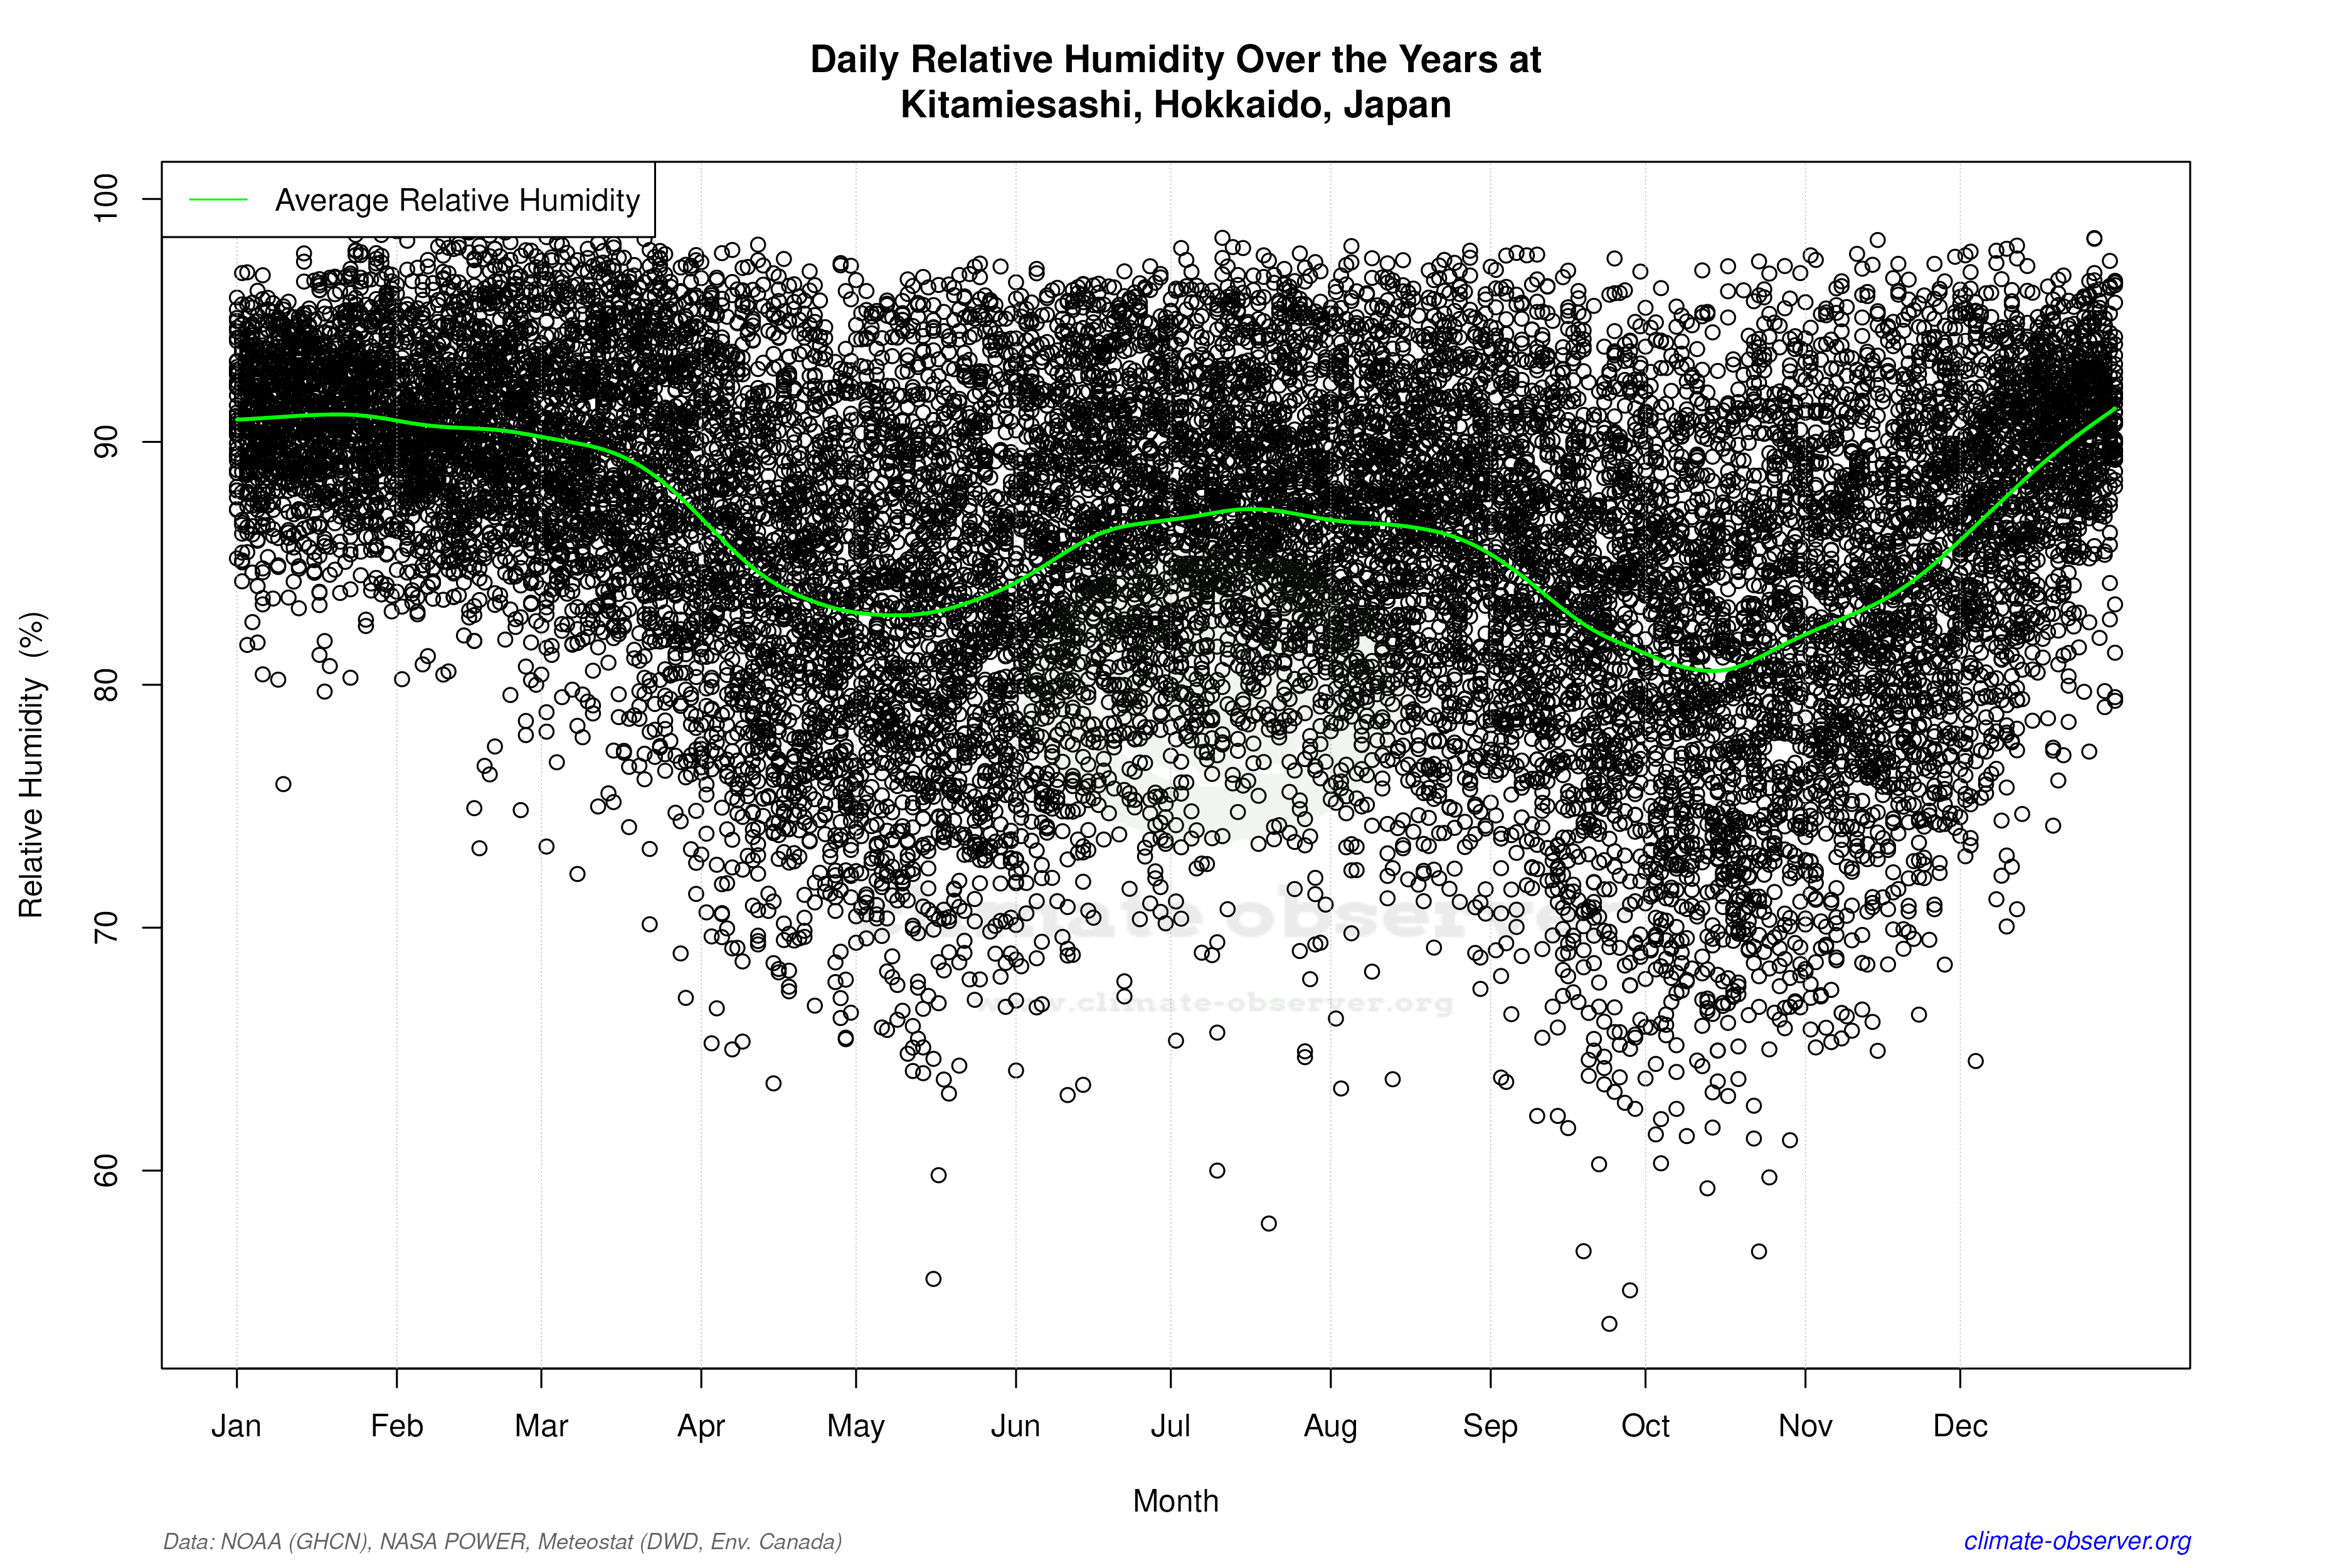

Average Max Temperature Throughout Year | 1 of 5
