Climate for Station: Nemuro, Hokkaido, Japan
Loading live weather...
Climate Analysis & Overview
Nemuro exhibits a warming trend, particularly in low temperatures, with a 2.28°C (4.10°F) rise over the past decade. Precipitation is now more evenly distributed, a shift that may influence local agriculture and water management strategies. The climate here reflects broader regional warming trends, aligning with Japan's climate goals.
Oceanic Influences and Thermal Shifts
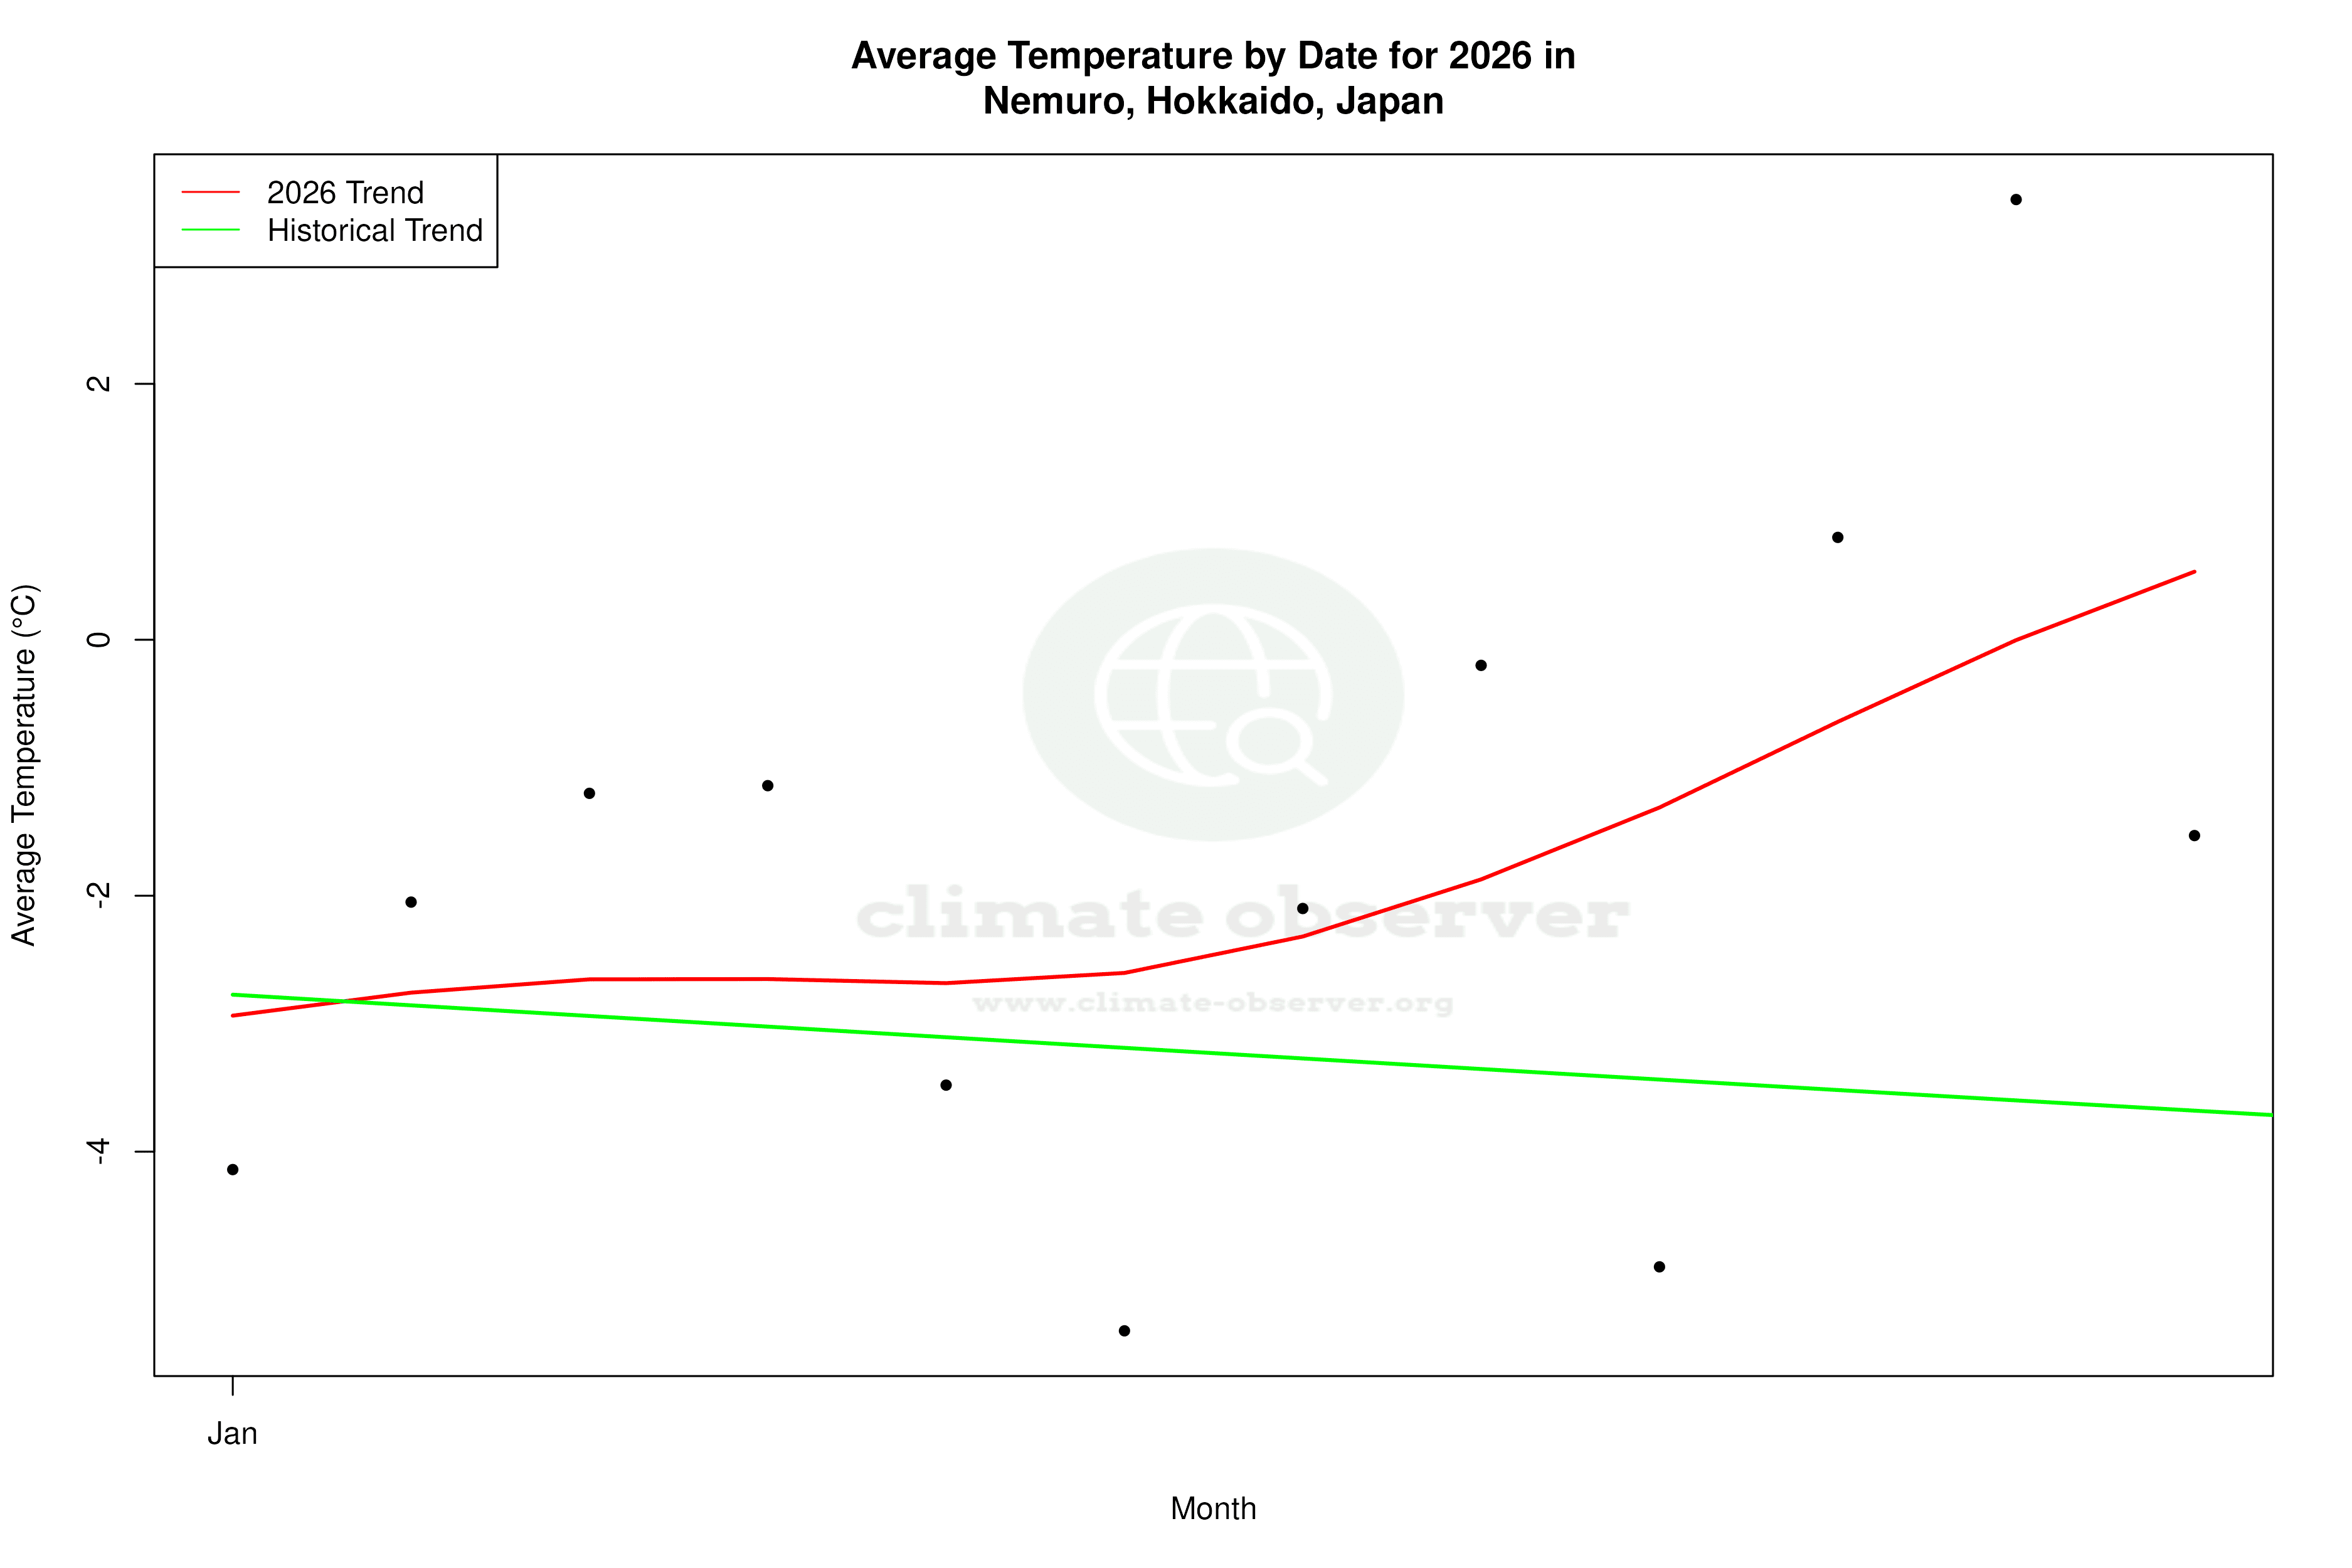
Nemuro, located on the eastern tip of Hokkaido, falls under the Köppen climate classification of Dfb, indicating a humid continental climate with warm summers and no dry season. The proximity to the Pacific Ocean plays a significant role in moderating temperatures and influencing local weather patterns. Over the past decade, Nemuro has experienced a noticeable warming trend, particularly in its low temperatures, which have increased by 2.28°C (4.10°F). High temperatures have also risen by 1.20°C (2.16°F) during the same period. This warming trend is more pronounced than the all-time trend, which shows a more modest increase of 0.07°C (0.13°F) for highs and 0.28°C (0.50°F) for lows. These changes suggest a shift towards milder winters, which could impact local ecosystems and human activities.
Precipitation Patterns: A New Equilibrium
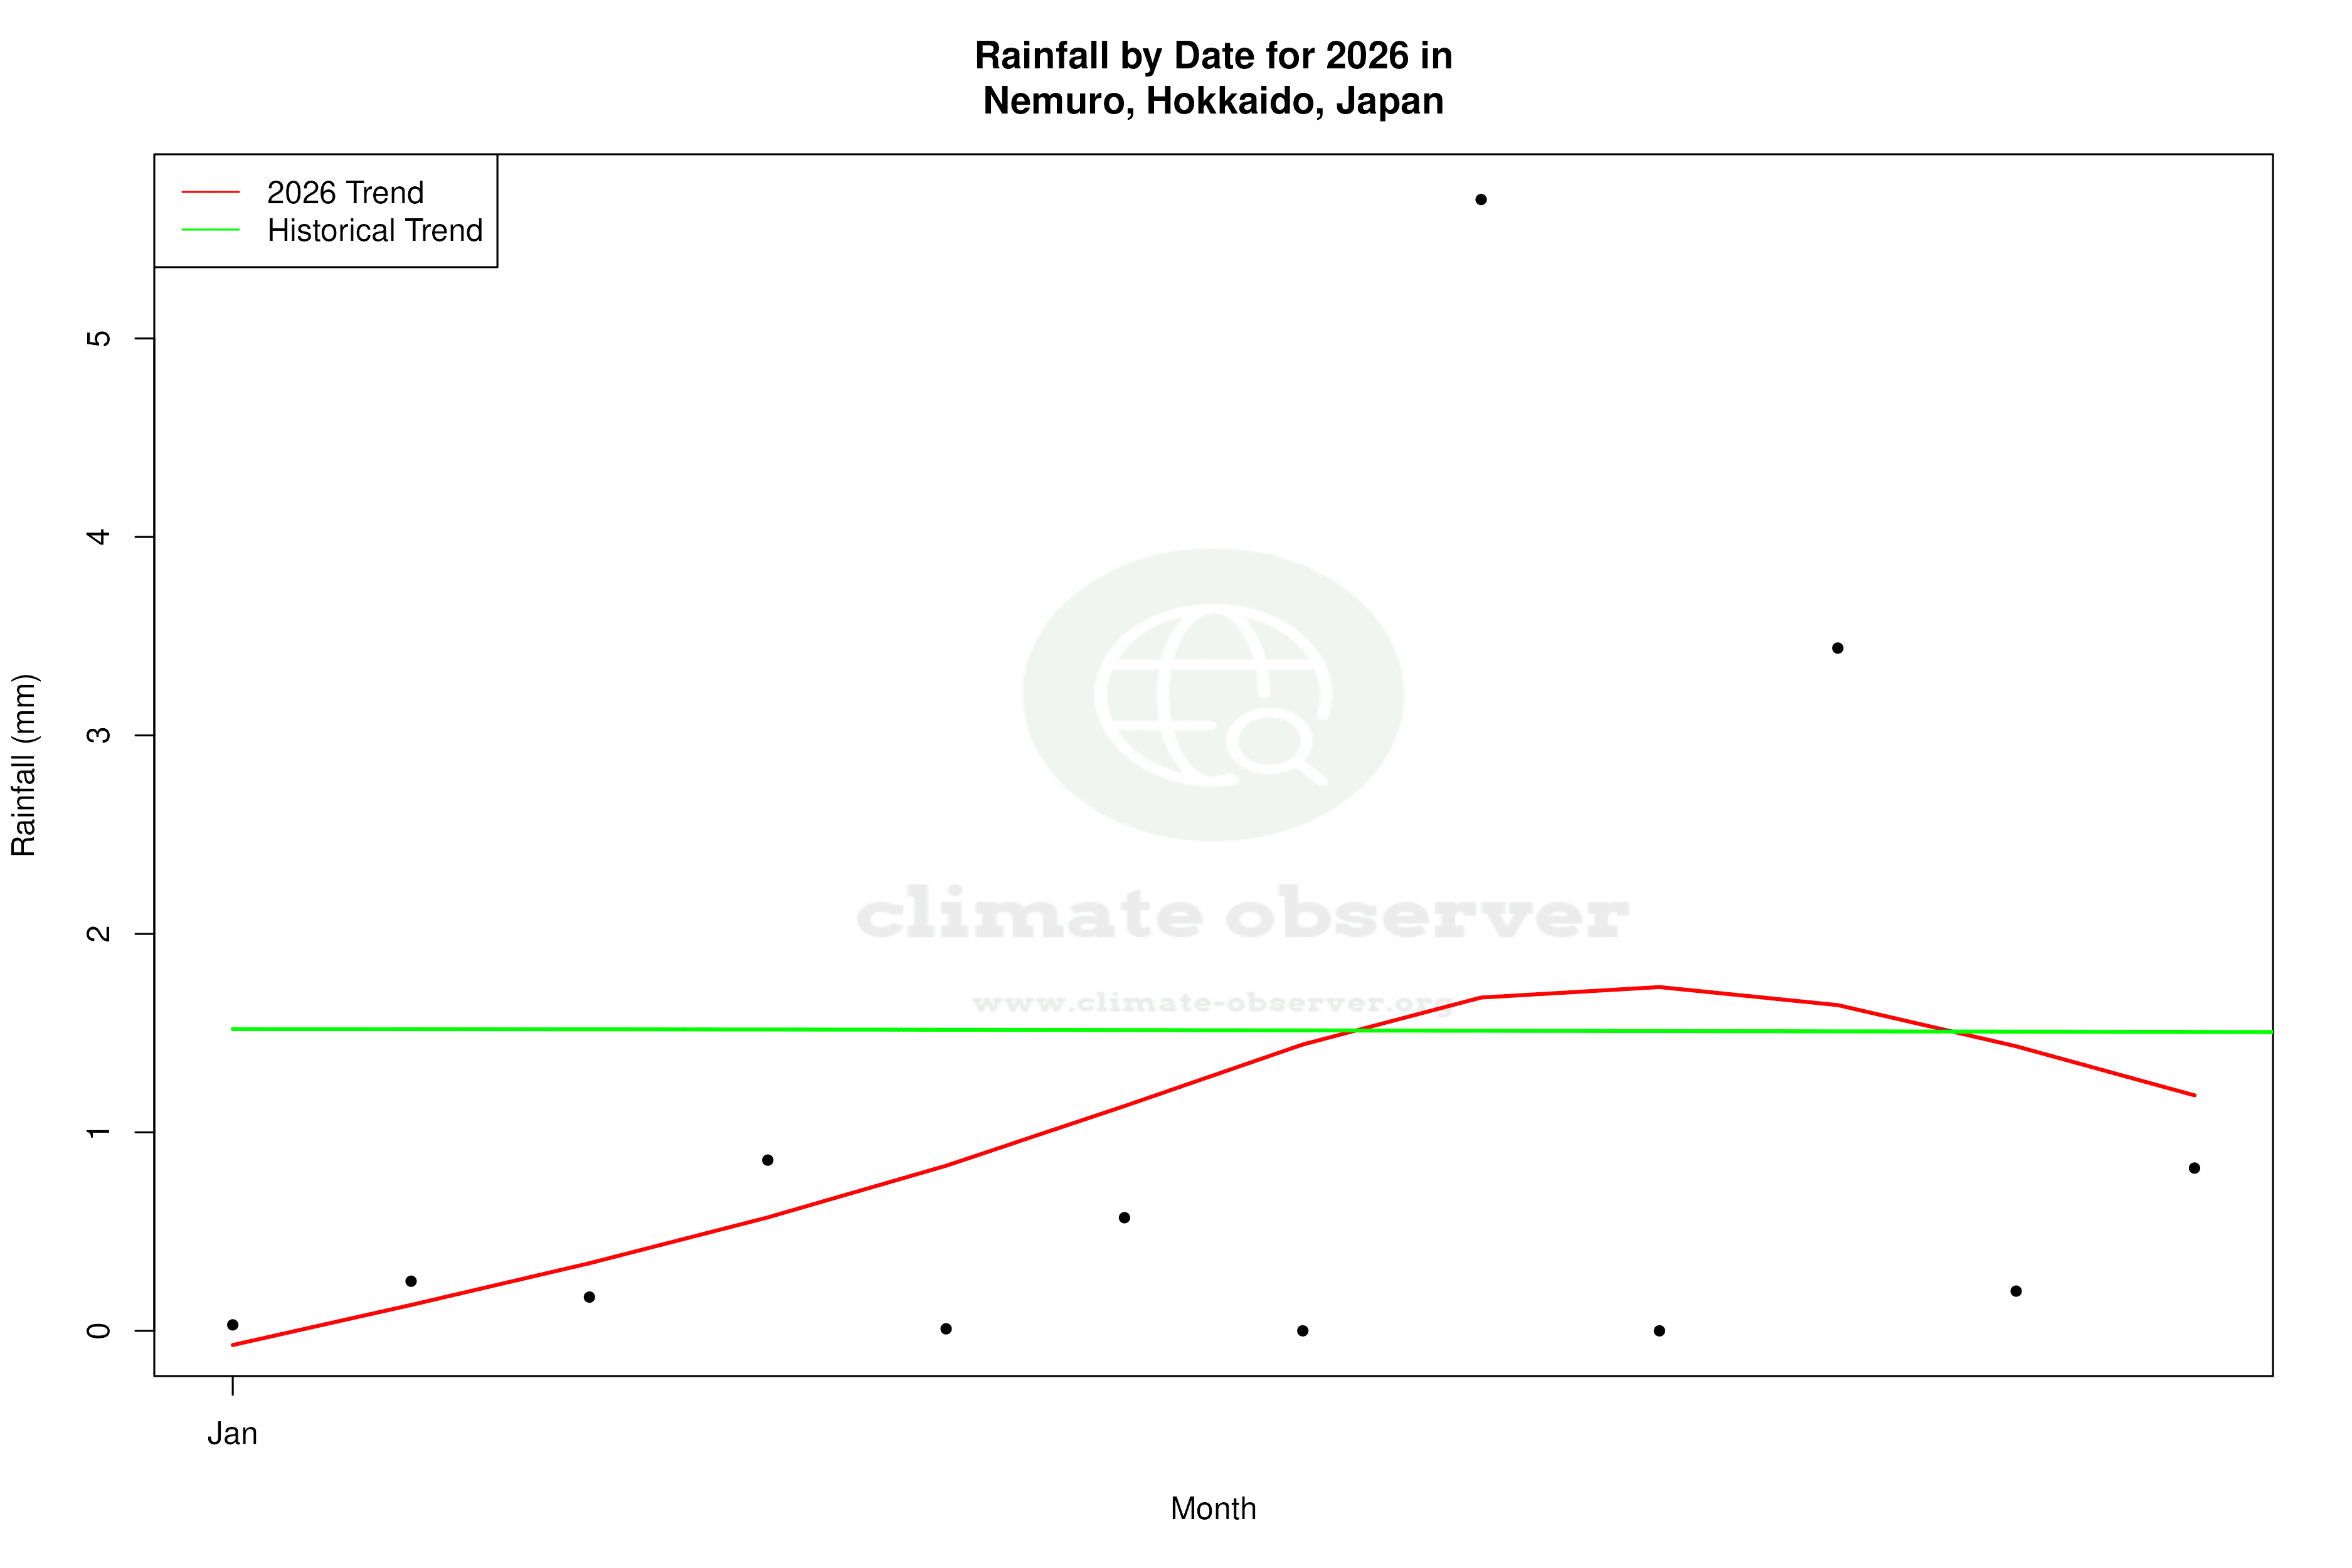
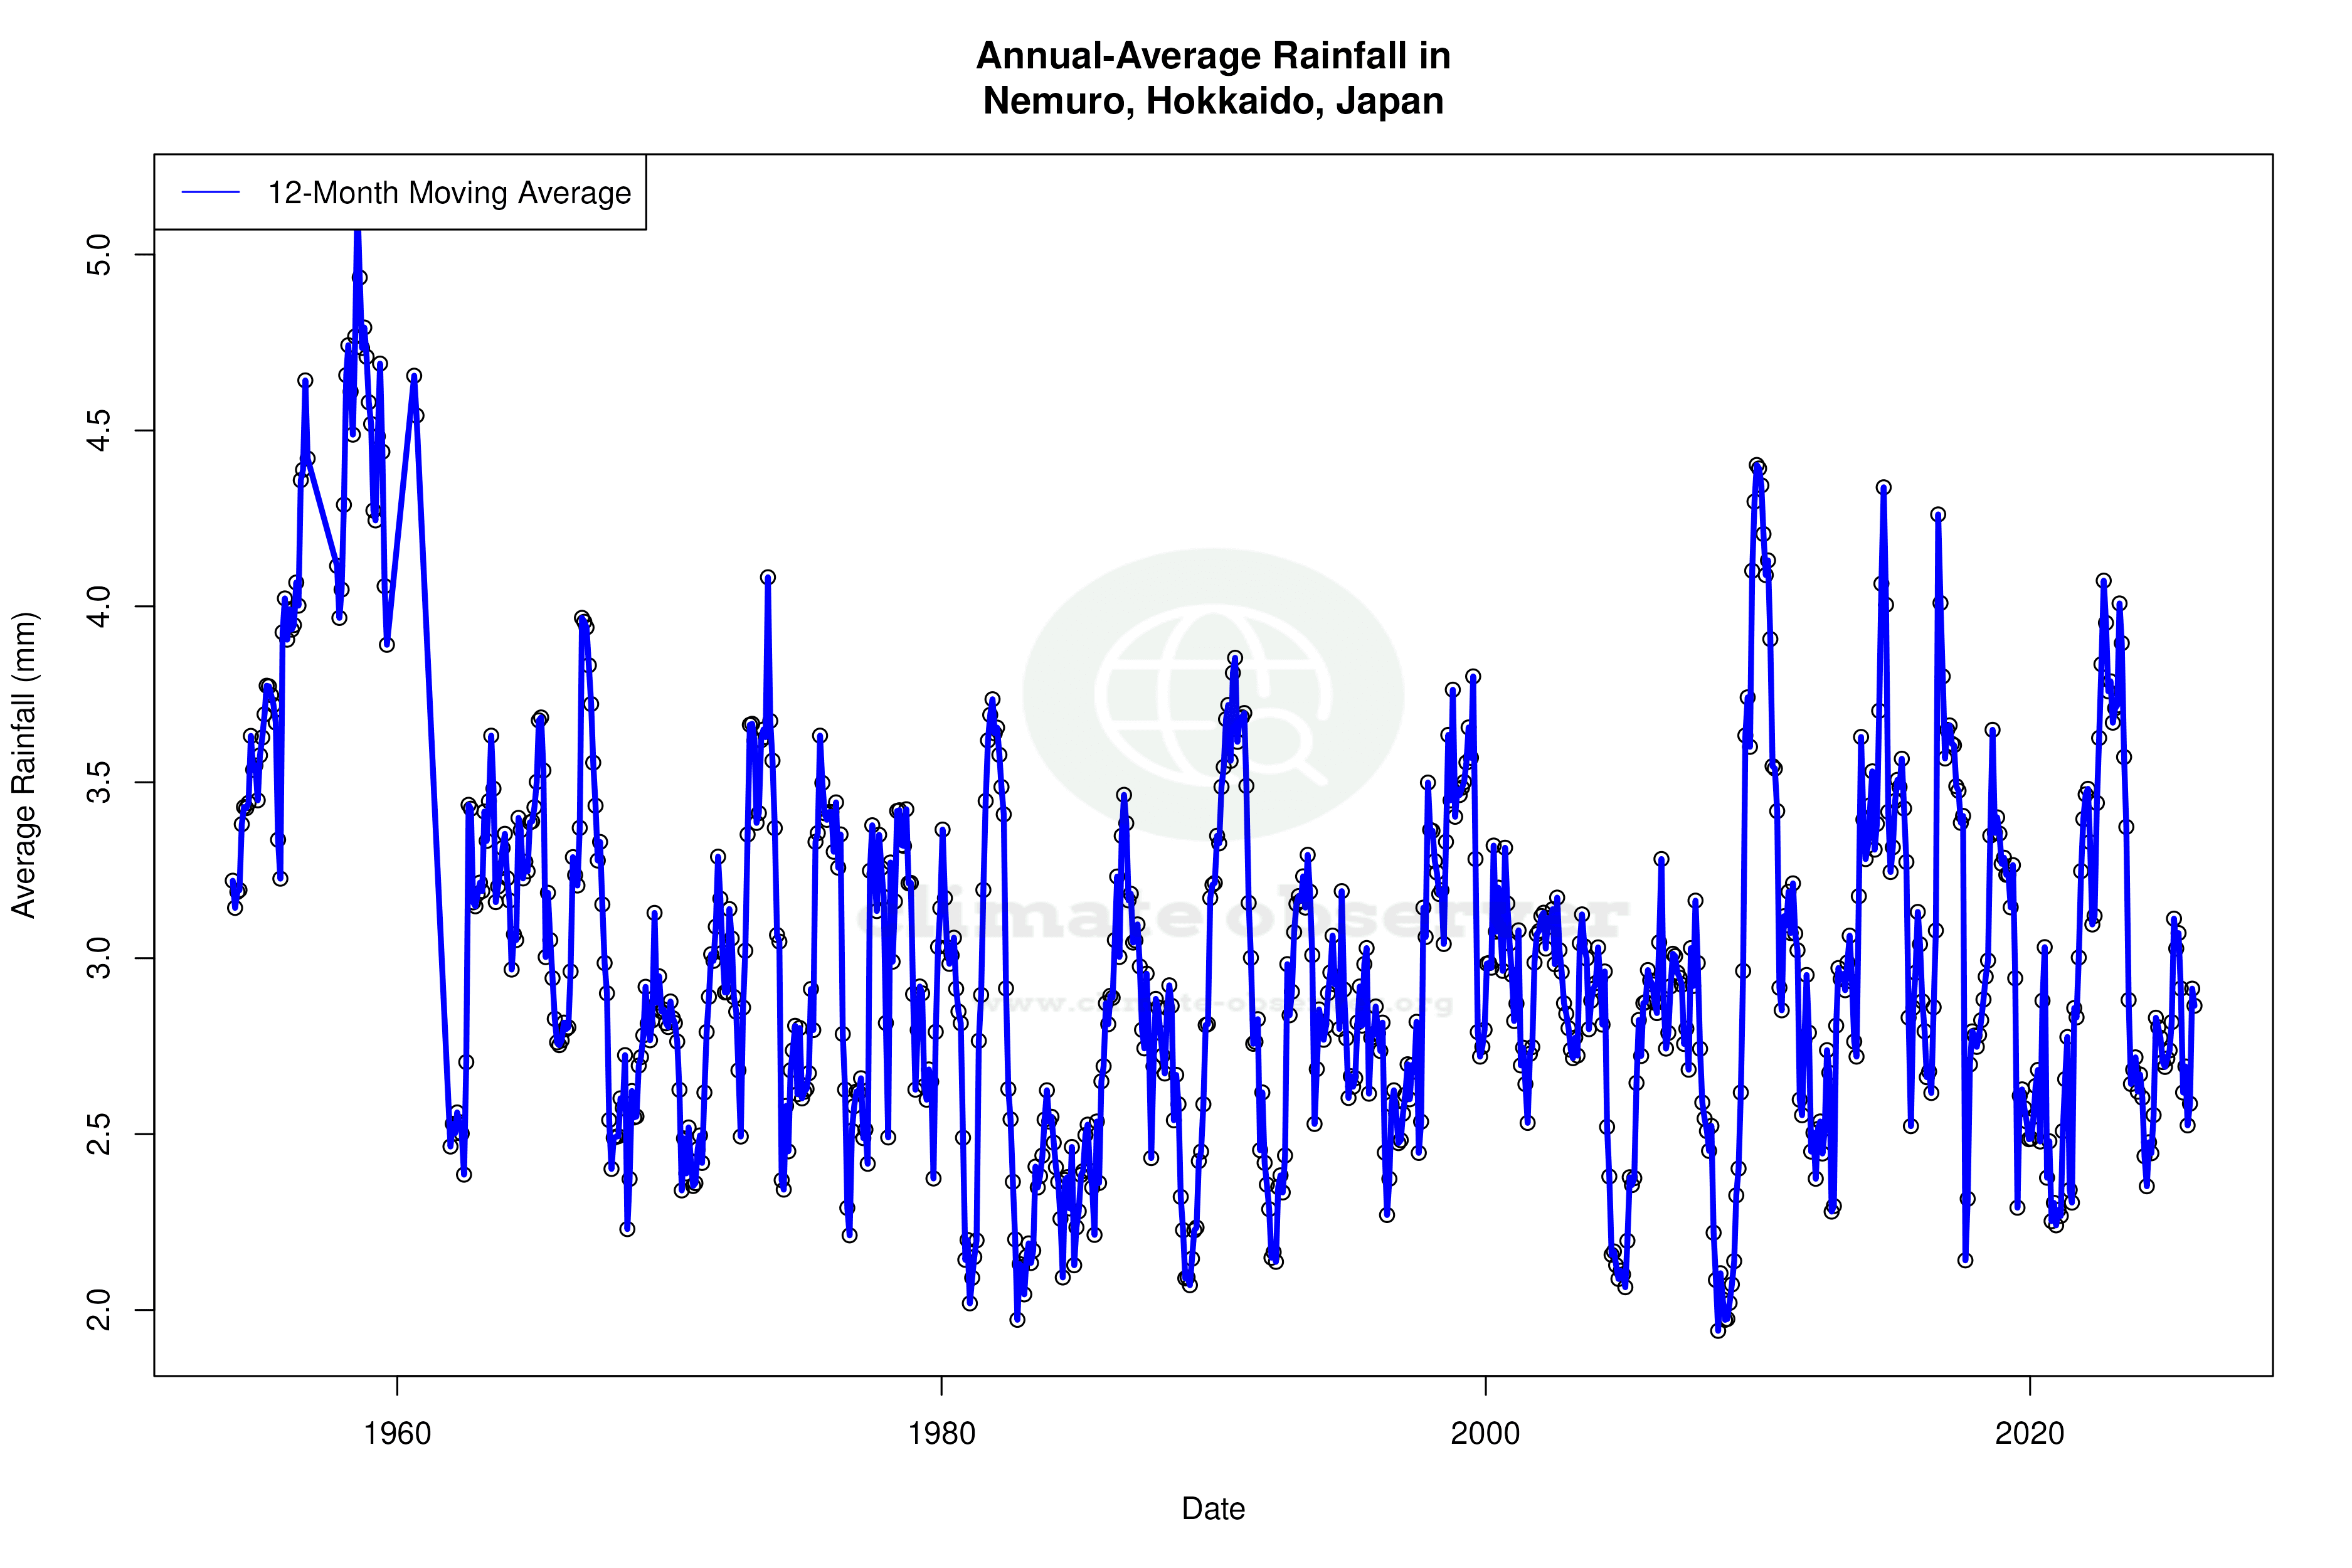
The Precipitation Concentration Index (PCI) for Nemuro has decreased from a baseline of 11.70 to a current value of 9.68, indicating a more even distribution of rainfall throughout the year. This shift suggests that precipitation events are becoming less concentrated, potentially reducing the risk of flooding and benefiting agricultural practices by providing a more consistent water supply. Such changes align with regional climate adaptation strategies, which aim to mitigate the impacts of extreme weather events.
Temperature Extremes: A Historical Perspective
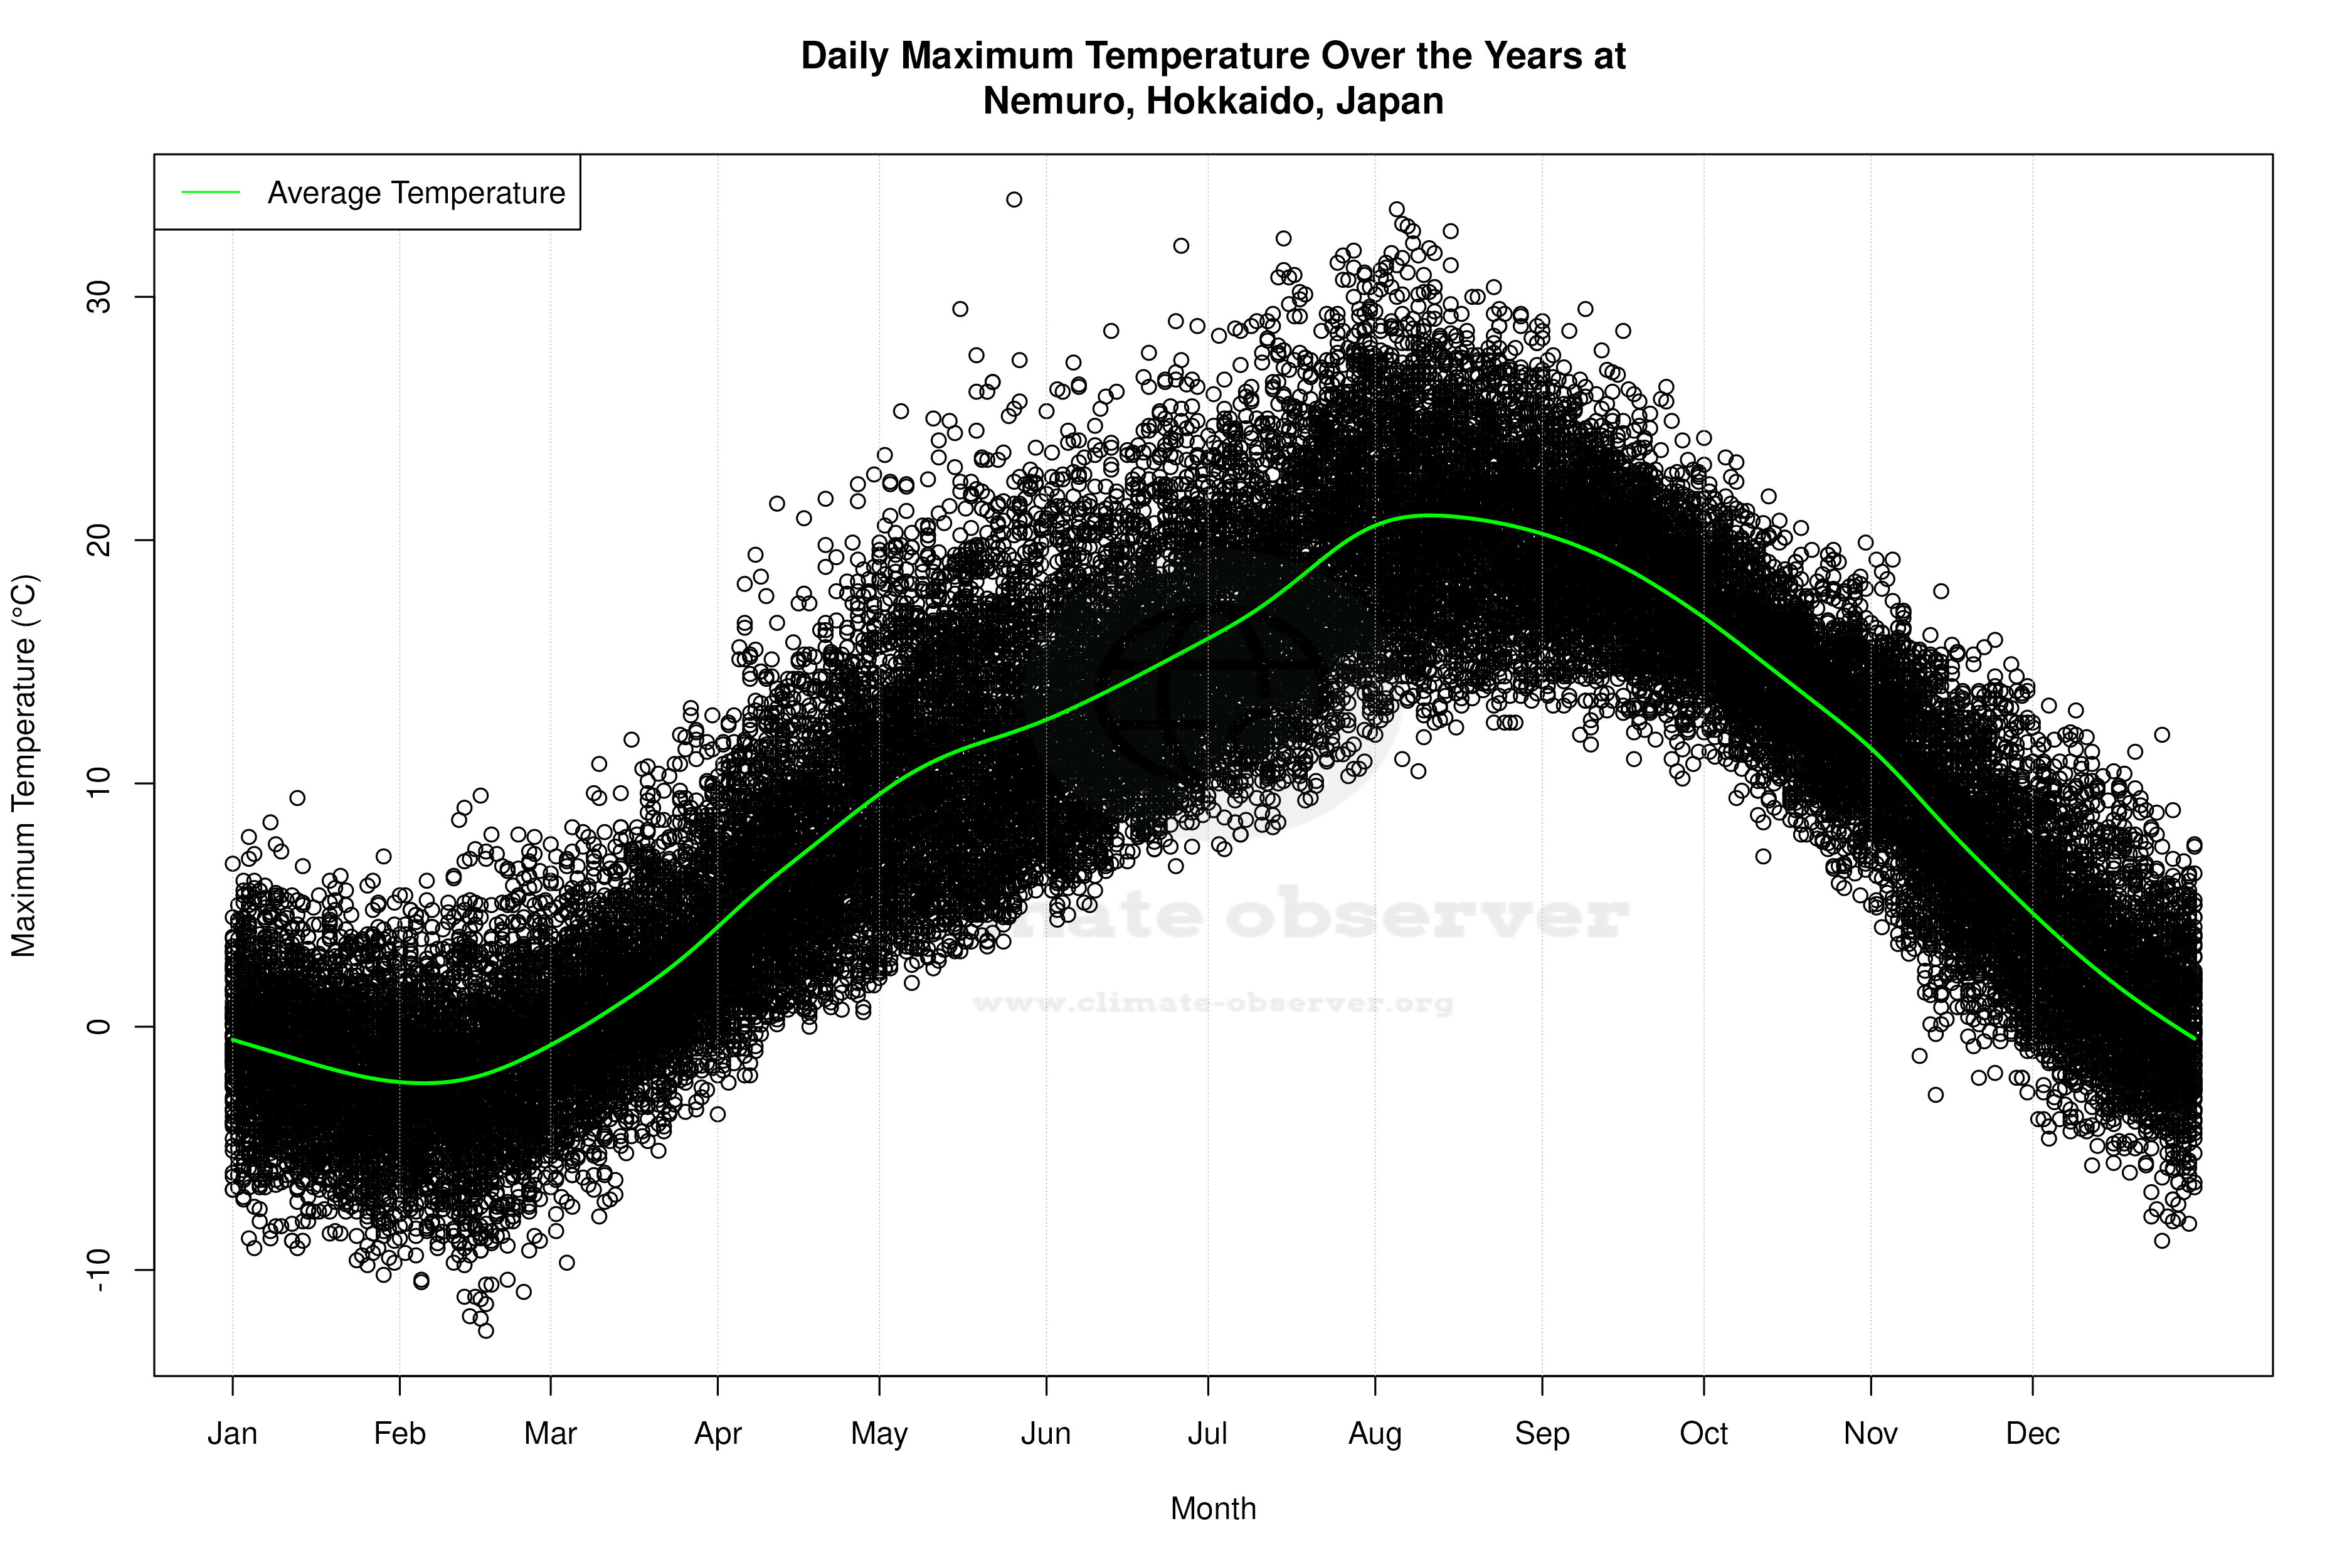
Nemuro's historical temperature records reveal a maximum of 34.0°C (93.2°F) and a minimum of -22.9°C (-9.2°F). These extremes highlight the region's susceptibility to significant temperature fluctuations, a characteristic feature of its humid continental climate. While the all-time trends indicate a gradual warming, the recent decade's sharper increase in low temperatures could signal a shift in the region's thermal dynamics, possibly linked to broader climatic changes observed across Japan.
Regional Climate Goals and Local Implications
Japan's commitment to reducing greenhouse gas emissions and enhancing climate resilience is reflected in the observed trends in Nemuro. The warming of low temperatures and the more even distribution of precipitation align with national efforts to adapt to and mitigate climate change impacts. These changes may influence local policy decisions, particularly in sectors such as agriculture, water management, and infrastructure development. As Nemuro continues to experience these climatic shifts, understanding their implications will be crucial for sustainable regional planning and development.
Station Statistics
10-Year Trend
High: +1.47 °C/decade
Low: +2.43 °C/decade
Rain: -0.47 mm/decade
25-Year Trend
High: +0.50 °C/decade
Low: +0.70 °C/decade
Rain: +0.06 mm/decade
50-Year Trend
High: +0.17 °C/decade
Low: +0.54 °C/decade
Rain: +0.07 mm/decade
All-Time Trend
High: +0.07 °C/decade
Low: +0.29 °C/decade
Rain: -0.07 mm/decade
Percentage Above-Average Days
Last 12 Months: 48.8%
This Year: 32.1%
Precipitation Concentration Index (PCI) ℹ️
Last 12 Months: 10.0
Historical Average: 12.2
Percentile Rank of Last 12 Months ℹ️
High: 99th percentile
Low: 99th percentile
Rain: 26th percentile
Change in Variance ℹ️
High: +1.1%
Low: -1.0%
Intraday: -5.5%
Data Coverage
85.1%
First Year of Data
1931
Station Location
Historical Weather Records
| Max High | Avg High | Min High | Max Avg | Avg Avg | Min Avg | Max Low | Avg Low | Min Low | Max Precipitation | Avg Precipitation | Max Snow | Avg Snow | |
|---|---|---|---|---|---|---|---|---|---|---|---|---|---|
| Record | 34.0 °C | — | -12.5 °C | 27.7 °C | — | -16.6 °C | 24.3 °C | — | -22.9 °C | 148.0 mm | — | — | — |
| January | 9.4 °C | -1.5 °C | -10.2 °C | 4.6 °C | -3.9 °C | -13.2 °C | 1.7 °C | -7.4 °C | -19.4 °C | 45.0 mm | 1.5 mm | — | — |
| February | 9.5 °C | -1.9 °C | -12.5 °C | 6.8 °C | -4.3 °C | -16.6 °C | 1.3 °C | -8.3 °C | -22.9 °C | 78.0 mm | 1.3 mm | — | — |
| March | 13.1 °C | 1.4 °C | -9.7 °C | 9.5 °C | -1.1 °C | -13.8 °C | 5.2 °C | -4.5 °C | -19.0 °C | 59.0 mm | 2.1 mm | — | — |
| April | 22.7 °C | 6.9 °C | -3.6 °C | 15.5 °C | 3.6 °C | -4.0 °C | 8.4 °C | 0.2 °C | -9.9 °C | 76.0 mm | 2.7 mm | — | — |
| May | 34.0 °C | 11.3 °C | 1.8 °C | 21.5 °C | 7.7 °C | 0.6 °C | 12.2 °C | 4.1 °C | -3.3 °C | 89.0 mm | 3.4 mm | — | — |
| June | 32.1 °C | 14.2 °C | 4.4 °C | 22.7 °C | 10.8 °C | 3.3 °C | 16.4 °C | 7.7 °C | 0.6 °C | 112.0 mm | 3.5 mm | — | — |
| July | 33.4 °C | 18.2 °C | 7.3 °C | 27.7 °C | 14.9 °C | 6.7 °C | 22.9 °C | 11.9 °C | 3.6 °C | 108.0 mm | 3.5 mm | — | — |
| August | 33.6 °C | 20.8 °C | 10.5 °C | 26.7 °C | 17.4 °C | 10.2 °C | 24.3 °C | 14.9 °C | 7.1 °C | 137.0 mm | 4.2 mm | — | — |
| September | 29.5 °C | 18.8 °C | 10.2 °C | 24.4 °C | 16.0 °C | 8.9 °C | 21.9 °C | 13.2 °C | 3.2 °C | 148.0 mm | 5.1 mm | — | — |
| October | 24.2 °C | 14.3 °C | 5.4 °C | 19.6 °C | 11.3 °C | 2.8 °C | 17.4 °C | 8.1 °C | -2.0 °C | 144.0 mm | 4.2 mm | — | — |
| November | 19.2 °C | 8.2 °C | -2.8 °C | 15.7 °C | 5.3 °C | -4.6 °C | 12.5 °C | 1.9 °C | -8.3 °C | 73.0 mm | 2.8 mm | — | — |
| December | 13.2 °C | 1.9 °C | -8.8 °C | 10.0 °C | -0.5 °C | -10.0 °C | 7.1 °C | -3.9 °C | -15.1 °C | 73.0 mm | 2.0 mm | — | — |
Data Visualisations
Remove WatermarksCurrent Year Climate Trends vs Historical
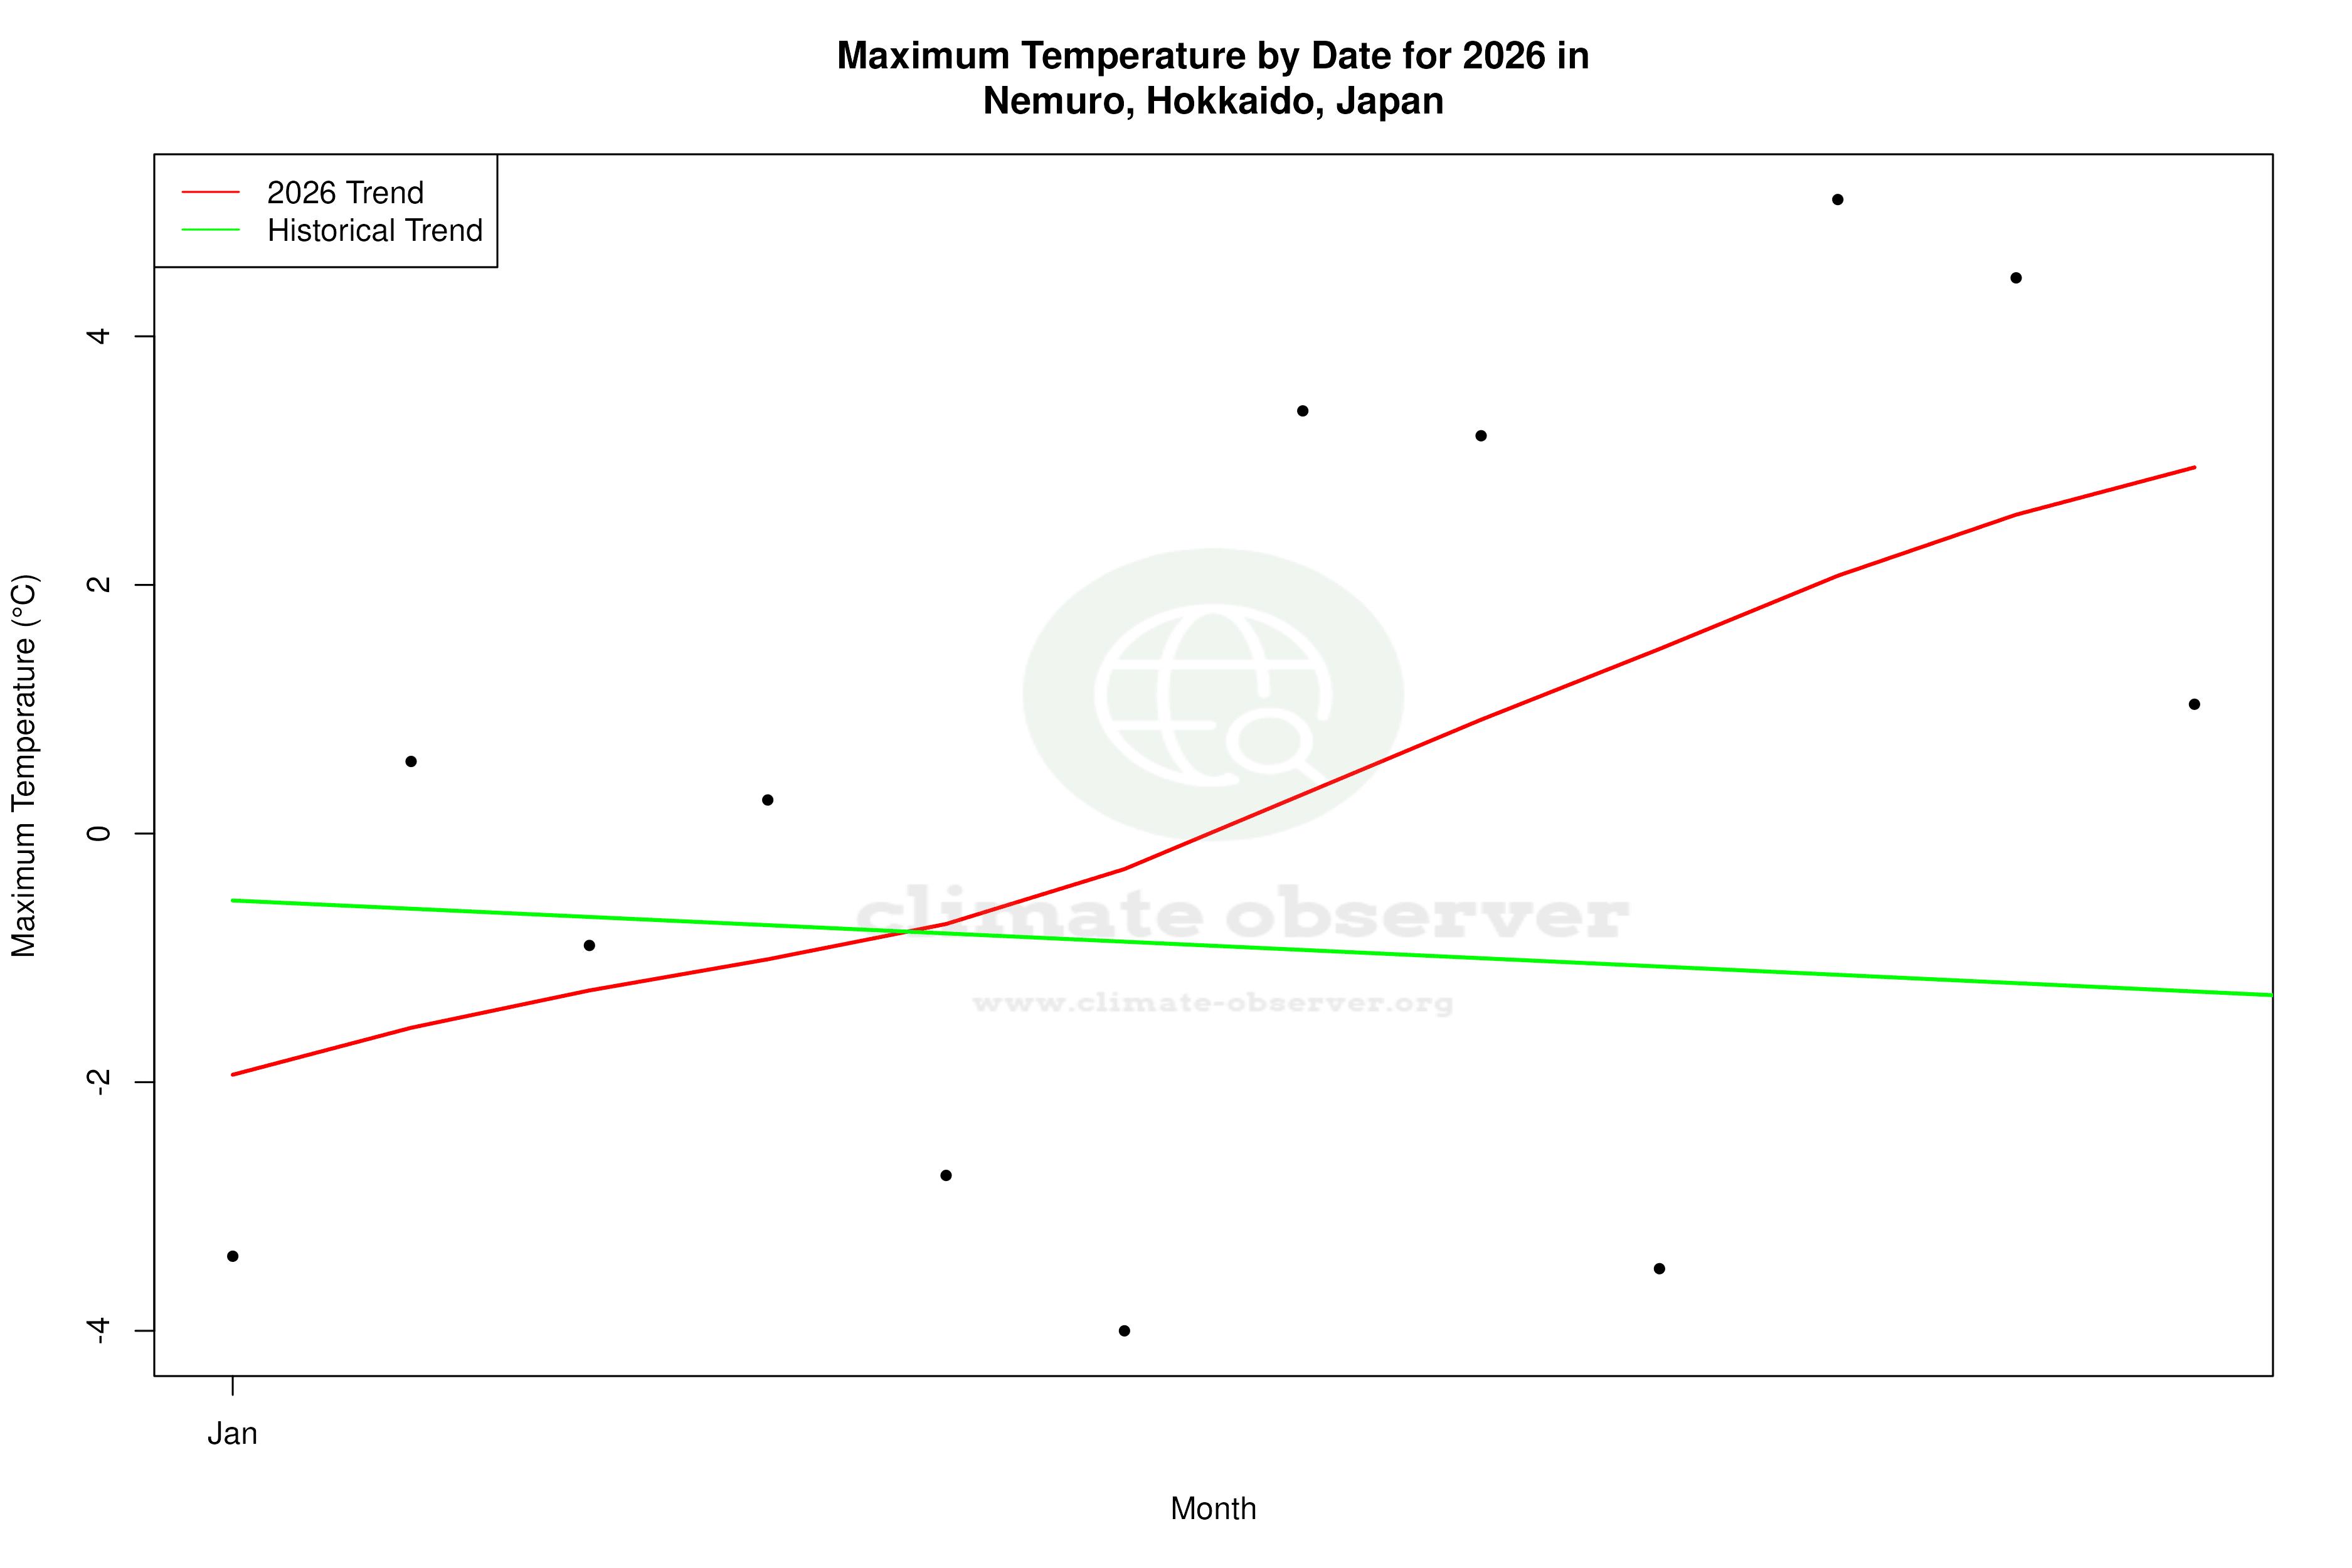


Max Temperature this Year | 1 of 6
Climate 12-Month Moving Averages
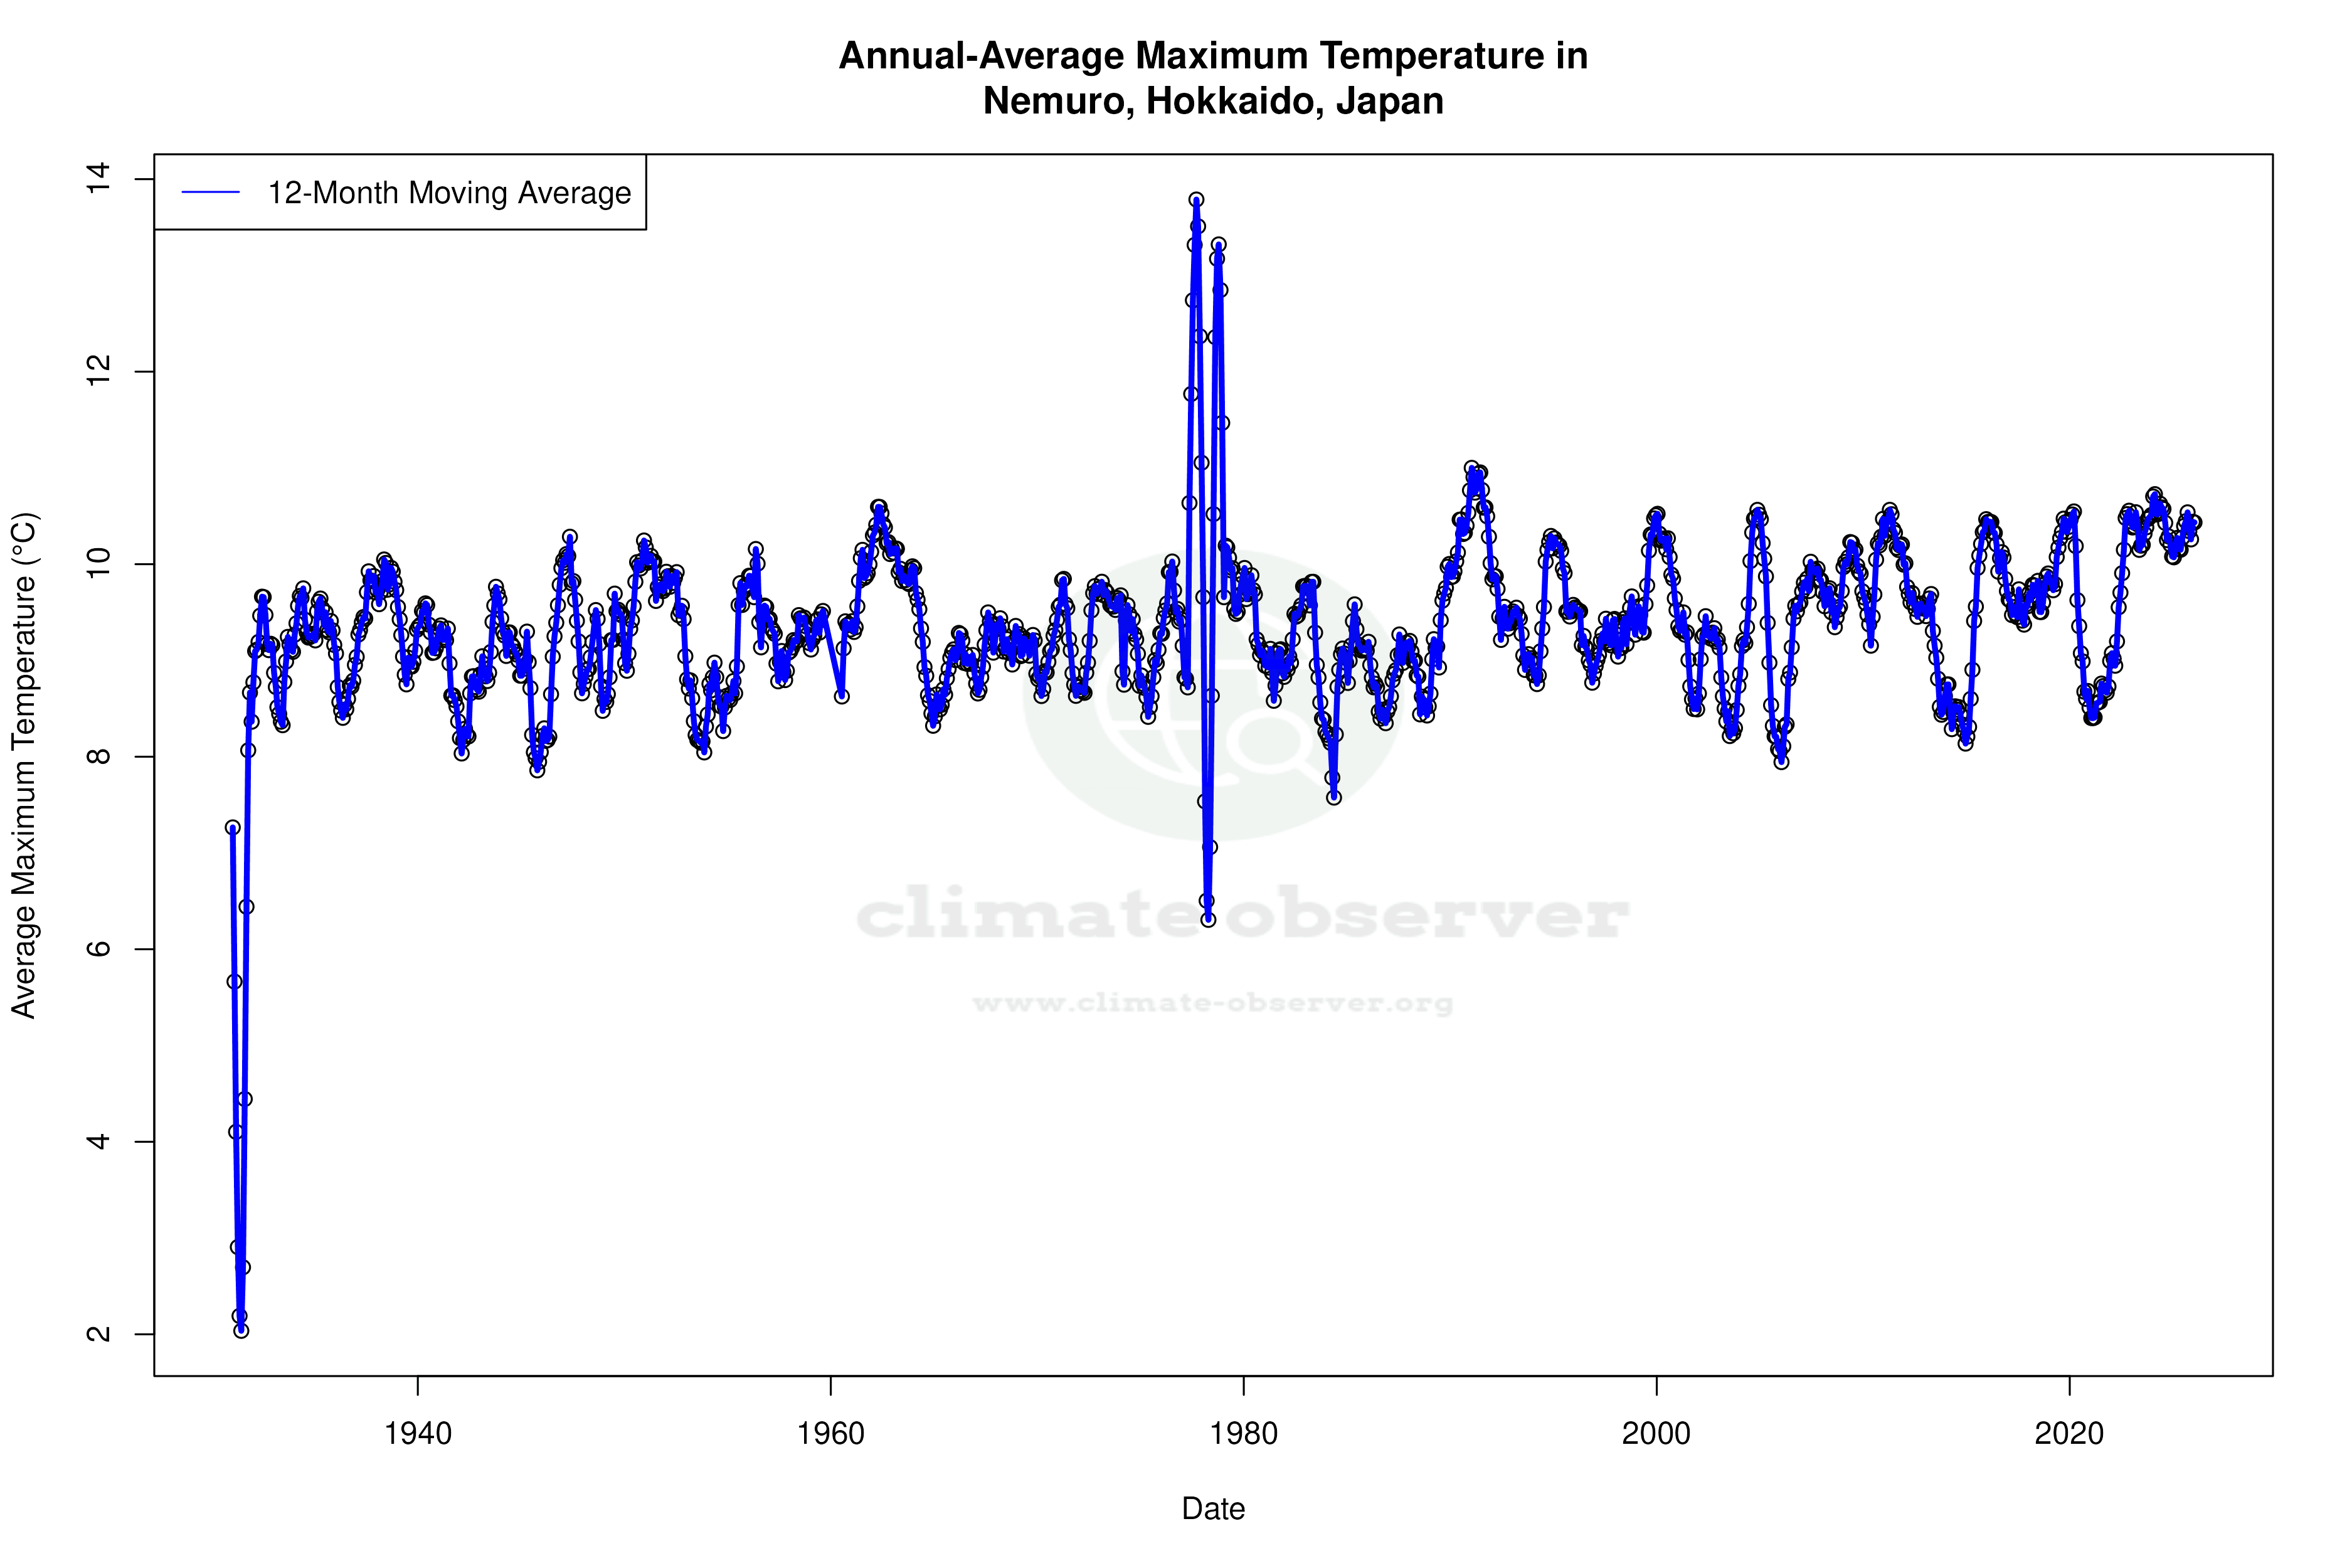


Max Temperature 12-Month MA | 1 of 6
Daily Data Points and Averages Throughout the Year
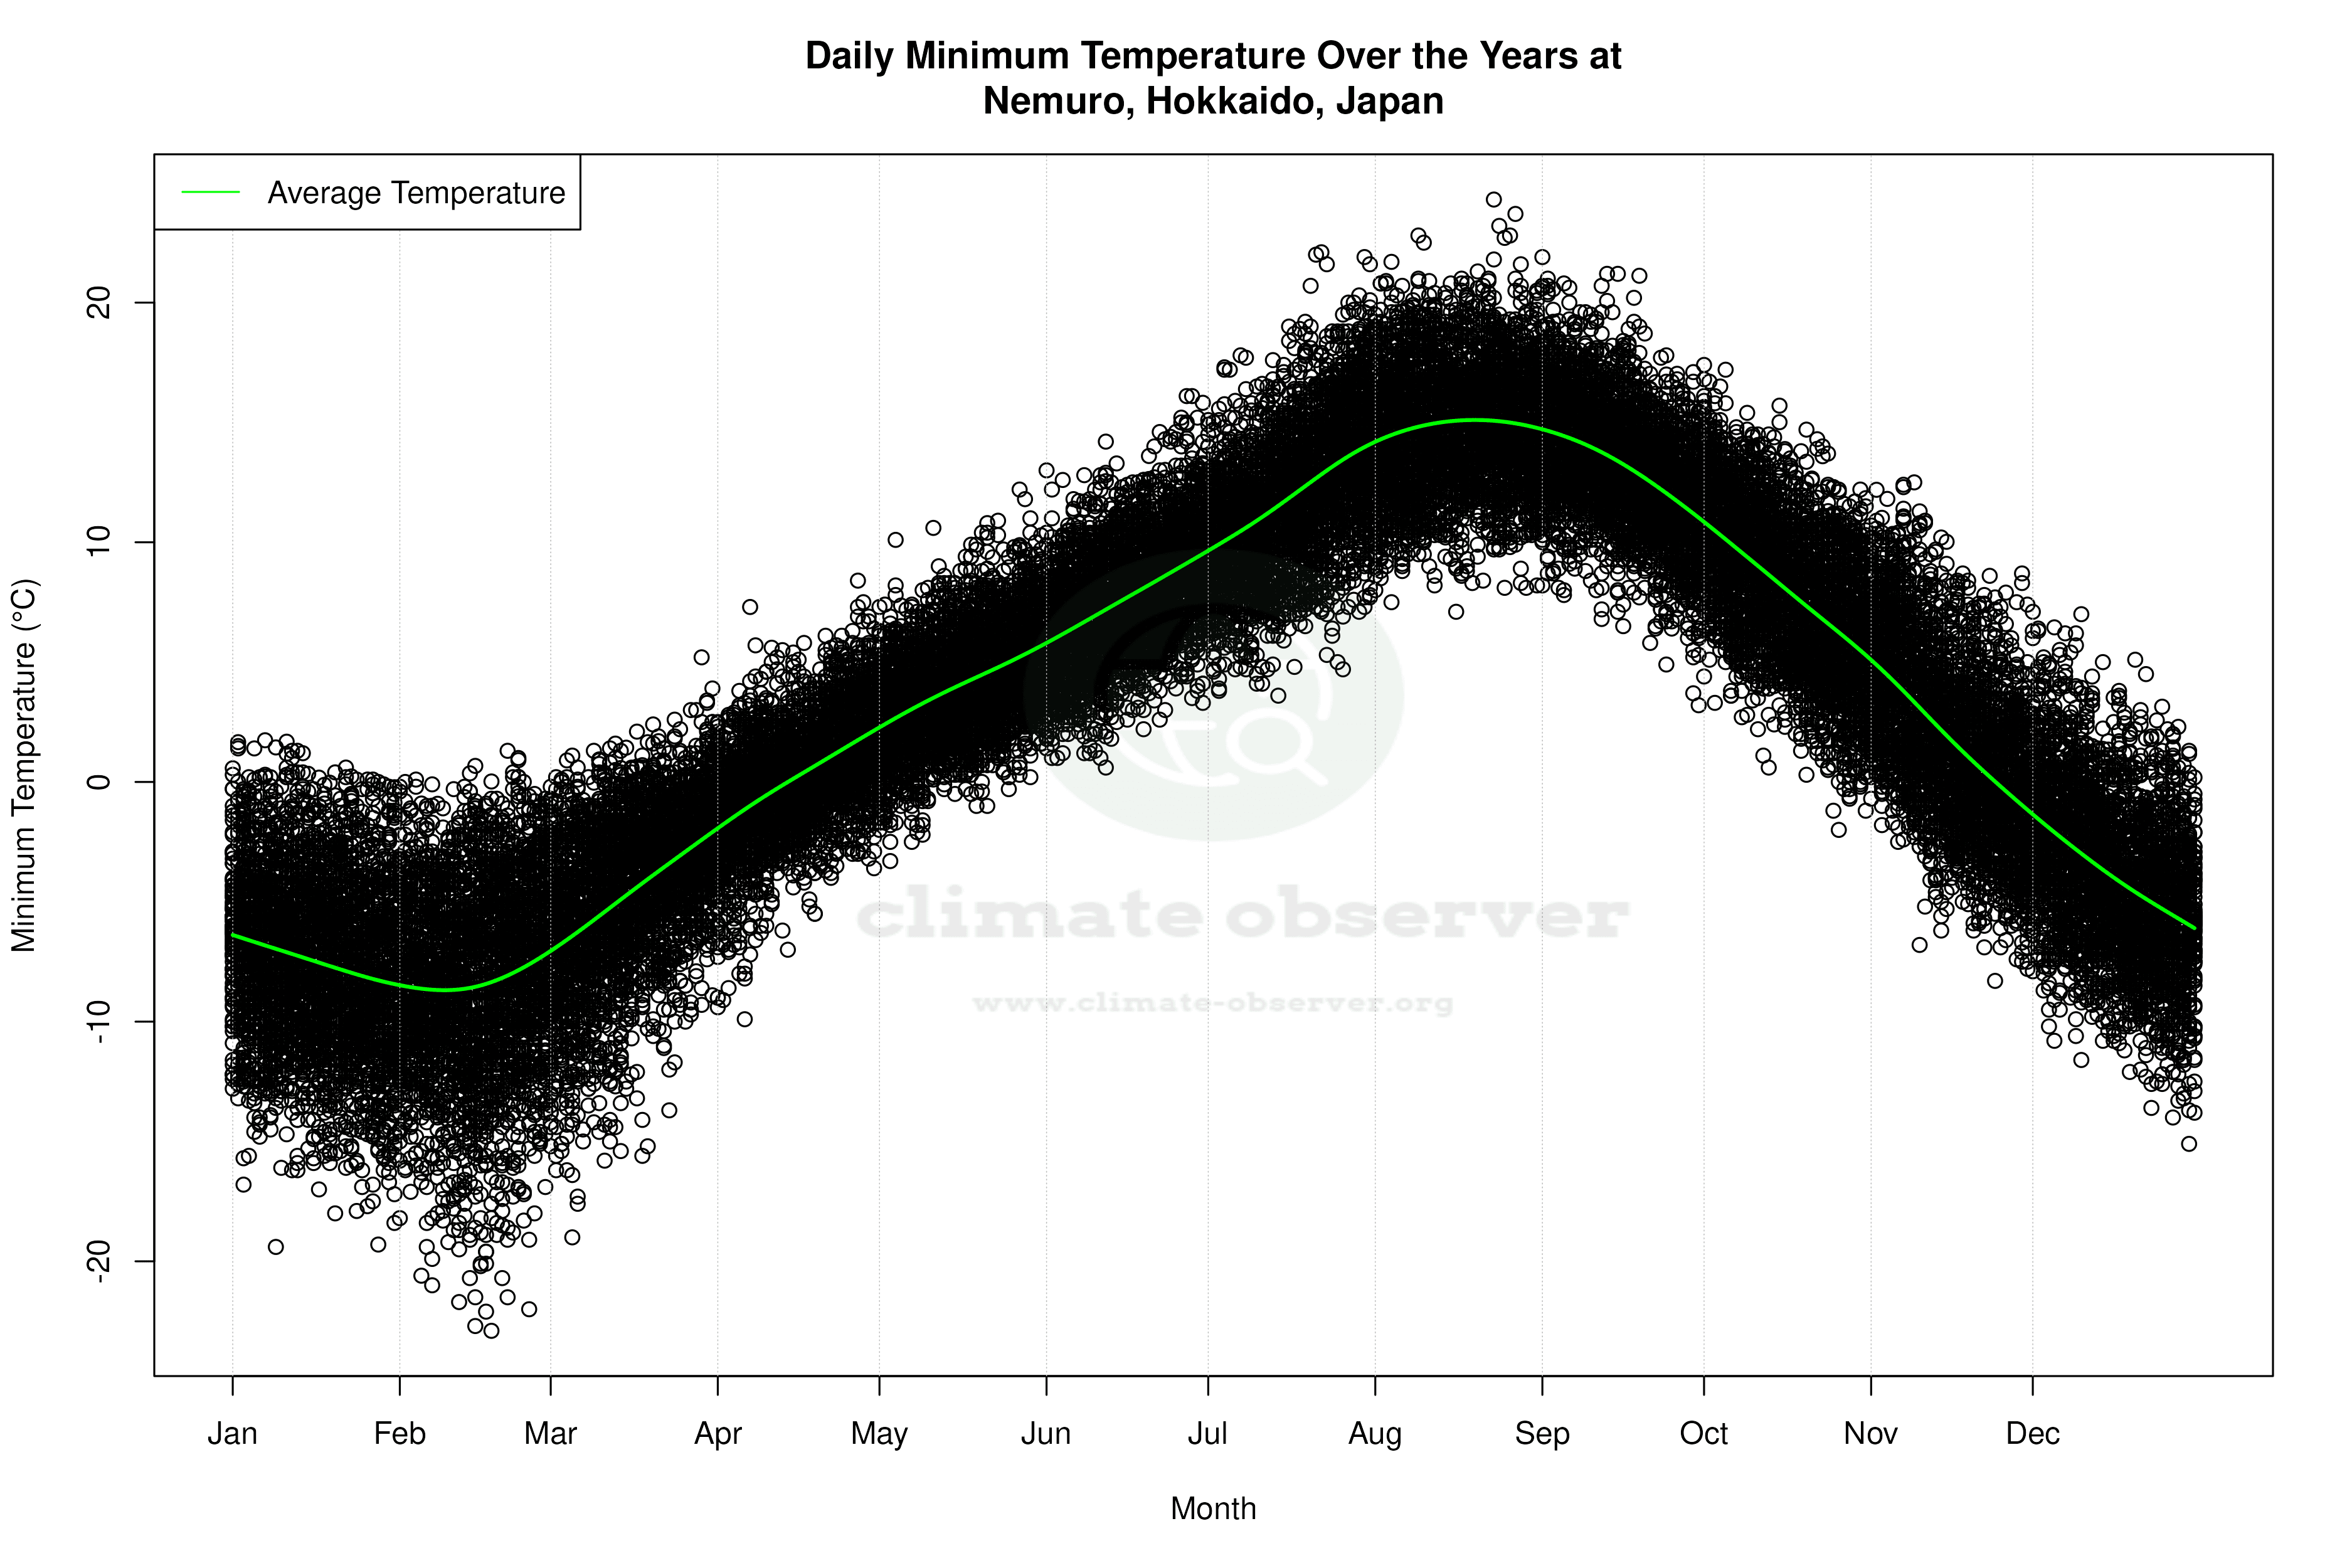
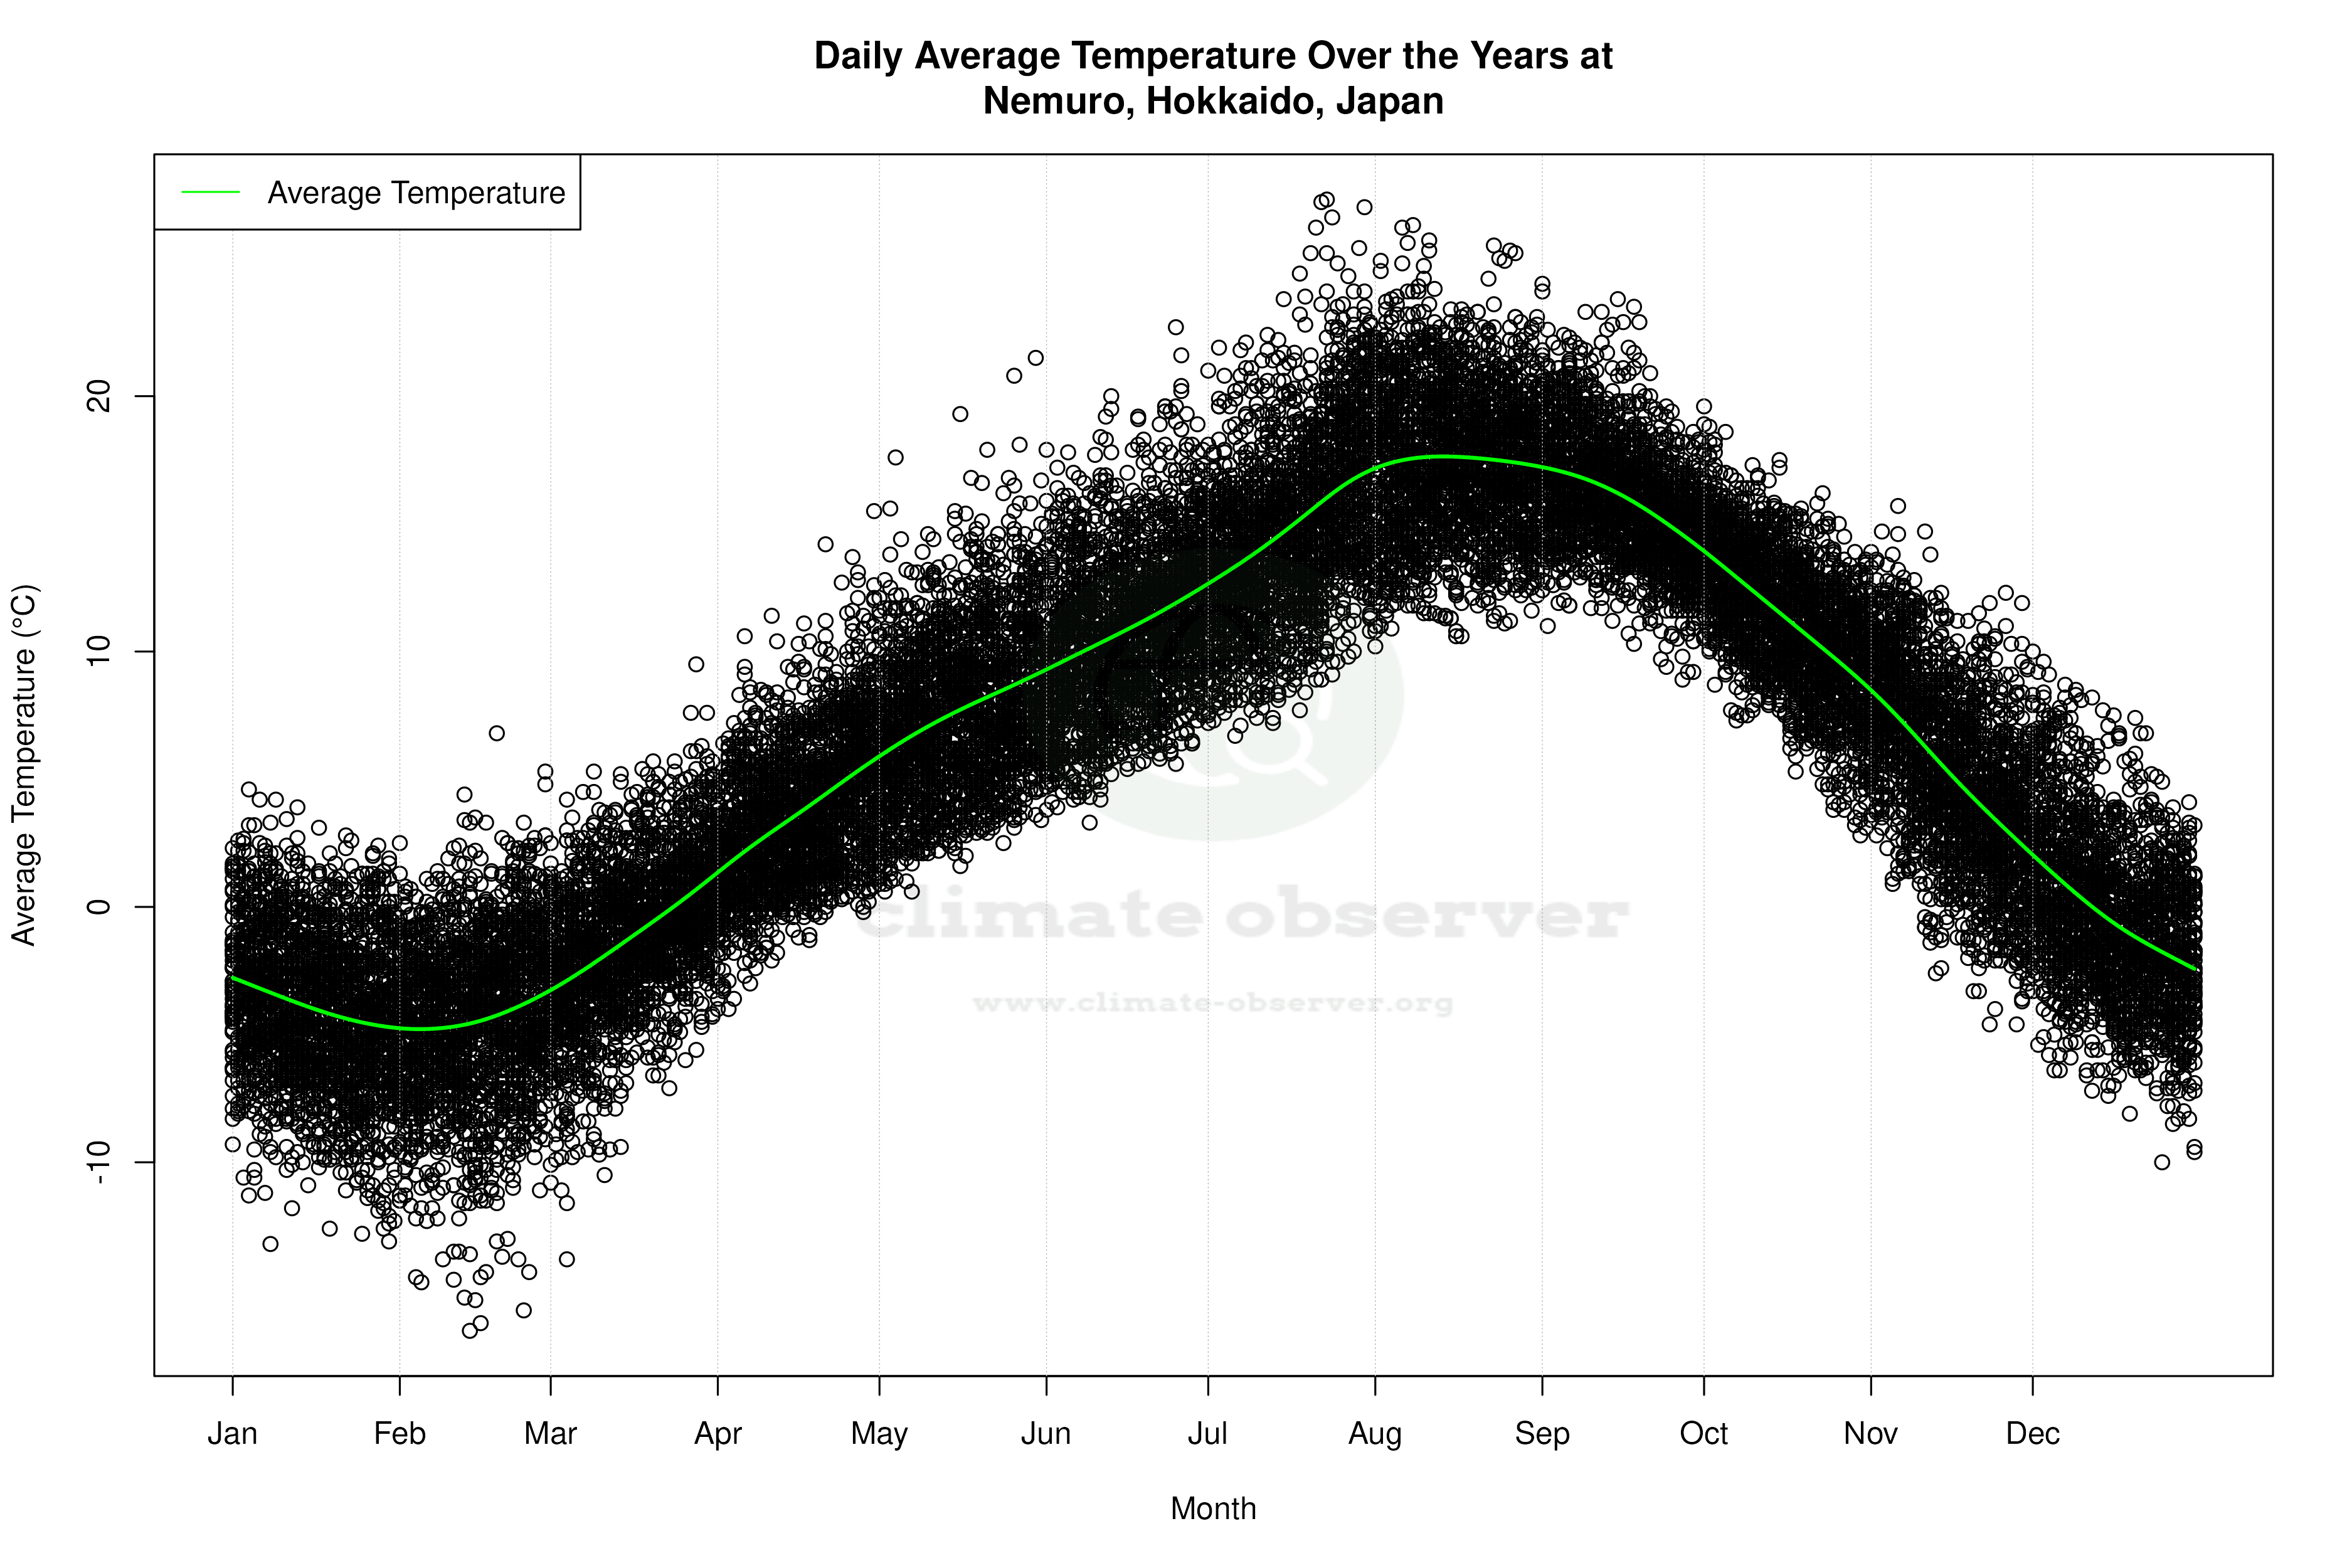
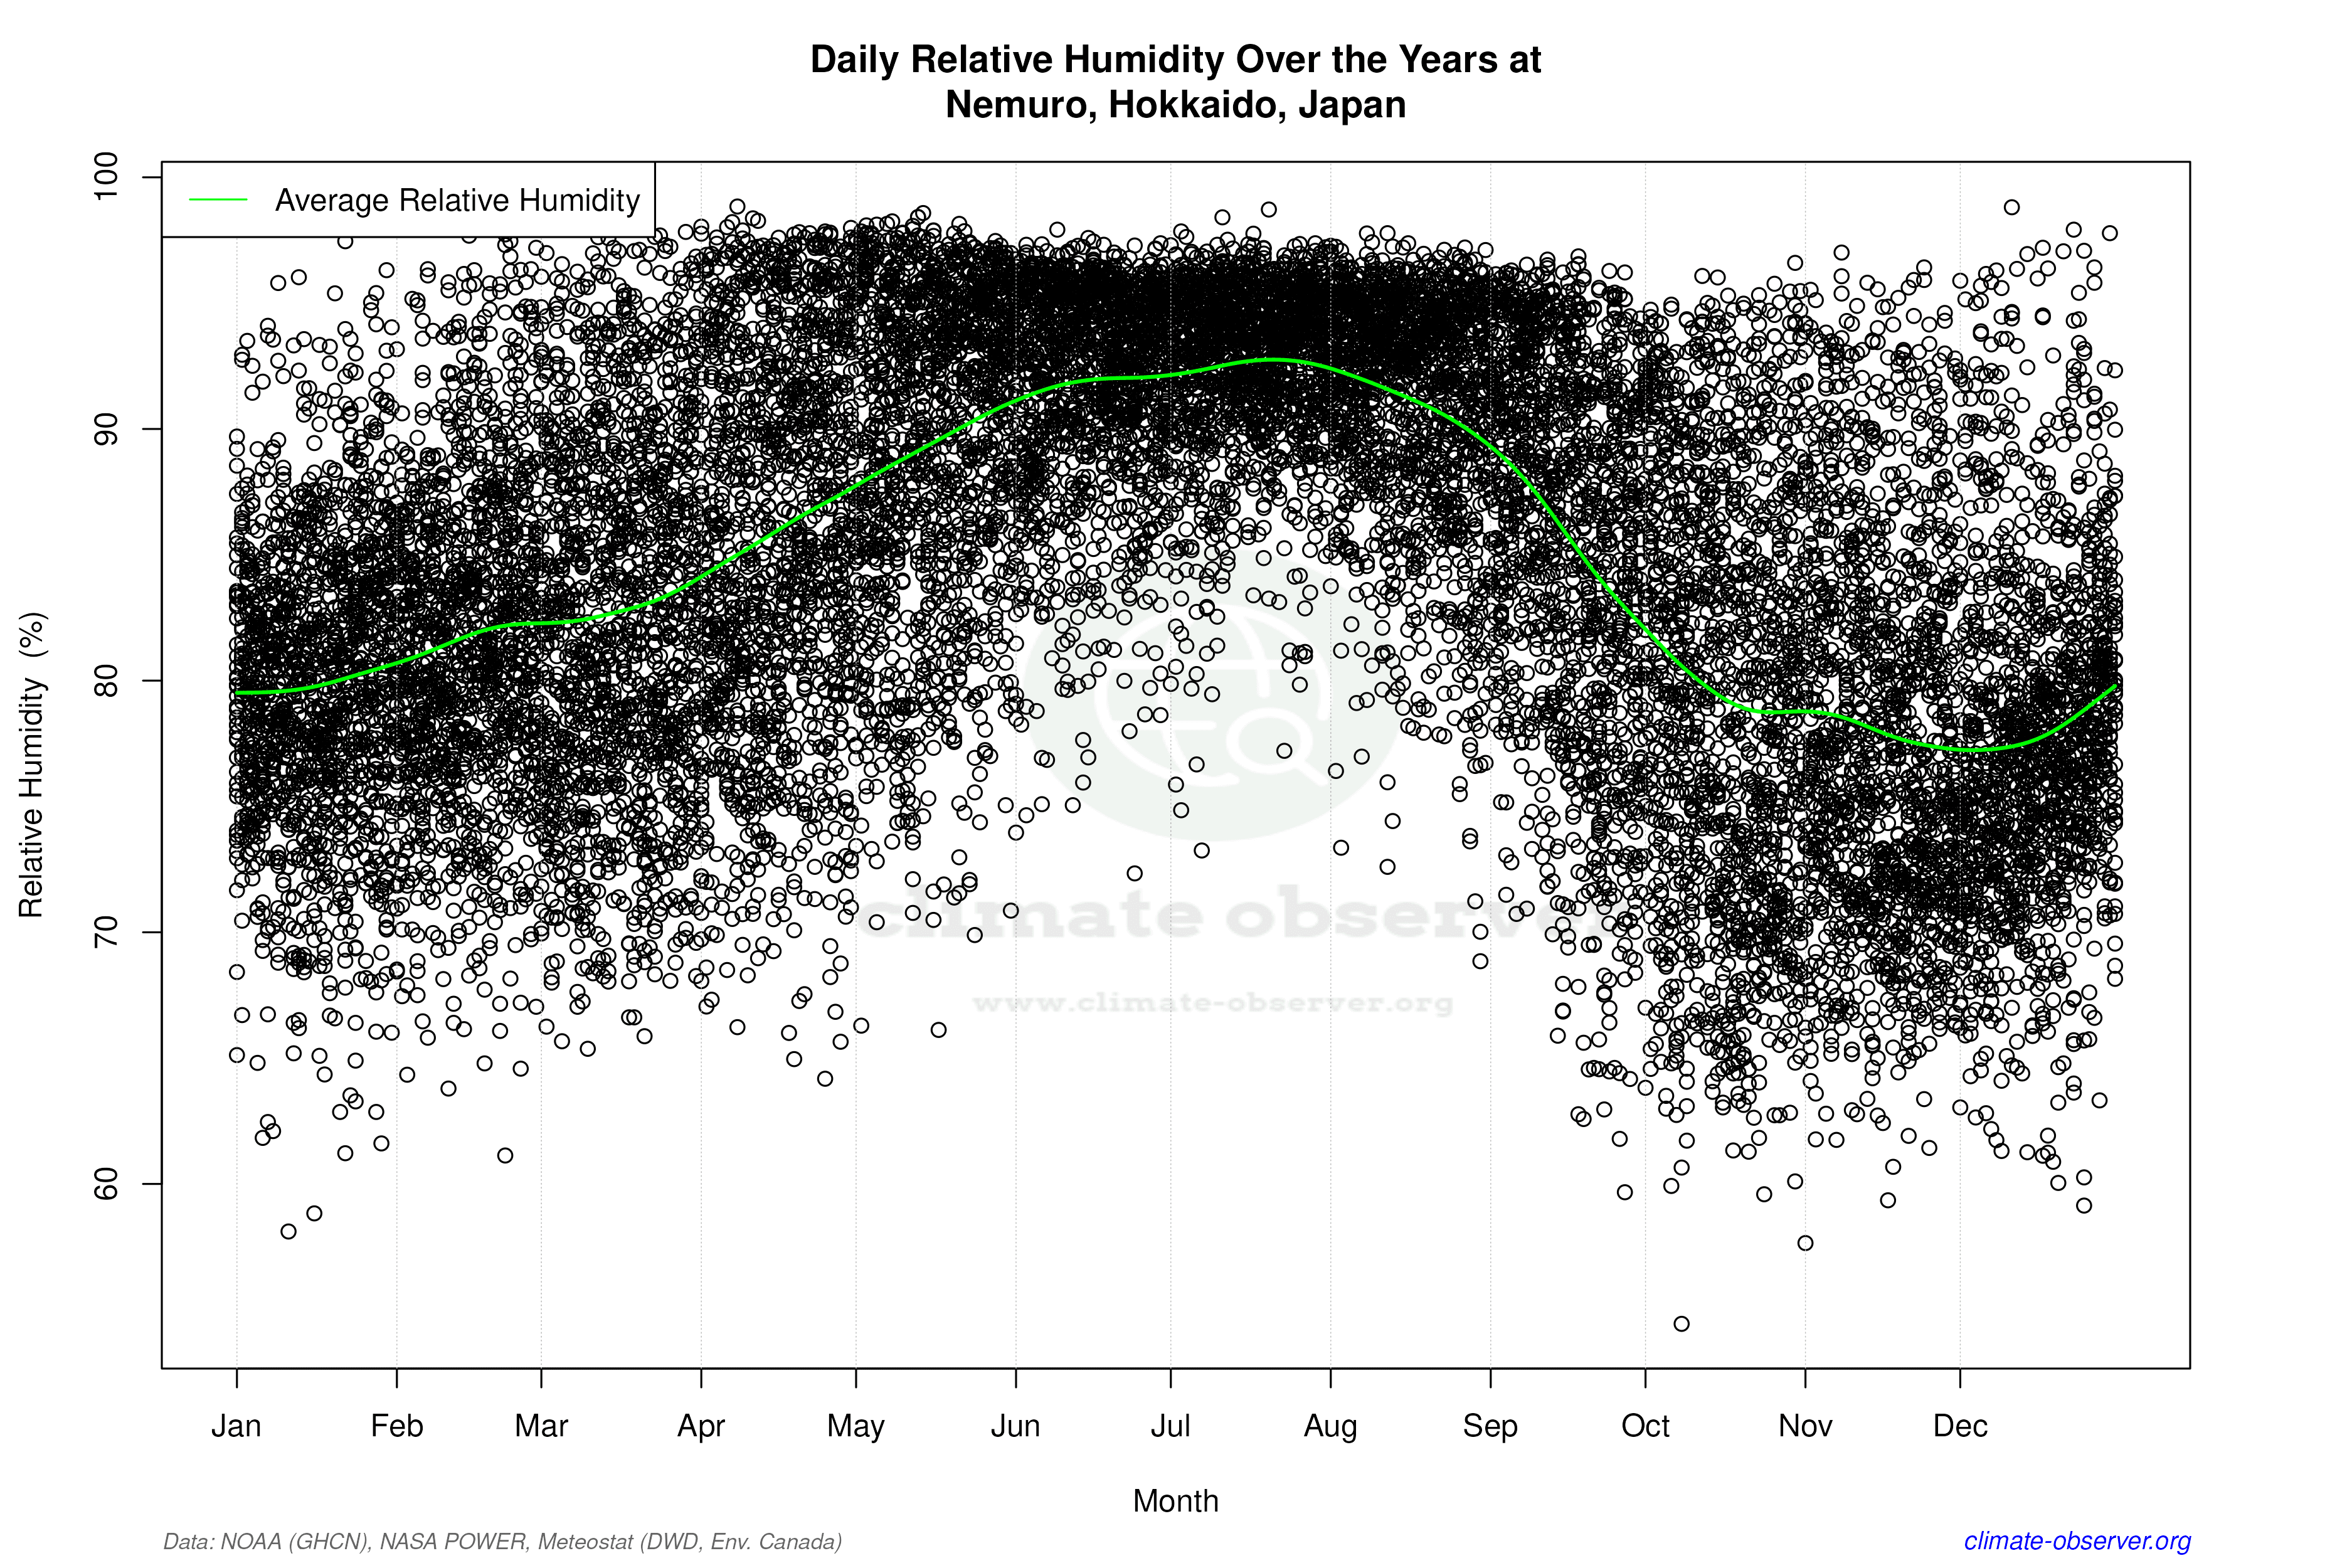

Average Max Temperature Throughout Year | 1 of 5
