Climate for Station: Sendai, Miyagi, Japan
Loading live weather...
Climate Analysis & Overview
Sendai is experiencing a warming trend, with significant increases in low temperatures over the past decade. The precipitation pattern remains relatively stable, with a slight shift towards more even distribution. These changes align with Japan's broader climate goals of reducing the impacts of climate change through adaptation and mitigation strategies.
Climate Classification and Geography
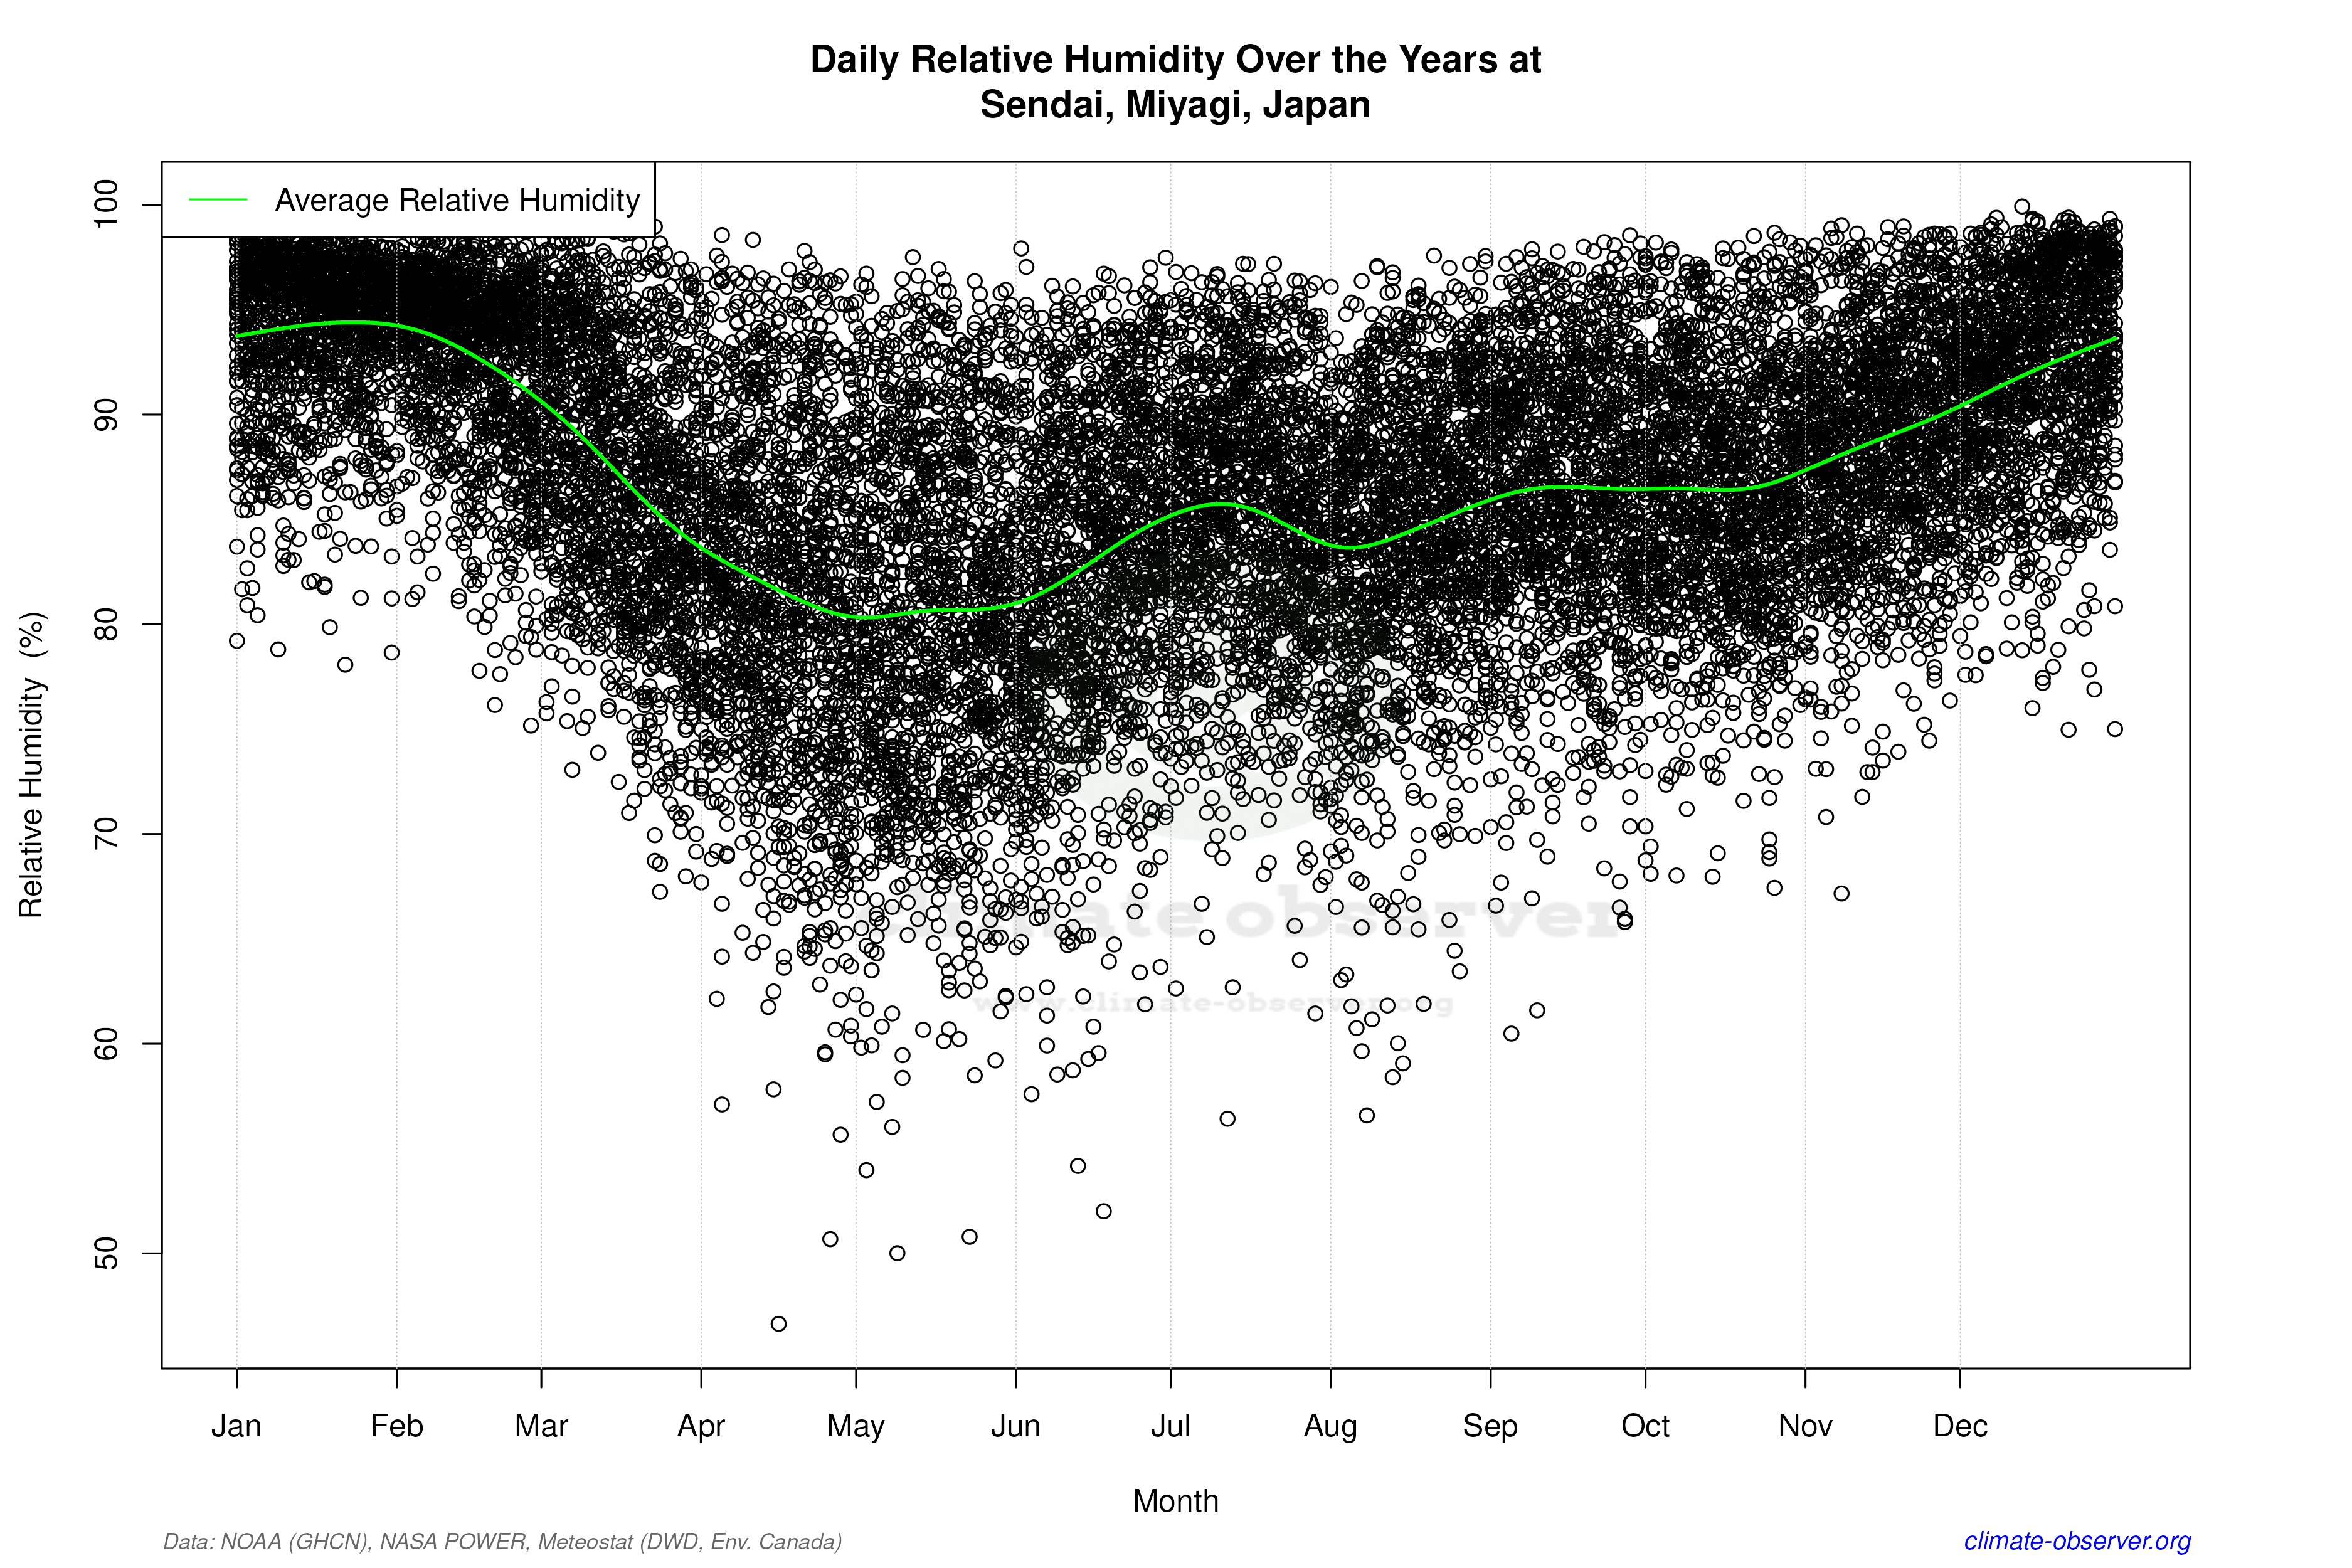
Sendai, located at 38.267°N, 140.9°E, falls under the humid subtropical climate classification (Cfa) according to the Köppen system. This classification is characterised by hot, humid summers and mild winters. The city's proximity to the Pacific Ocean and its location within the Tohoku region of Japan influence its climate, contributing to the frequent occurrence of typhoons and heavy rainfall events. The surrounding mountains also play a role, creating a rain shadow effect that can lead to variable precipitation patterns.
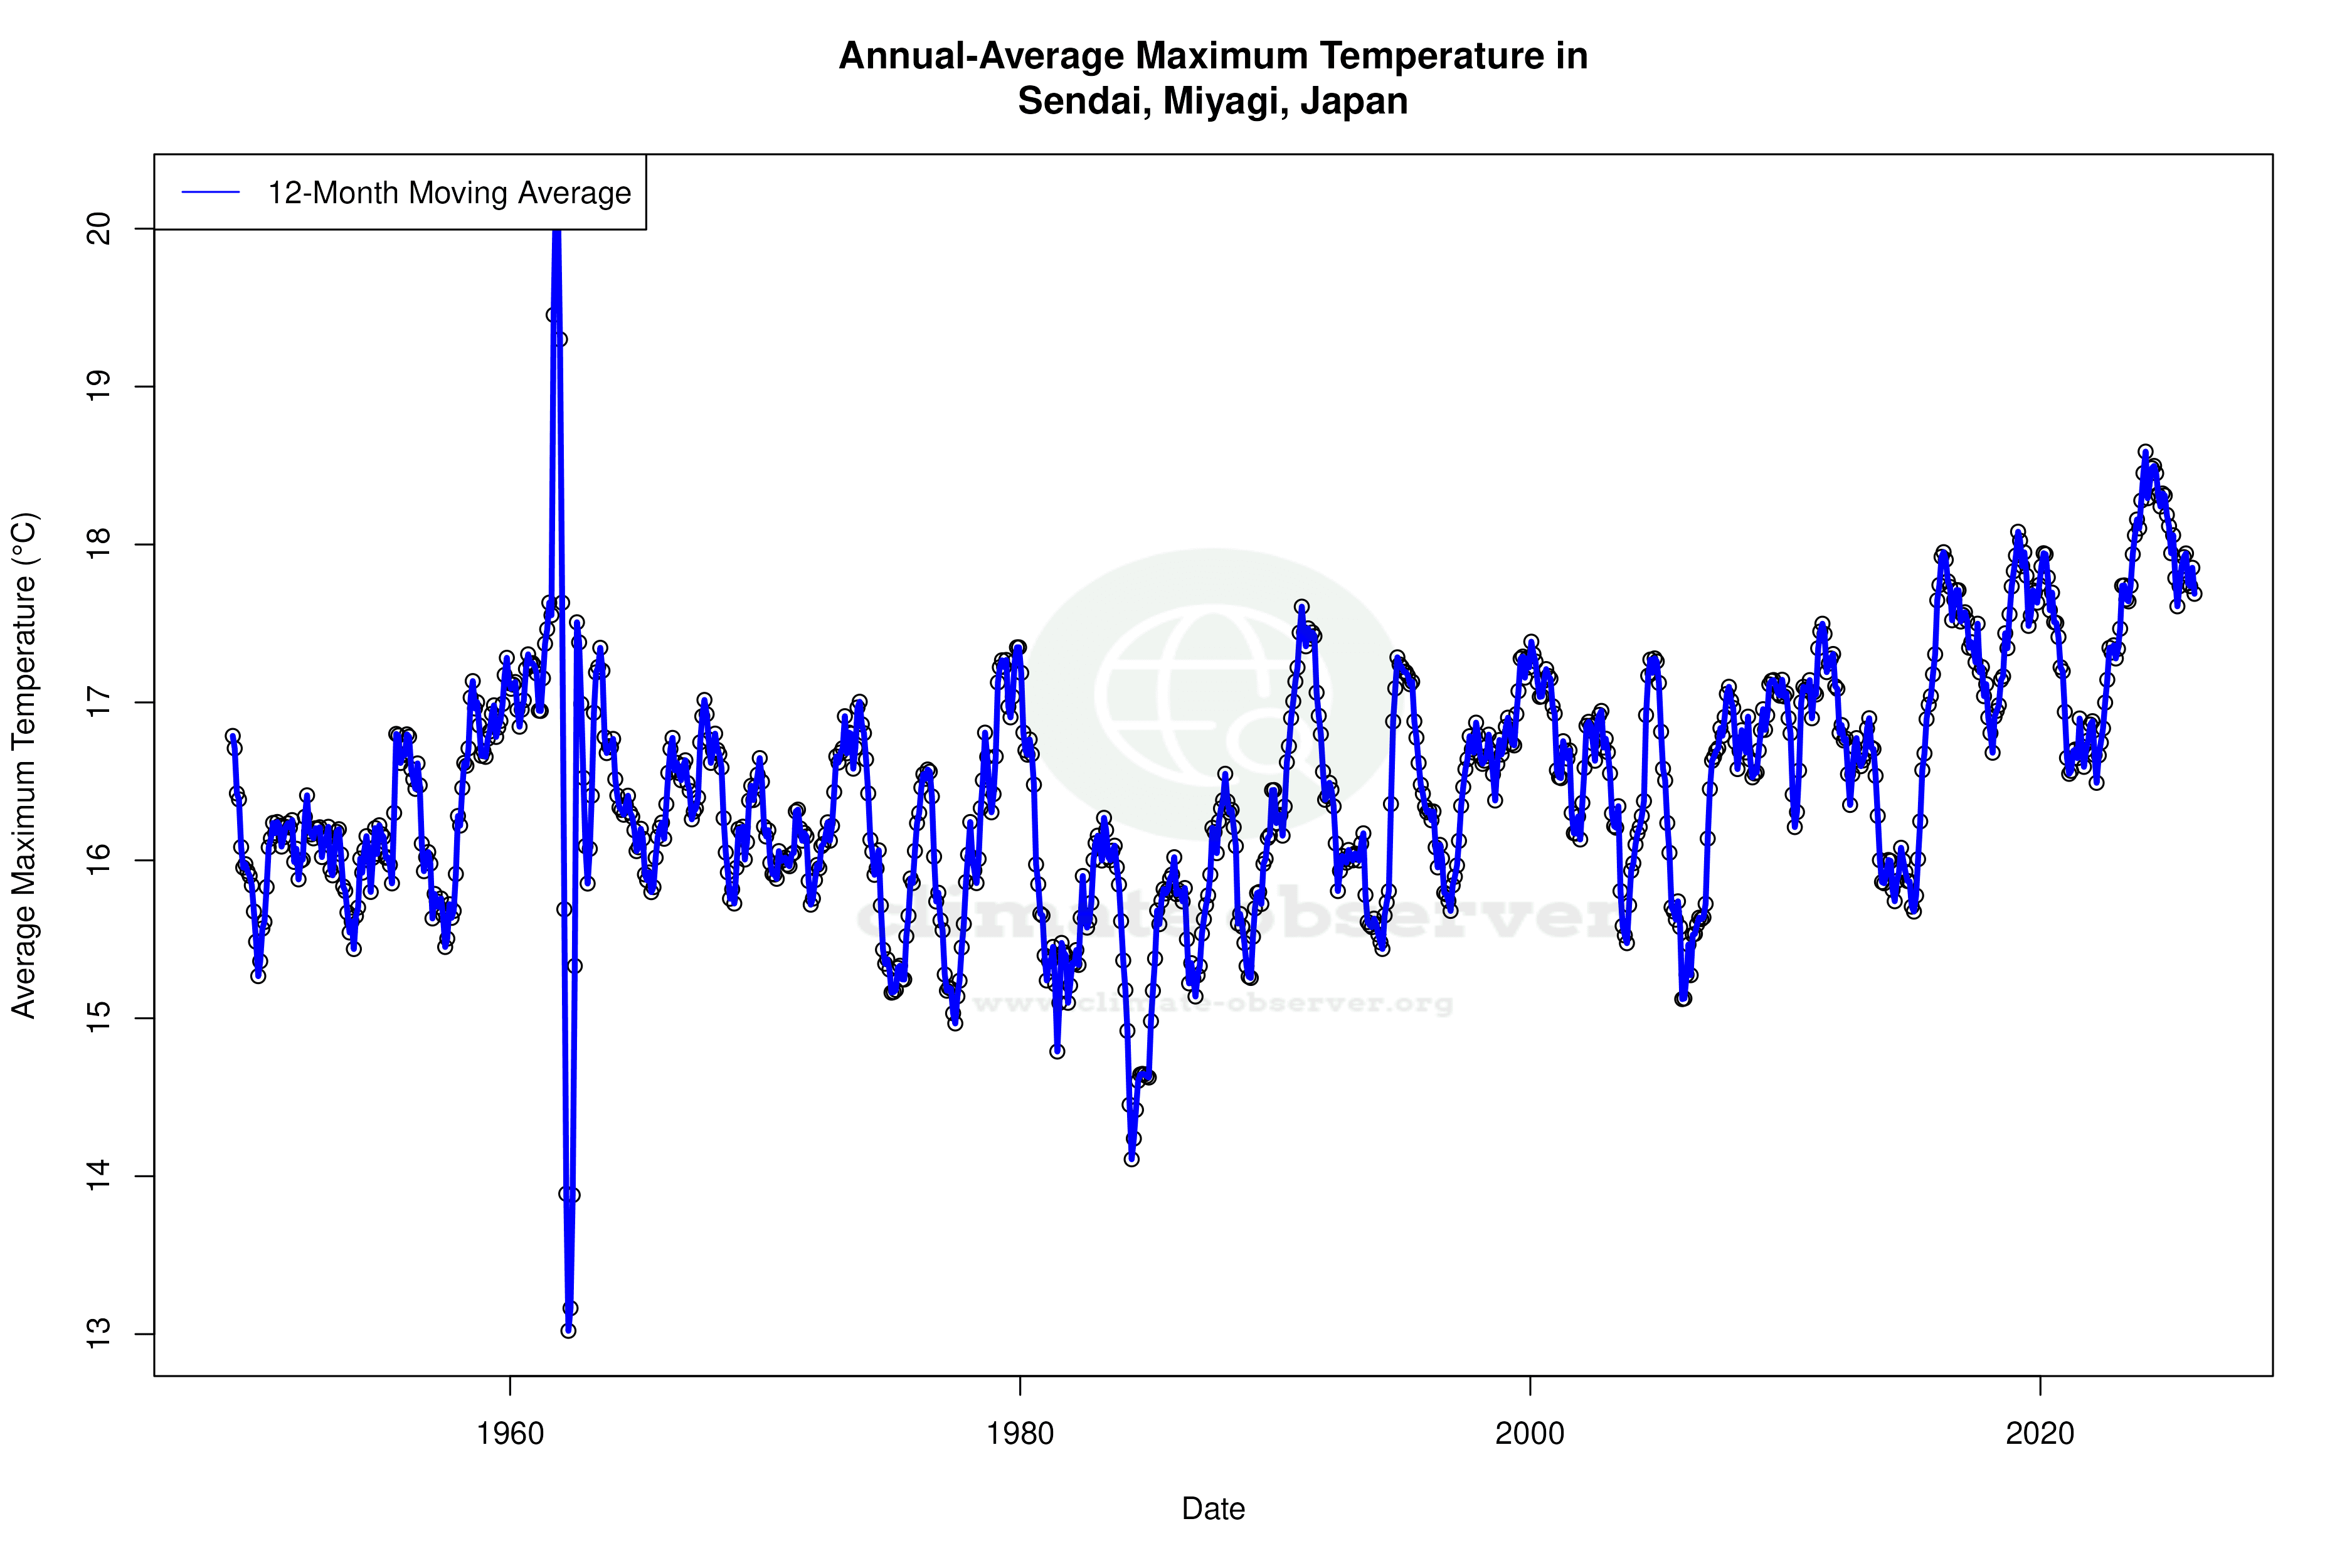
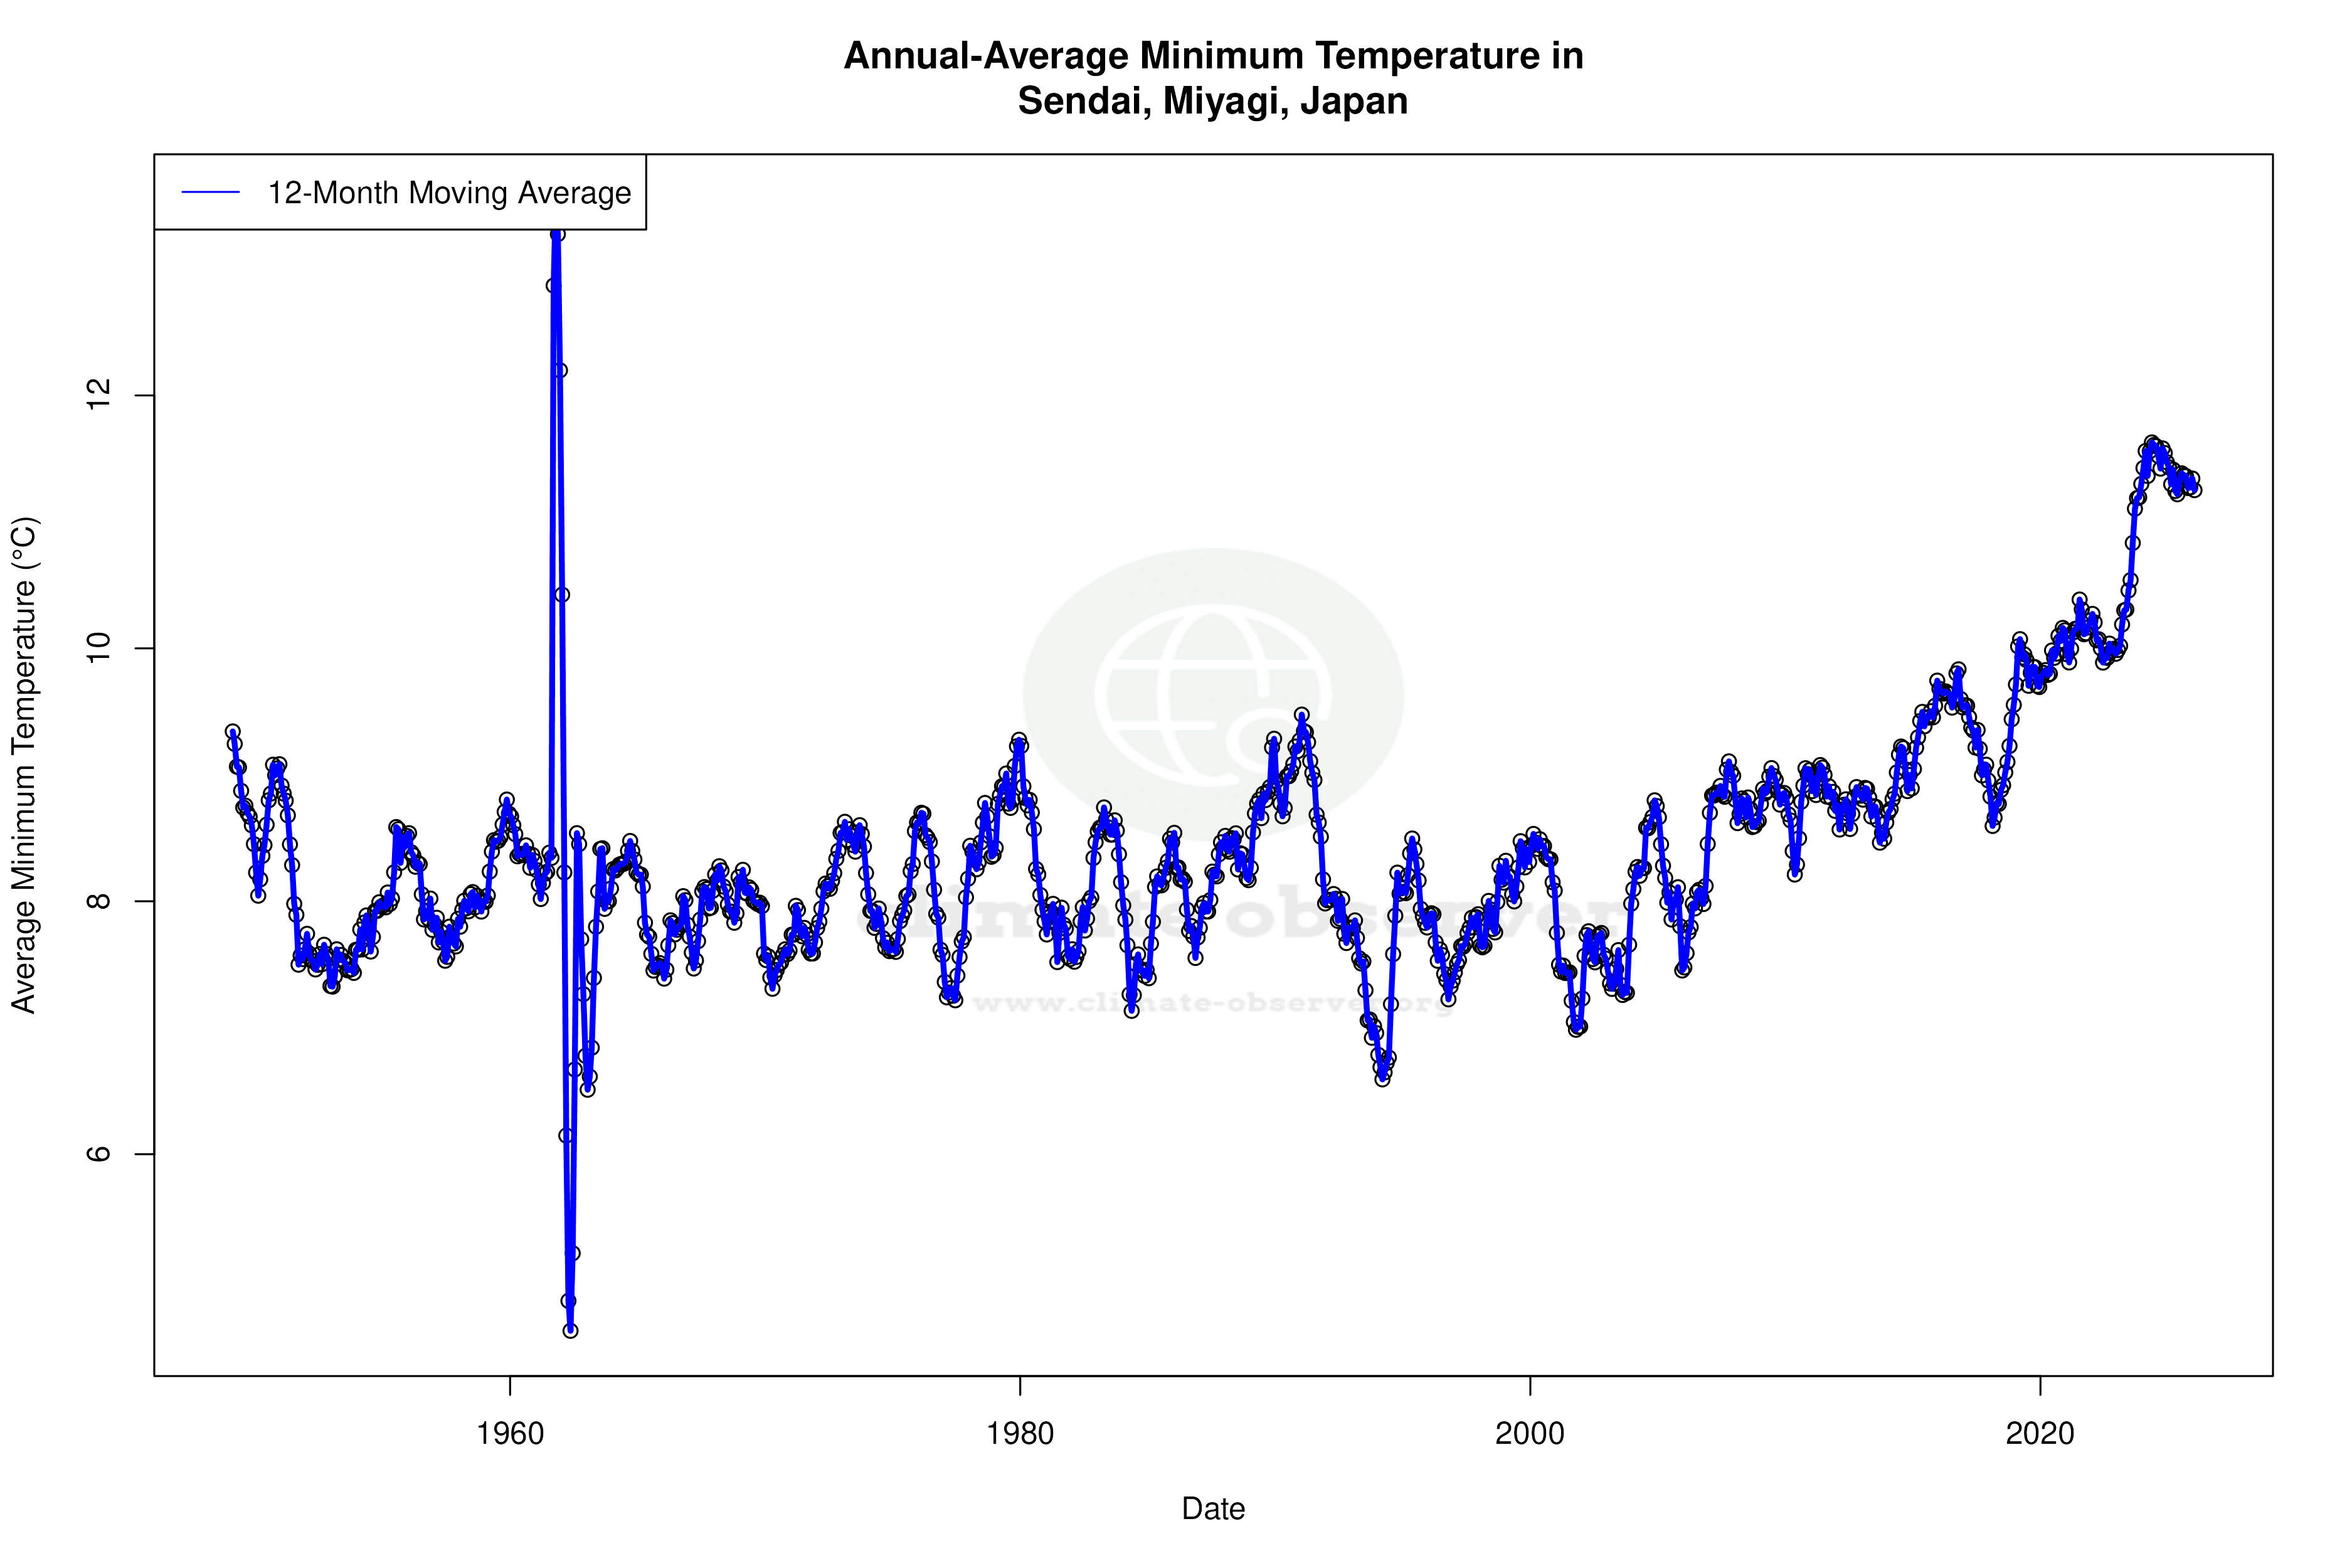
Temperature Trends: A Decade of Change
Over the past decade, Sendai has experienced a pronounced warming trend, particularly in low temperatures. The 10-year trend shows an increase in low temperatures by 2.55°C (4.60°F), while high temperatures have risen by 0.82°C (1.48°F). These changes are more pronounced than the all-time trends, which show a more modest warming of 0.23°C (0.41°F) for lows and 0.14°C (0.25°F) for highs. This suggests a recent acceleration in warming, particularly during the night, which could have implications for energy consumption and public health.
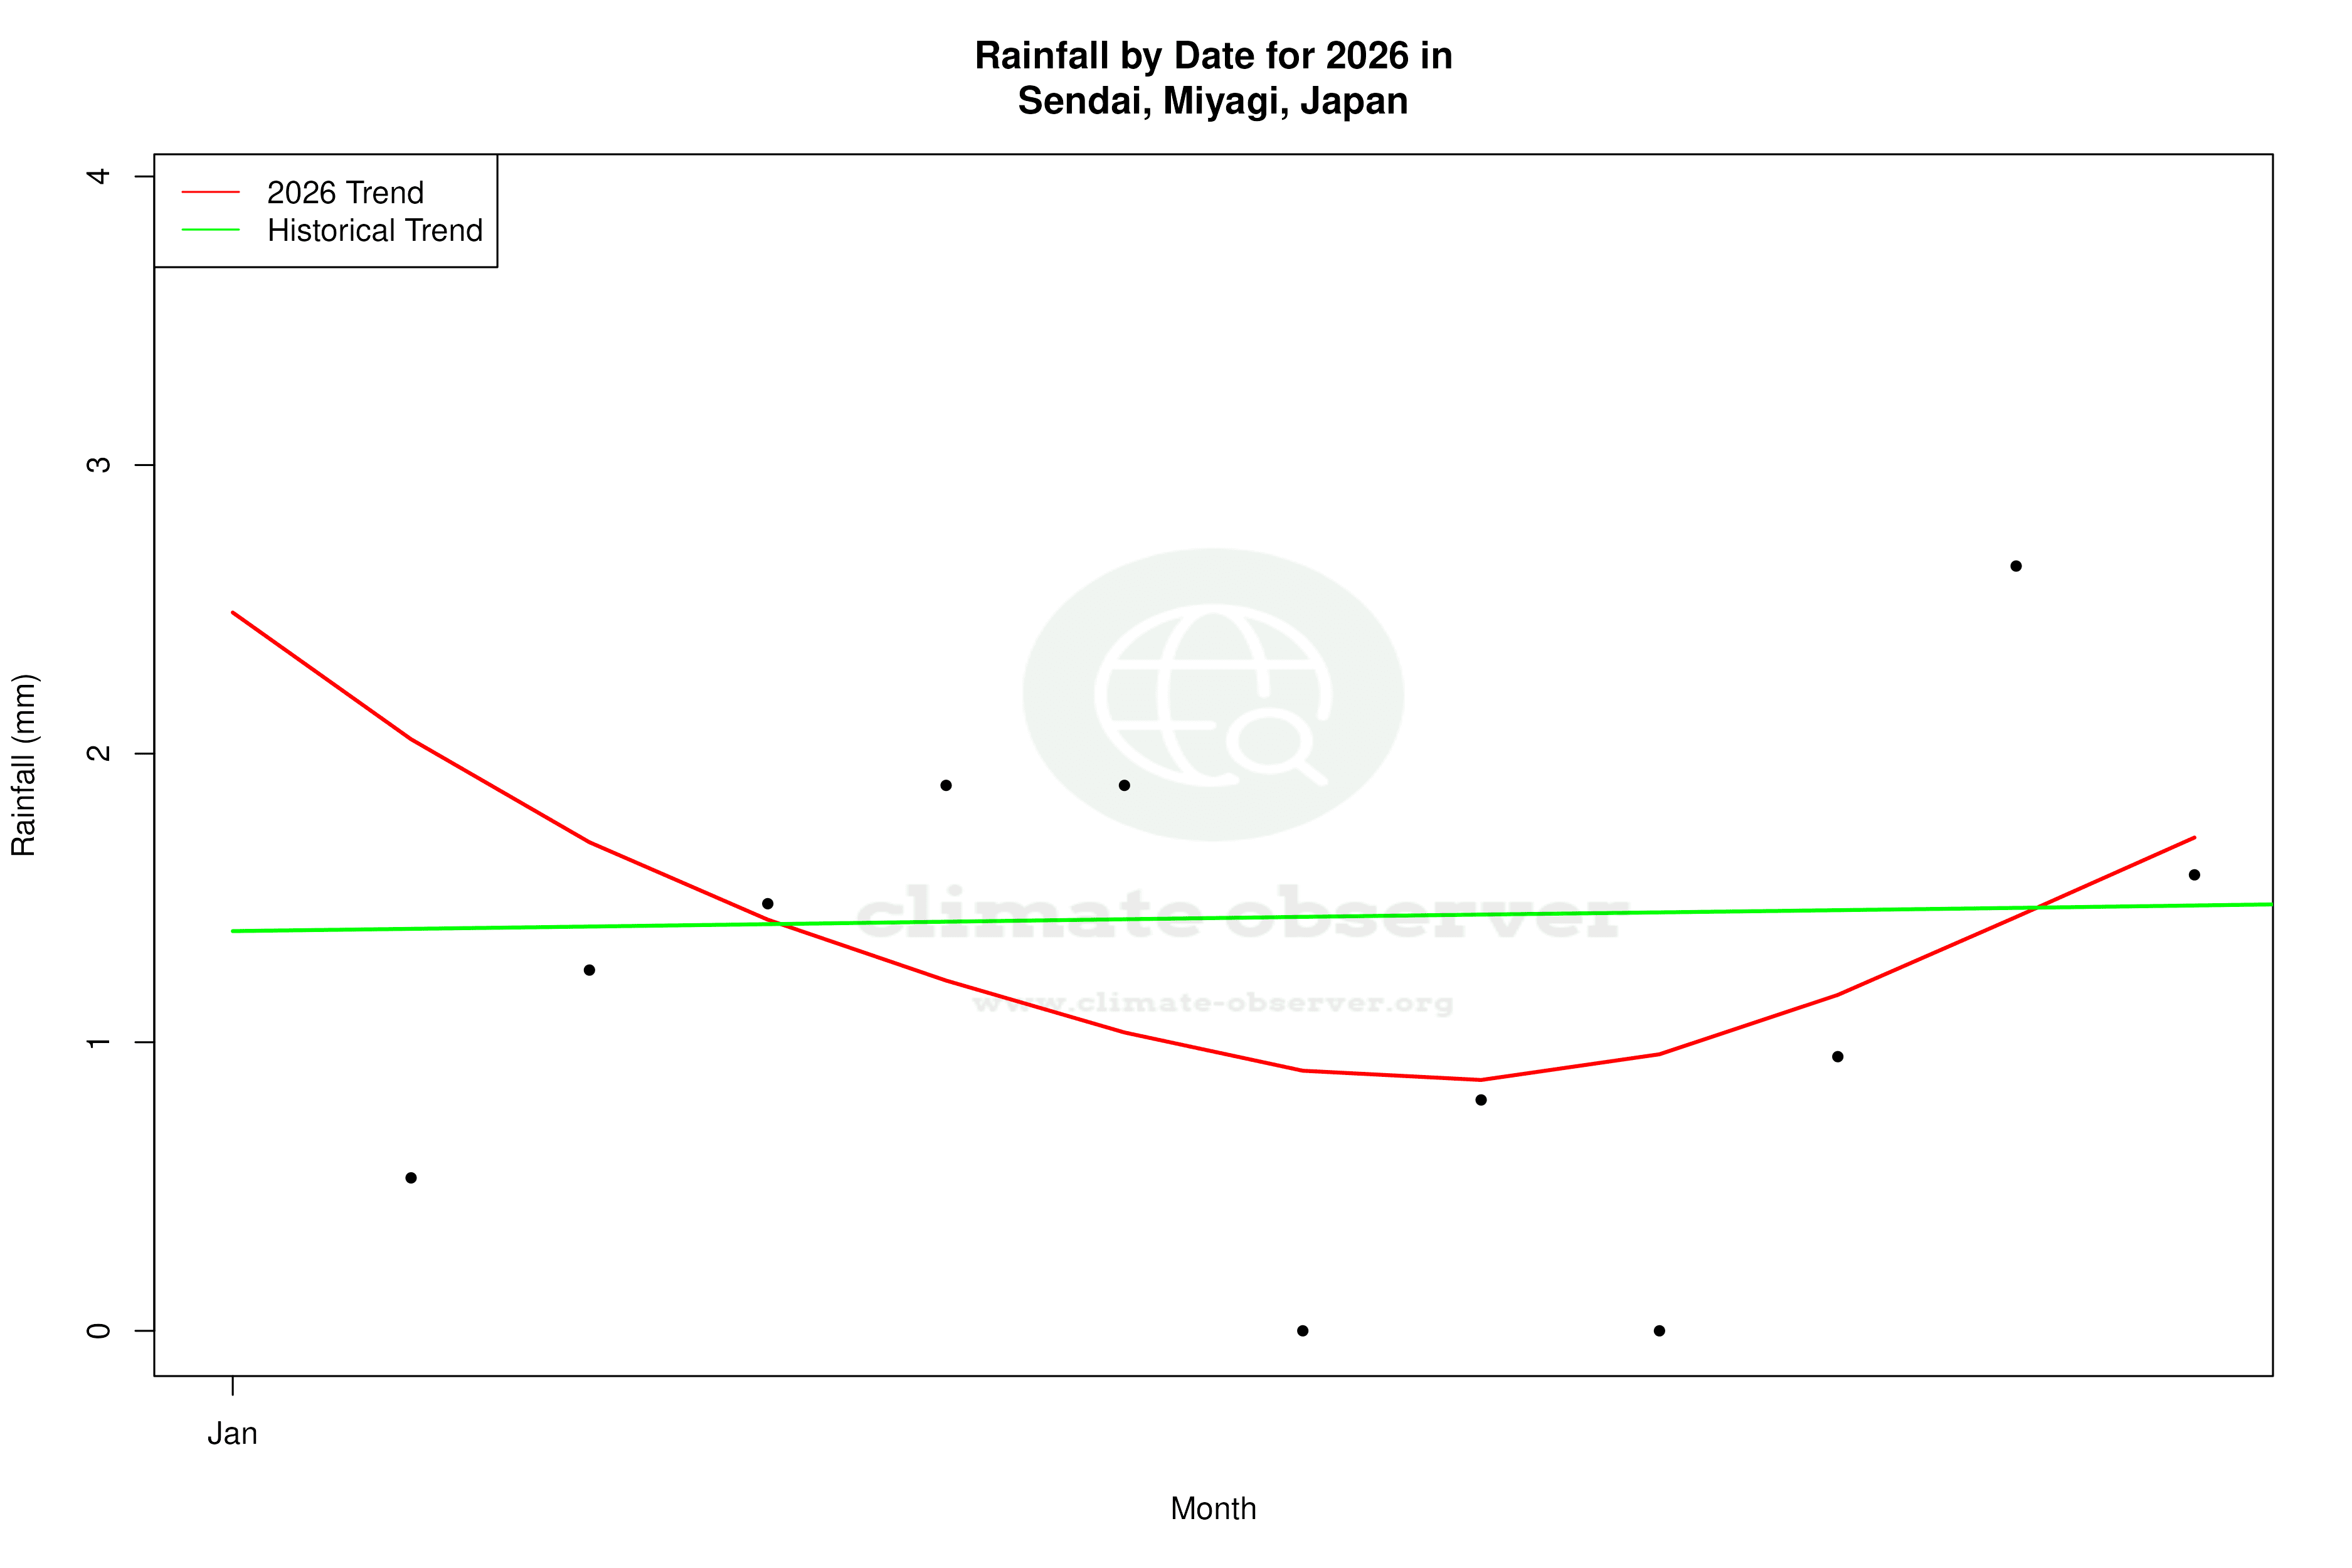
Precipitation Patterns: Stability Amidst Change
The Precipitation Concentration Index (PCI) for Sendai has shown a slight decrease from a baseline of 11.45 to the current 11.26. This indicates a marginal shift towards more evenly distributed precipitation throughout the year. While the PCI values suggest that precipitation remains moderately concentrated, the slight decrease implies a reduction in the intensity of individual rainfall events. This trend aligns with Japan's climate adaptation goals, which aim to manage water resources more effectively in the face of climate variability.
Extreme Temperatures: Records and Implications
Sendai's recorded temperature extremes highlight the city's vulnerability to both heatwaves and cold snaps. The highest recorded temperature is 44.00°C (111.20°F), while the lowest is -14.96°C (5.07°F). These extremes underscore the importance of climate resilience measures, particularly as the frequency and intensity of extreme weather events are expected to increase with climate change. Japan's national climate strategy focuses on enhancing infrastructure and community preparedness to mitigate the impacts of such events.
Regional Climate Goals and Future Outlook
Japan has set ambitious climate targets, including achieving carbon neutrality by 2050. Sendai's climate trends reflect the broader national context, where efforts are being made to reduce greenhouse gas emissions and adapt to changing climate conditions. The city's warming trend and evolving precipitation patterns highlight the need for continued investment in sustainable urban development and climate adaptation strategies.
Station Statistics
10-Year Trend
High: +0.56 °C/decade
Low: +2.47 °C/decade
Rain: +0.25 mm/decade
25-Year Trend
High: +0.65 °C/decade
Low: +1.40 °C/decade
Rain: -0.28 mm/decade
50-Year Trend
High: +0.36 °C/decade
Low: +0.47 °C/decade
Rain: -0.03 mm/decade
All-Time Trend
High: +0.13 °C/decade
Low: +0.22 °C/decade
Rain: +0.03 mm/decade
Percentage Above-Average Days
Last 12 Months: 52.1%
This Year: 27.5%
Precipitation Concentration Index (PCI) ℹ️
Last 12 Months: 11.8
Historical Average: 13.8
Percentile Rank of Last 12 Months ℹ️
High: 96th percentile
Low: 98th percentile
Rain: 24th percentile
Change in Variance ℹ️
High: +6.0%
Low: +3.5%
Intraday: -21.9%
Data Coverage
94.0%
First Year of Data
1948
Station Location
Historical Weather Records
| Max High | Avg High | Min High | Max Avg | Avg Avg | Min Avg | Max Low | Avg Low | Min Low | Max Precipitation | Avg Precipitation | Max Snow | Avg Snow | |
|---|---|---|---|---|---|---|---|---|---|---|---|---|---|
| Record | 44.0 °C | — | -7.0 °C | 31.8 °C | — | -6.3 °C | 27.6 °C | — | -15.0 °C | 172.4 mm | — | — | — |
| January | 17.9 °C | 5.2 °C | -6.4 °C | 11.0 °C | 1.6 °C | -6.0 °C | 6.7 °C | -2.4 °C | -12.0 °C | 64.6 mm | 1.5 mm | — | — |
| February | 20.9 °C | 5.9 °C | -7.0 °C | 16.3 °C | 2.1 °C | -5.4 °C | 9.0 °C | -2.2 °C | -15.0 °C | 56.0 mm | 1.7 mm | — | — |
| March | 24.2 °C | 9.3 °C | -2.7 °C | 17.4 °C | 5.1 °C | -2.7 °C | 11.7 °C | 0.4 °C | -9.8 °C | 72.8 mm | 2.4 mm | — | — |
| April | 29.9 °C | 15.1 °C | 1.4 °C | 21.5 °C | 10.6 °C | 1.3 °C | 15.5 °C | 5.5 °C | -3.7 °C | 88.0 mm | 3.1 mm | — | — |
| May | 33.2 °C | 19.9 °C | 7.9 °C | 25.3 °C | 15.4 °C | 6.0 °C | 19.3 °C | 10.8 °C | -0.7 °C | 87.5 mm | 3.5 mm | — | — |
| June | 35.1 °C | 22.6 °C | 11.3 °C | 30.7 °C | 19.0 °C | 10.7 °C | 26.7 °C | 15.5 °C | 7.0 °C | 137.7 mm | 4.8 mm | — | — |
| July | 36.7 °C | 26.2 °C | 14.8 °C | 31.7 °C | 22.8 °C | 13.3 °C | 27.4 °C | 19.7 °C | 9.0 °C | 126.0 mm | 5.4 mm | — | — |
| August | 44.0 °C | 28.2 °C | 16.5 °C | 31.8 °C | 24.5 °C | 16.1 °C | 27.6 °C | 21.3 °C | 11.8 °C | 127.8 mm | 5.0 mm | — | — |
| September | 36.5 °C | 24.5 °C | 12.1 °C | 30.7 °C | 20.9 °C | 13.3 °C | 26.2 °C | 17.2 °C | 6.0 °C | 172.4 mm | 6.1 mm | — | — |
| October | 29.9 °C | 19.3 °C | 7.3 °C | 23.7 °C | 15.2 °C | 6.1 °C | 21.3 °C | 10.7 °C | 0.3 °C | 123.9 mm | 4.1 mm | — | — |
| November | 24.4 °C | 13.6 °C | -1.0 °C | 20.6 °C | 9.4 °C | -0.3 °C | 15.6 °C | 4.7 °C | -5.1 °C | 110.5 mm | 2.3 mm | — | — |
| December | 21.8 °C | 8.1 °C | -3.3 °C | 17.3 °C | 4.2 °C | -6.3 °C | 11.8 °C | 0.2 °C | -11.6 °C | 82.5 mm | 1.6 mm | — | — |
Data Visualisations
Remove WatermarksCurrent Year Climate Trends vs Historical


Max Temperature this Year | 1 of 6
Climate 12-Month Moving Averages


Max Temperature 12-Month MA | 1 of 6
Daily Data Points and Averages Throughout the Year


Average Max Temperature Throughout Year | 1 of 5
