Climate for Station: Tokyo, Japan
Loading live weather...
Climate Analysis & Overview
Tokyo's climate is experiencing a notable warming trend, with significant increases in both high and low temperatures over the past decade. The city's precipitation patterns have become more evenly distributed, reflecting a shift in the Precipitation Concentration Index. These changes align with Japan's broader climate goals of adapting to and mitigating climate change impacts.
Urban Heat and Rising Temperatures
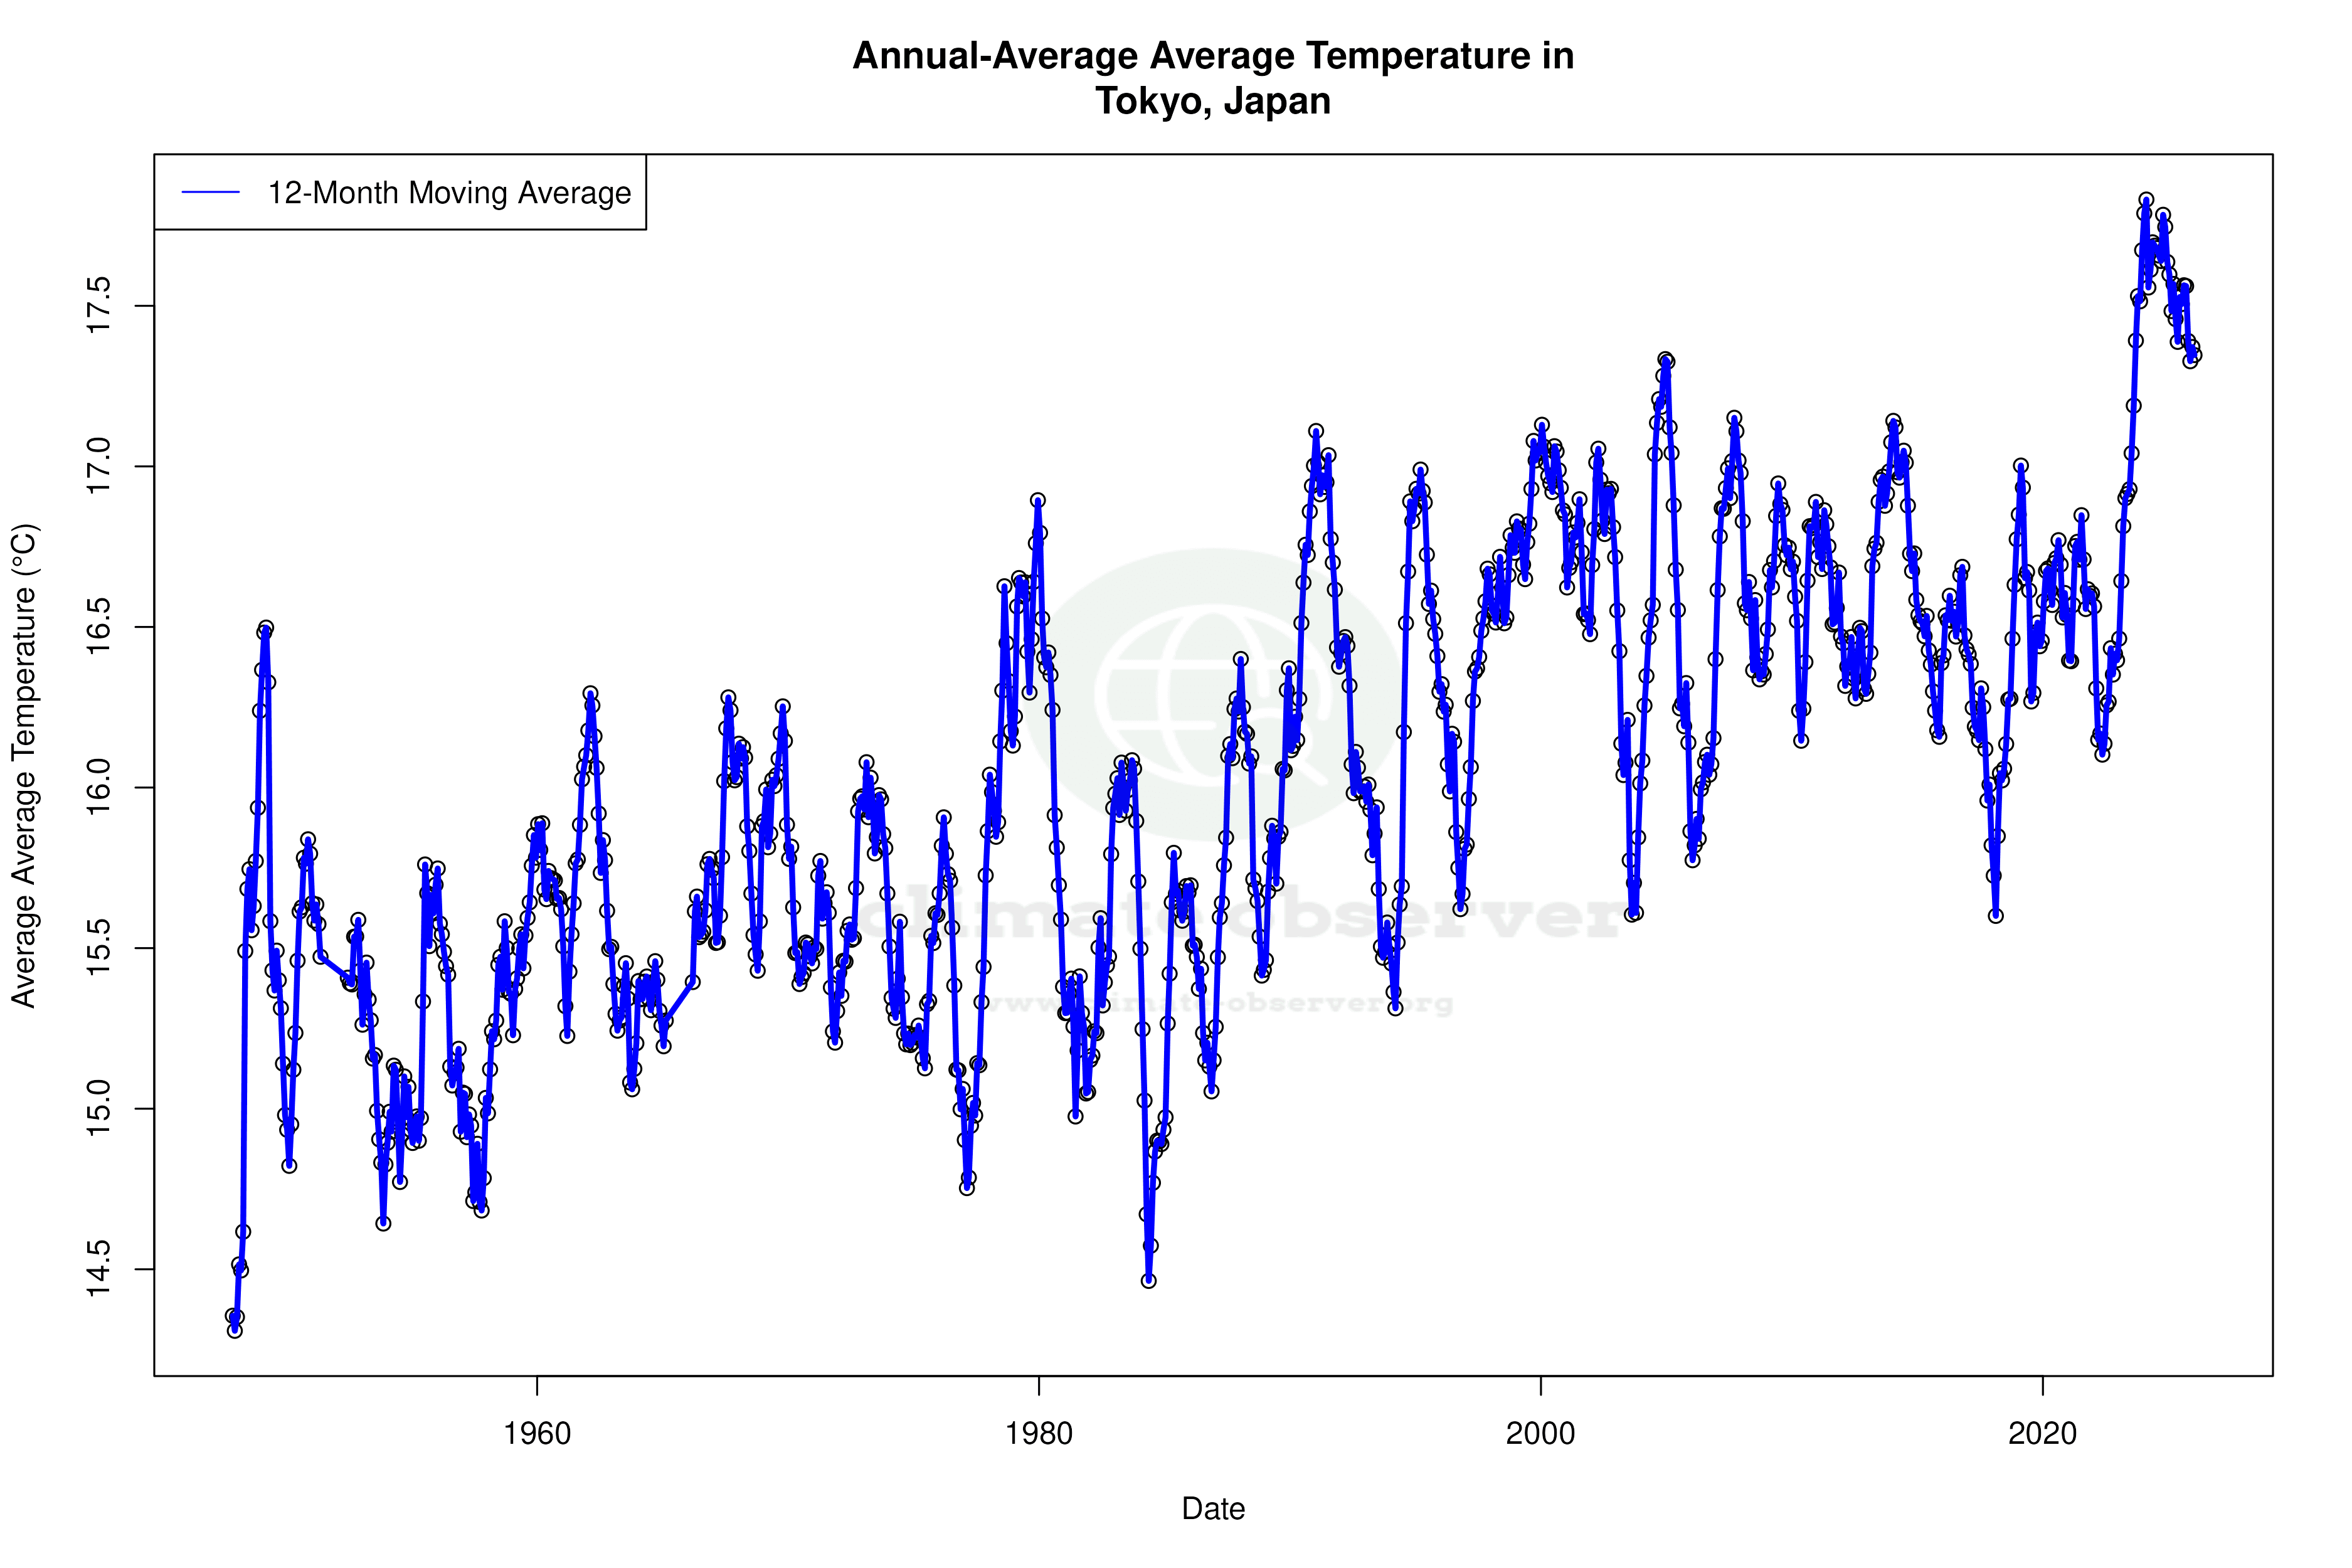
Tokyo, located at 35.683°N, 139.767°E, is classified under the Köppen climate classification as Cfa, indicating a humid subtropical climate. This classification is characterised by hot, humid summers and mild winters. Over the past decade, Tokyo has experienced a warming trend with high temperatures increasing by 0.97°C (1.75°F) and low temperatures rising by 1.22°C (2.20°F). This recent trend is more pronounced than the all-time warming, where high temperatures have risen by 0.19°C (0.34°F) and low temperatures by 0.32°C (0.58°F). The urban heat island effect, exacerbated by Tokyo's dense infrastructure and high population density, likely contributes to these rising temperatures.
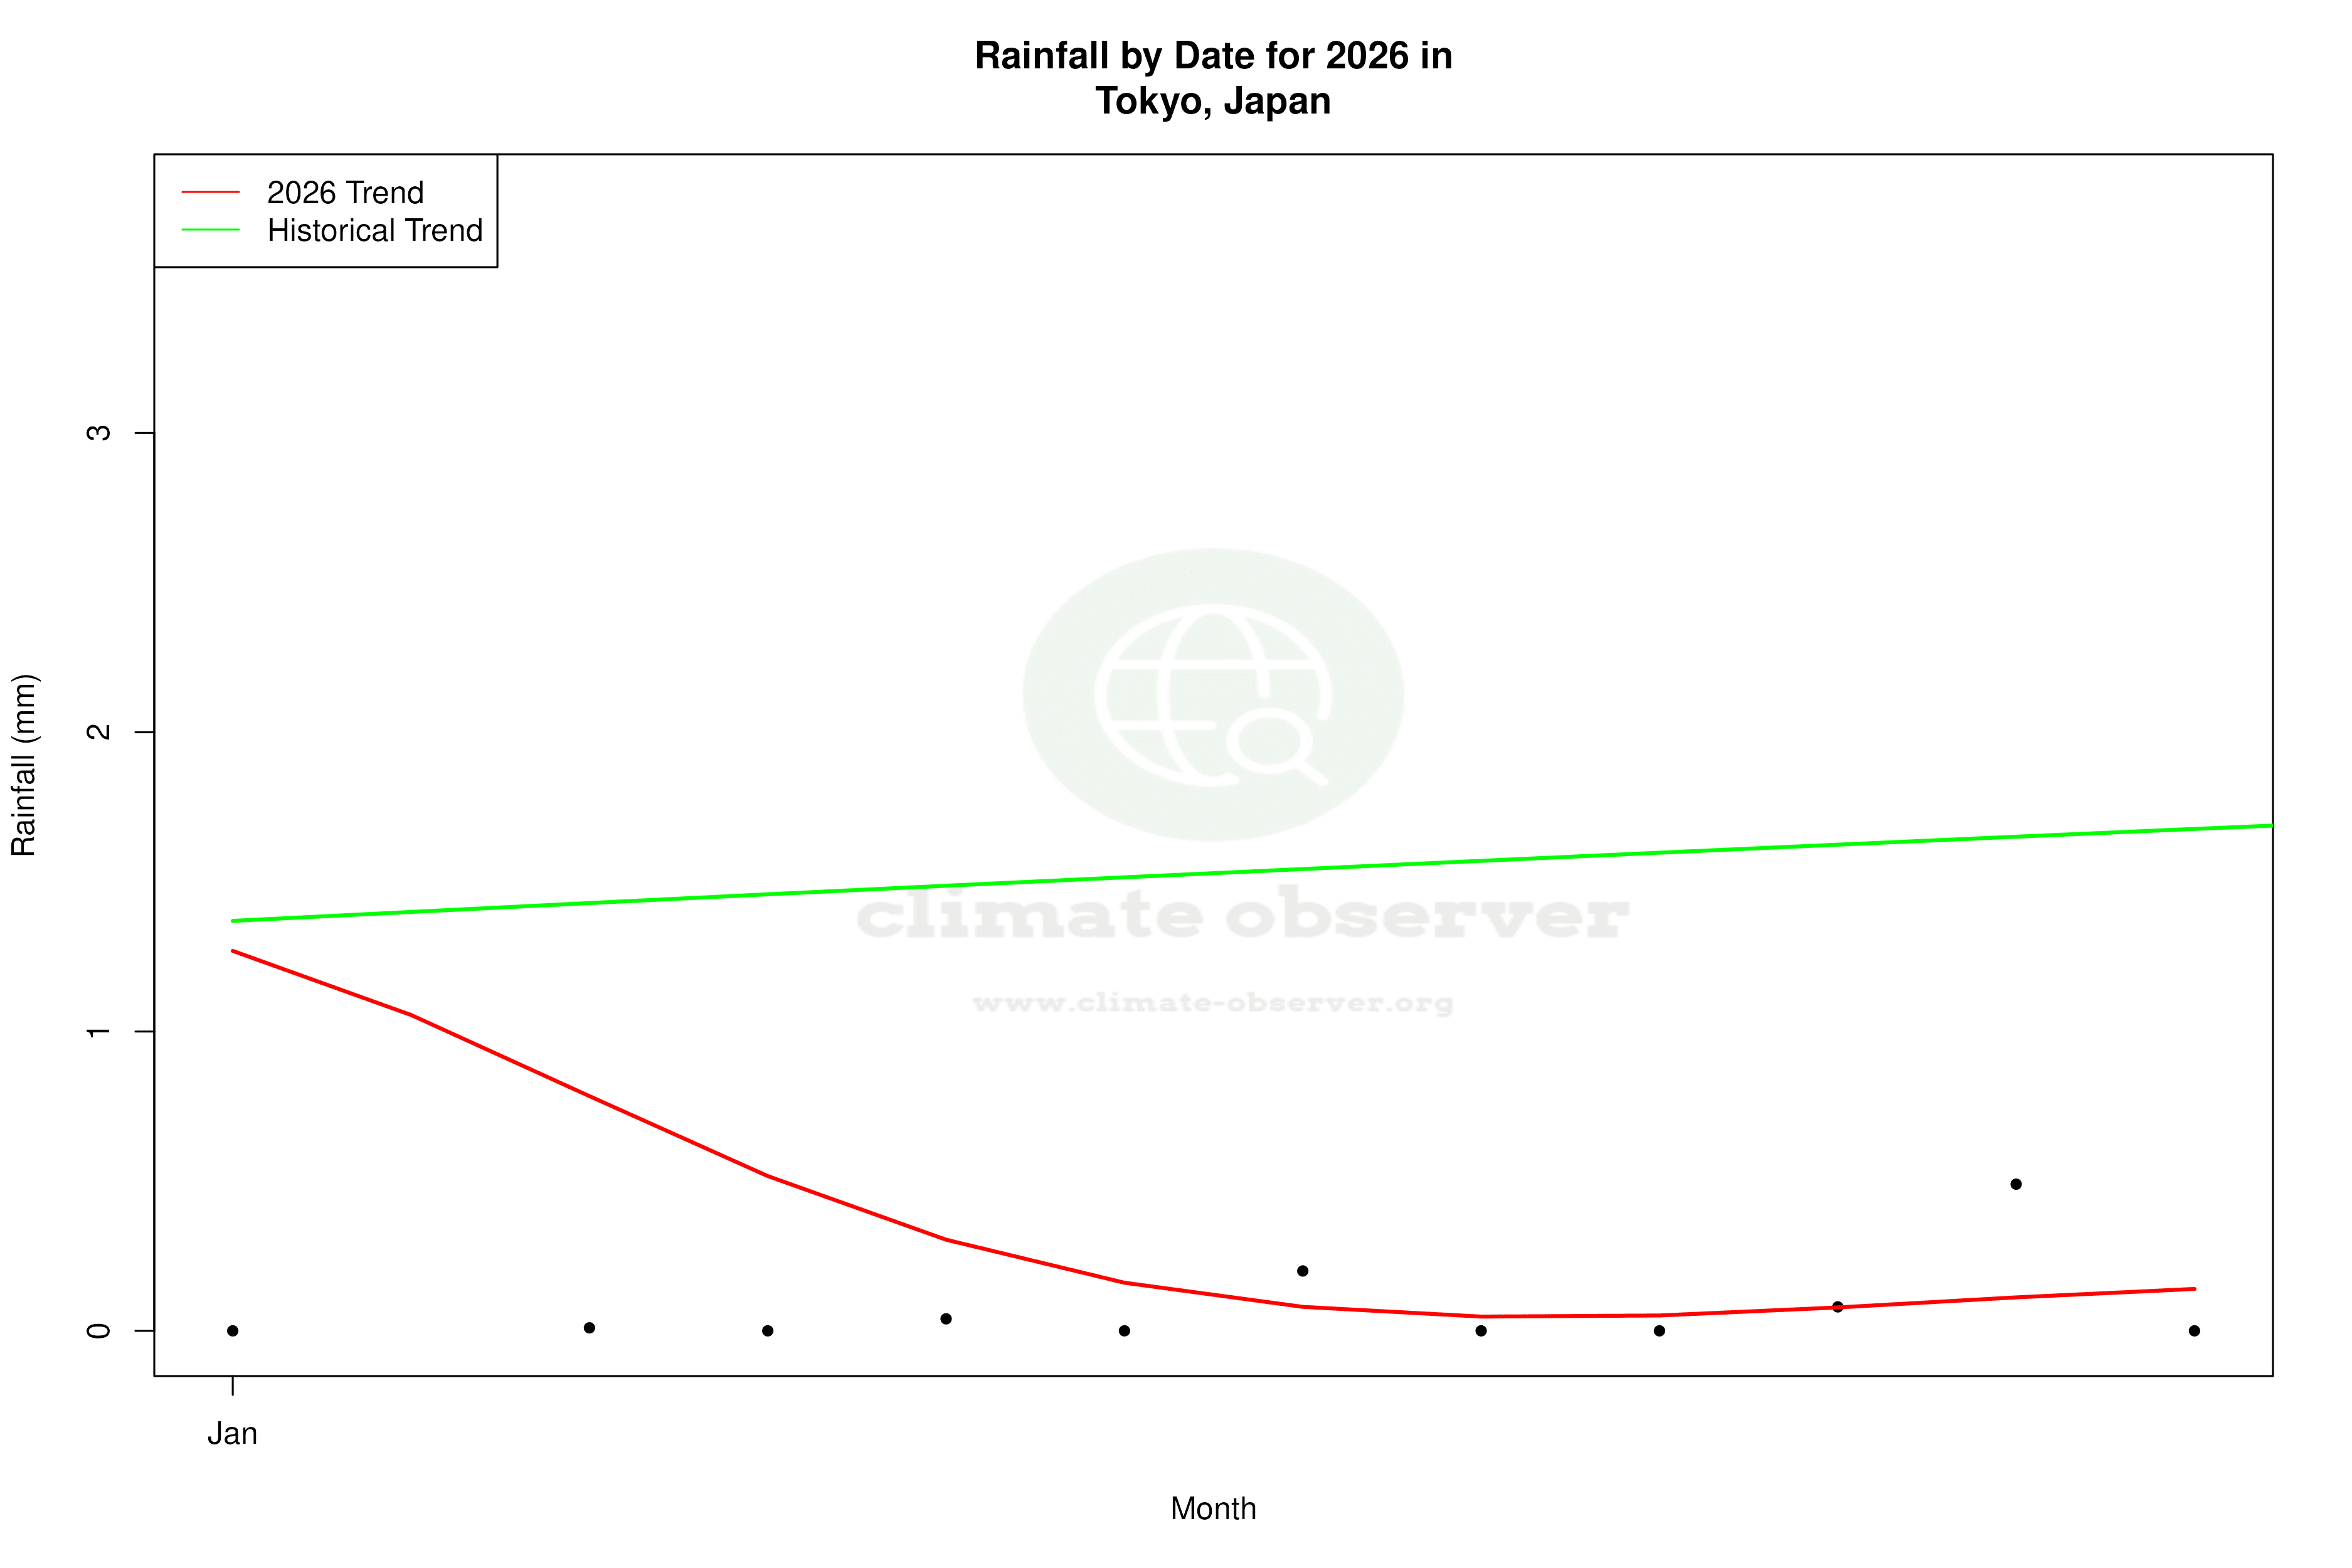
Precipitation Patterns: A Shift Towards Evenness
The Precipitation Concentration Index (PCI) is a measure of how precipitation is distributed over time. Tokyo's PCI has decreased from a baseline of 12.70 to a current value of 11.05. This indicates that precipitation is now more evenly distributed throughout the year, reducing the concentration of rainfall in fewer events. Such a shift can mitigate the risks of flooding and water scarcity, aligning with Japan's climate resilience strategies.
Temperature Extremes
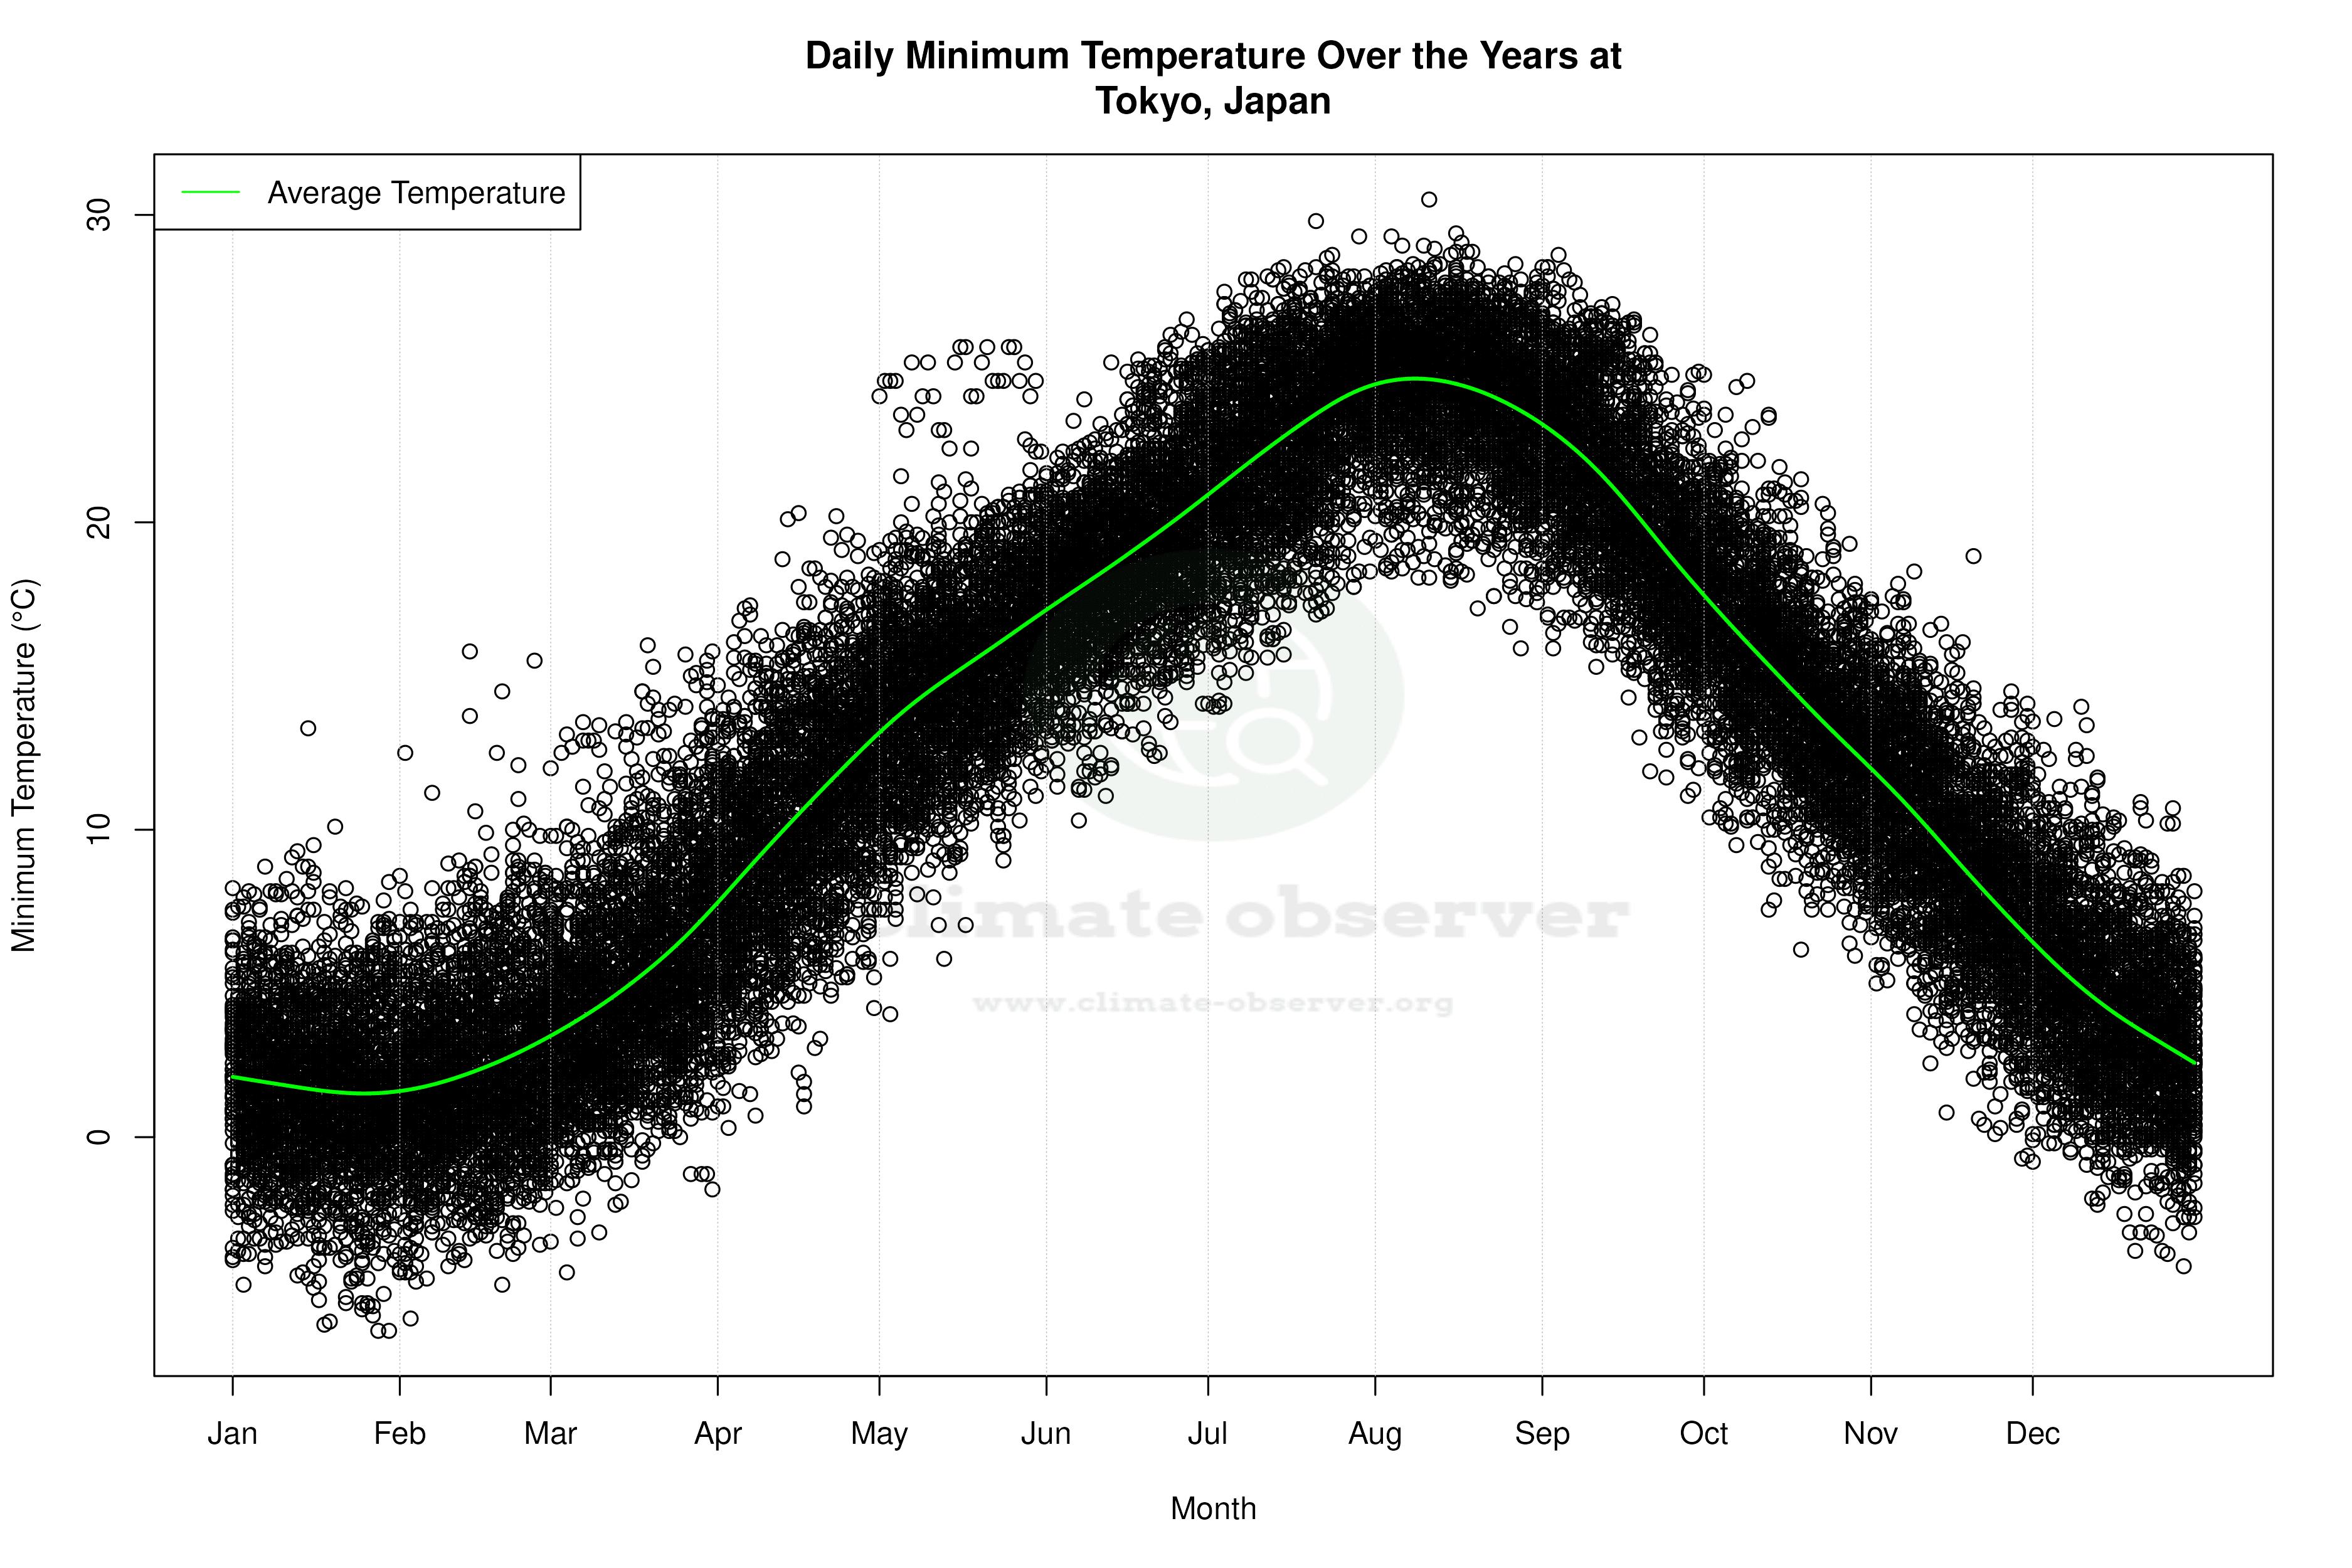
Tokyo has recorded an all-time maximum temperature of 39.5°C (103.1°F) and a minimum of -6.3°C (20.7°F). These extremes underscore the variability inherent in Tokyo's climate, influenced by its proximity to the Pacific Ocean and the surrounding mountainous regions. Such geographic features can moderate temperatures but also contribute to sudden weather changes.
Implications for Climate Policy
Japan's national climate goals focus on reducing greenhouse gas emissions and enhancing climate adaptation measures. Tokyo's warming trends and changing precipitation patterns highlight the urgency of these goals. The city's government has been proactive in implementing green infrastructure and promoting energy efficiency to combat urban heat and improve climate resilience.
Local Climate Dynamics and Future Outlook
Tokyo's climate dynamics are shaped by its geographical location and urban structure. The warming trends observed in both high and low temperatures suggest a need for continued monitoring and adaptation strategies. As the city continues to grow, balancing development with sustainable practices will be crucial in managing the impacts of climate change.
Station Statistics
10-Year Trend
High: +0.97 °C/decade
Low: +1.23 °C/decade
Rain: -0.19 mm/decade
25-Year Trend
High: +0.51 °C/decade
Low: -0.09 °C/decade
Rain: -0.02 mm/decade
50-Year Trend
High: +0.35 °C/decade
Low: +0.25 °C/decade
Rain: +0.13 mm/decade
All-Time Trend
High: +0.19 °C/decade
Low: +0.32 °C/decade
Rain: +0.06 mm/decade
Percentage Above-Average Days
Last 12 Months: 53.2%
This Year: 57.5%
Precipitation Concentration Index (PCI) ℹ️
Last 12 Months: 12.6
Historical Average: 13.1
Percentile Rank of Last 12 Months ℹ️
High: 97th percentile
Low: 96th percentile
Rain: 38th percentile
Change in Variance ℹ️
High: +4.4%
Low: +0.6%
Intraday: +3.2%
Data Coverage
97.8%
First Year of Data
1949
Station Location
Historical Weather Records
| Max High | Avg High | Min High | Max Avg | Avg Avg | Min Avg | Max Low | Avg Low | Min Low | Max Precipitation | Avg Precipitation | Max Snow | Avg Snow | |
|---|---|---|---|---|---|---|---|---|---|---|---|---|---|
| Record | 39.5 °C | — | -0.2 °C | 33.9 °C | — | -1.7 °C | 30.5 °C | — | -6.3 °C | 371.9 mm | — | — | — |
| January | 22.6 °C | 9.7 °C | 0.7 °C | 16.1 °C | 5.5 °C | -0.7 °C | 13.3 °C | 1.6 °C | -6.3 °C | 63.0 mm | 1.7 mm | — | — |
| February | 24.5 °C | 10.3 °C | -0.2 °C | 18.1 °C | 6.2 °C | -1.7 °C | 15.8 °C | 2.2 °C | -5.9 °C | 59.5 mm | 2.1 mm | — | — |
| March | 25.6 °C | 13.4 °C | 2.7 °C | 19.9 °C | 9.2 °C | 0.4 °C | 16.0 °C | 5.1 °C | -4.4 °C | 83.0 mm | 3.7 mm | — | — |
| April | 28.9 °C | 18.7 °C | 4.3 °C | 23.2 °C | 14.5 °C | 3.7 °C | 20.3 °C | 10.4 °C | 0.3 °C | 113.0 mm | 4.4 mm | — | — |
| May | 32.6 °C | 23.1 °C | 9.6 °C | 28.4 °C | 19.0 °C | 8.1 °C | 25.7 °C | 15.2 °C | 4.0 °C | 131.1 mm | 4.6 mm | — | — |
| June | 36.4 °C | 25.5 °C | 12.9 °C | 30.8 °C | 22.0 °C | 12.1 °C | 26.6 °C | 18.9 °C | 10.3 °C | 225.5 mm | 6.0 mm | — | — |
| July | 39.5 °C | 29.4 °C | 16.4 °C | 33.9 °C | 25.8 °C | 15.3 °C | 29.8 °C | 22.9 °C | 14.0 °C | 126.0 mm | 4.6 mm | — | — |
| August | 39.1 °C | 31.1 °C | 19.6 °C | 33.7 °C | 27.3 °C | 18.6 °C | 30.5 °C | 24.3 °C | 15.9 °C | 169.5 mm | 4.7 mm | — | — |
| September | 38.1 °C | 27.1 °C | 15.9 °C | 32.1 °C | 23.6 °C | 14.5 °C | 28.7 °C | 20.7 °C | 11.1 °C | 371.9 mm | 6.8 mm | — | — |
| October | 32.6 °C | 21.6 °C | 11.0 °C | 26.9 °C | 18.0 °C | 8.9 °C | 24.8 °C | 14.8 °C | 5.9 °C | 177.0 mm | 6.2 mm | — | — |
| November | 26.7 °C | 16.8 °C | 5.8 °C | 22.9 °C | 12.9 °C | 1.9 °C | 18.9 °C | 9.3 °C | -0.7 °C | 103.9 mm | 3.1 mm | — | — |
| December | 24.8 °C | 12.1 °C | 2.8 °C | 19.4 °C | 8.0 °C | 0.2 °C | 14.0 °C | 4.2 °C | -4.2 °C | 82.5 mm | 1.7 mm | — | — |
Data Visualisations
Remove WatermarksCurrent Year Climate Trends vs Historical


Max Temperature this Year | 1 of 6
Climate 12-Month Moving Averages


Max Temperature 12-Month MA | 1 of 6
Daily Data Points and Averages Throughout the Year


Average Max Temperature Throughout Year | 1 of 5
