Climate for Station: Saigo, Shimane, Japan
Loading live weather...
Climate Analysis & Overview
Saigo's climate profile reveals a nuanced interplay between warming trends over the long term and recent cooling over the past decade. The region has experienced a more even distribution of precipitation, contributing to a unique local climate dynamic. These trends align with Japan's broader climate goals of achieving a balanced and sustainable environment.
Geographical Influences and Climate Classification
Saigo is situated in the Oki Islands, part of Shimane Prefecture, Japan, and falls under the Köppen climate classification Cfa, which denotes a humid subtropical climate. This classification is characterised by hot, humid summers and mild winters. The island's geography, surrounded by the Sea of Japan, plays a significant role in moderating temperatures and influencing precipitation patterns. The maritime influence ensures that extremes in temperature are somewhat tempered, contributing to the overall climate stability.
Temperature Trends: A Tale of Two Timelines
Over the all-time record, Saigo has experienced a slight warming trend, with high temperatures rising by 0.11°C (0.20°F) and low temperatures increasing more significantly by 0.51°C (0.92°F). This warming aligns with global climate change patterns, suggesting a gradual increase in baseline temperatures. However, the past decade tells a different story, with high temperatures showing a cooling trend of -0.66°C (-1.19°F) and lows decreasing by -0.18°C (-0.33°F). This recent cooling could be attributed to regional climate variability or specific local factors, such as changes in sea surface temperatures or shifts in atmospheric circulation patterns.
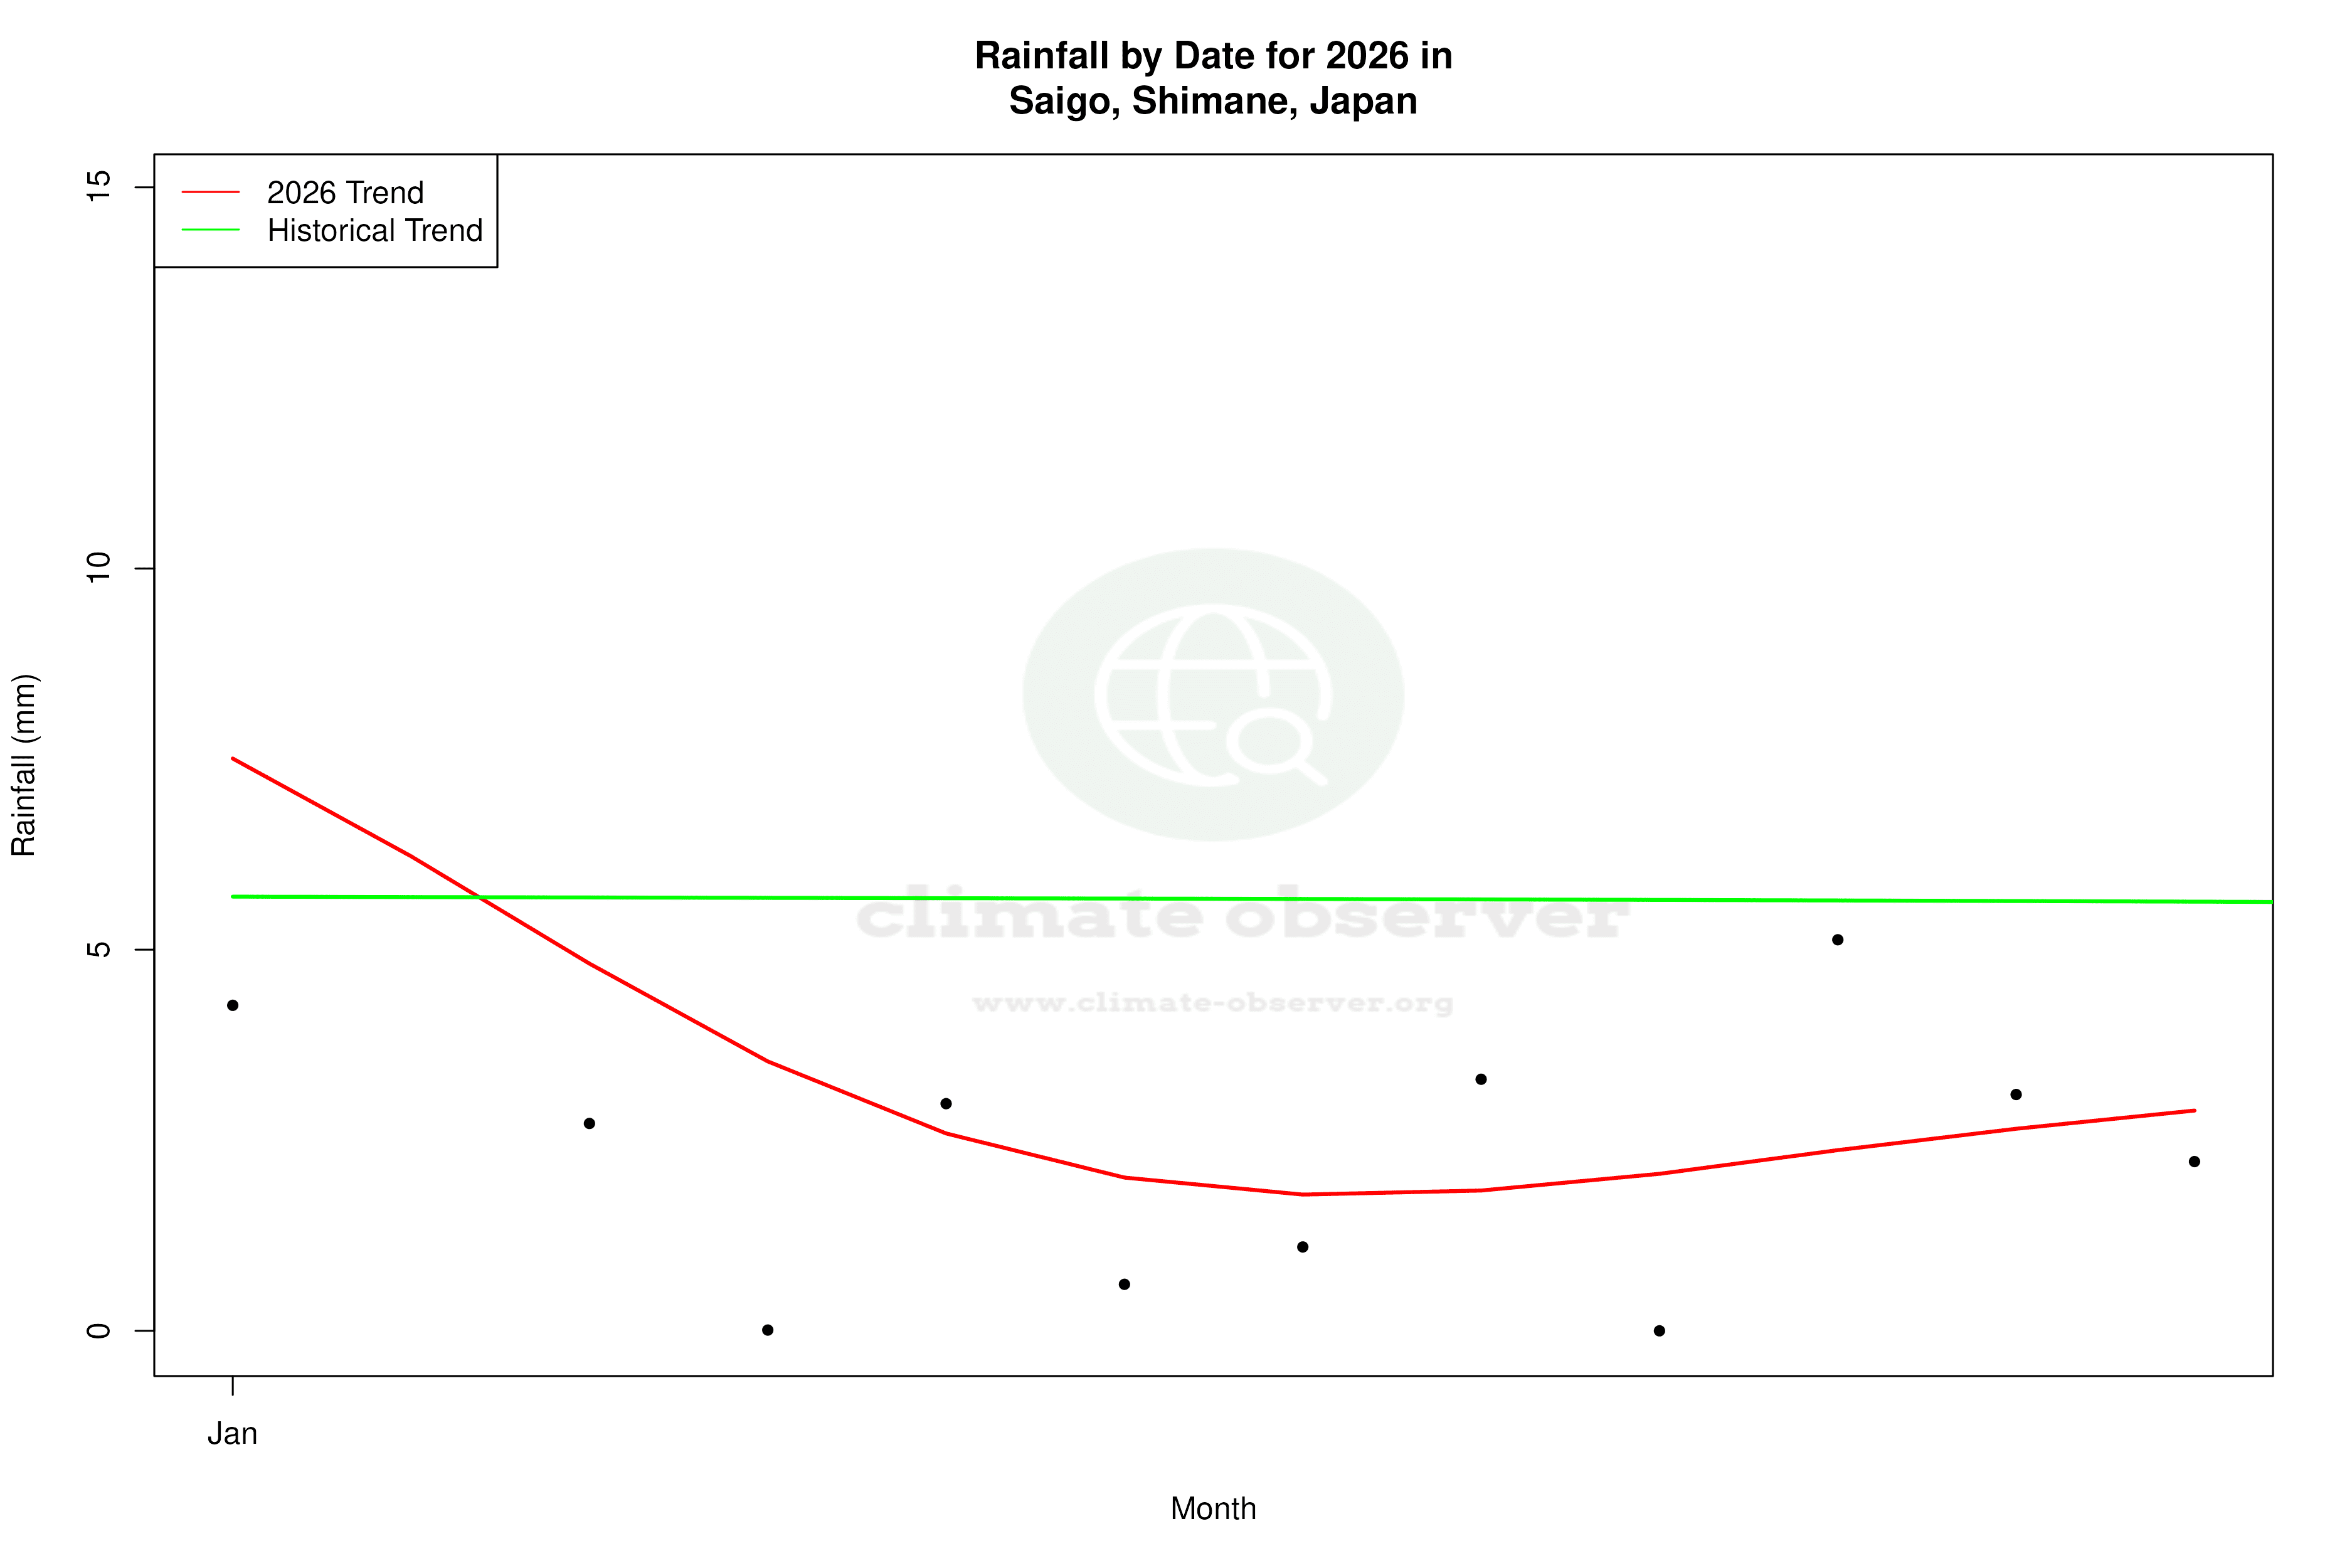
Precipitation Patterns: Towards Even Distribution
The Precipitation Concentration Index (PCI) for Saigo has decreased from a baseline of 11.32 to 9.97, indicating a more even distribution of rainfall events. A PCI below 10 suggests that precipitation is spread more evenly throughout the year, reducing the risk of intense, concentrated rainfall events that can lead to flooding. This shift towards a more balanced precipitation pattern is beneficial for water resource management and aligns with Japan's climate resilience strategies.
Extreme Weather Records
Saigo's climate records highlight the potential for extreme weather events, with an all-time high of 38.8°C (101.8°F) and a low of -9.5°C (14.9°F). These extremes underscore the variability inherent in the region's climate, influenced by both its subtropical classification and maritime location. Such records are critical for understanding potential future climate scenarios and preparing for possible impacts on local ecosystems and human activities.
Aligning with Regional Climate Goals
Japan's commitment to addressing climate change is reflected in its regional climate goals, which aim to reduce greenhouse gas emissions and enhance climate resilience. Saigo's climate trends, particularly the more even distribution of precipitation, support these objectives by promoting sustainable water management and reducing the risks associated with extreme weather events. As Japan continues to implement its climate policies, understanding local climate dynamics, such as those observed in Saigo, will be essential for achieving national and regional environmental targets.
Station Statistics
10-Year Trend
High: -1.17 °C/decade
Low: -0.07 °C/decade
Rain: -1.55 mm/decade
25-Year Trend
High: -0.22 °C/decade
Low: +0.03 °C/decade
Rain: -0.35 mm/decade
50-Year Trend
High: +0.08 °C/decade
Low: +0.75 °C/decade
Rain: -0.05 mm/decade
All-Time Trend
High: +0.10 °C/decade
Low: +0.52 °C/decade
Rain: -0.07 mm/decade
Percentage Above-Average Days
Last 12 Months: 44.4%
This Year: 55.3%
Precipitation Concentration Index (PCI) ℹ️
Last 12 Months: 9.4
Historical Average: 11.8
Percentile Rank of Last 12 Months ℹ️
High: 27th percentile
Low: 90th percentile
Rain: 21st percentile
Change in Variance ℹ️
High: -6.5%
Low: -1.0%
Intraday: -13.8%
Data Coverage
95.5%
First Year of Data
1991
Station Location
Historical Weather Records
| Max High | Avg High | Min High | Max Avg | Avg Avg | Min Avg | Max Low | Avg Low | Min Low | Max Precipitation | Avg Precipitation | Max Snow | Avg Snow | |
|---|---|---|---|---|---|---|---|---|---|---|---|---|---|
| Record | 38.8 °C | — | -3.5 °C | 30.8 °C | — | -6.2 °C | 29.0 °C | — | -9.5 °C | 203.5 mm | — | — | — |
| January | 17.2 °C | 7.5 °C | -1.7 °C | 15.2 °C | 4.3 °C | -3.7 °C | 13.0 °C | 1.9 °C | -5.7 °C | 66.0 mm | 5.5 mm | — | — |
| February | 20.1 °C | 7.9 °C | -3.5 °C | 17.2 °C | 4.4 °C | -6.2 °C | 14.0 °C | 1.6 °C | -9.5 °C | 65.0 mm | 4.3 mm | — | — |
| March | 22.5 °C | 11.0 °C | -1.3 °C | 18.3 °C | 7.2 °C | -3.6 °C | 14.2 °C | 3.4 °C | -6.7 °C | 96.0 mm | 3.9 mm | — | — |
| April | 26.8 °C | 16.1 °C | 5.2 °C | 20.9 °C | 12.1 °C | 1.8 °C | 18.4 °C | 7.6 °C | -3.2 °C | 120.9 mm | 4.2 mm | — | — |
| May | 31.0 °C | 20.5 °C | 11.5 °C | 24.7 °C | 16.5 °C | 7.2 °C | 20.7 °C | 12.2 °C | 1.4 °C | 122.9 mm | 4.2 mm | — | — |
| June | 32.2 °C | 23.6 °C | 14.6 °C | 28.4 °C | 20.2 °C | 12.4 °C | 24.6 °C | 16.9 °C | 6.8 °C | 177.0 mm | 5.6 mm | — | — |
| July | 34.9 °C | 27.5 °C | 19.4 °C | 30.1 °C | 24.5 °C | 16.8 °C | 27.7 °C | 21.8 °C | 11.5 °C | 203.5 mm | 6.8 mm | — | — |
| August | 38.8 °C | 29.4 °C | 21.2 °C | 30.8 °C | 26.0 °C | 19.0 °C | 28.9 °C | 23.2 °C | 13.5 °C | 140.5 mm | 4.7 mm | — | — |
| September | 33.9 °C | 25.6 °C | 17.7 °C | 29.9 °C | 22.1 °C | 12.8 °C | 29.0 °C | 19.3 °C | 7.3 °C | 191.0 mm | 7.1 mm | — | — |
| October | 30.0 °C | 20.7 °C | 10.9 °C | 25.2 °C | 16.6 °C | 5.8 °C | 23.7 °C | 13.4 °C | 2.8 °C | 124.8 mm | 4.0 mm | — | — |
| November | 24.1 °C | 15.7 °C | 3.9 °C | 21.4 °C | 11.8 °C | 2.5 °C | 20.2 °C | 8.7 °C | -1.5 °C | 62.1 mm | 4.5 mm | — | — |
| December | 20.1 °C | 10.6 °C | -0.5 °C | 17.7 °C | 7.1 °C | -2.3 °C | 15.7 °C | 4.4 °C | -4.5 °C | 82.0 mm | 5.1 mm | — | — |
Data Visualisations
Remove WatermarksCurrent Year Climate Trends vs Historical


Max Temperature this Year | 1 of 6
Climate 12-Month Moving Averages
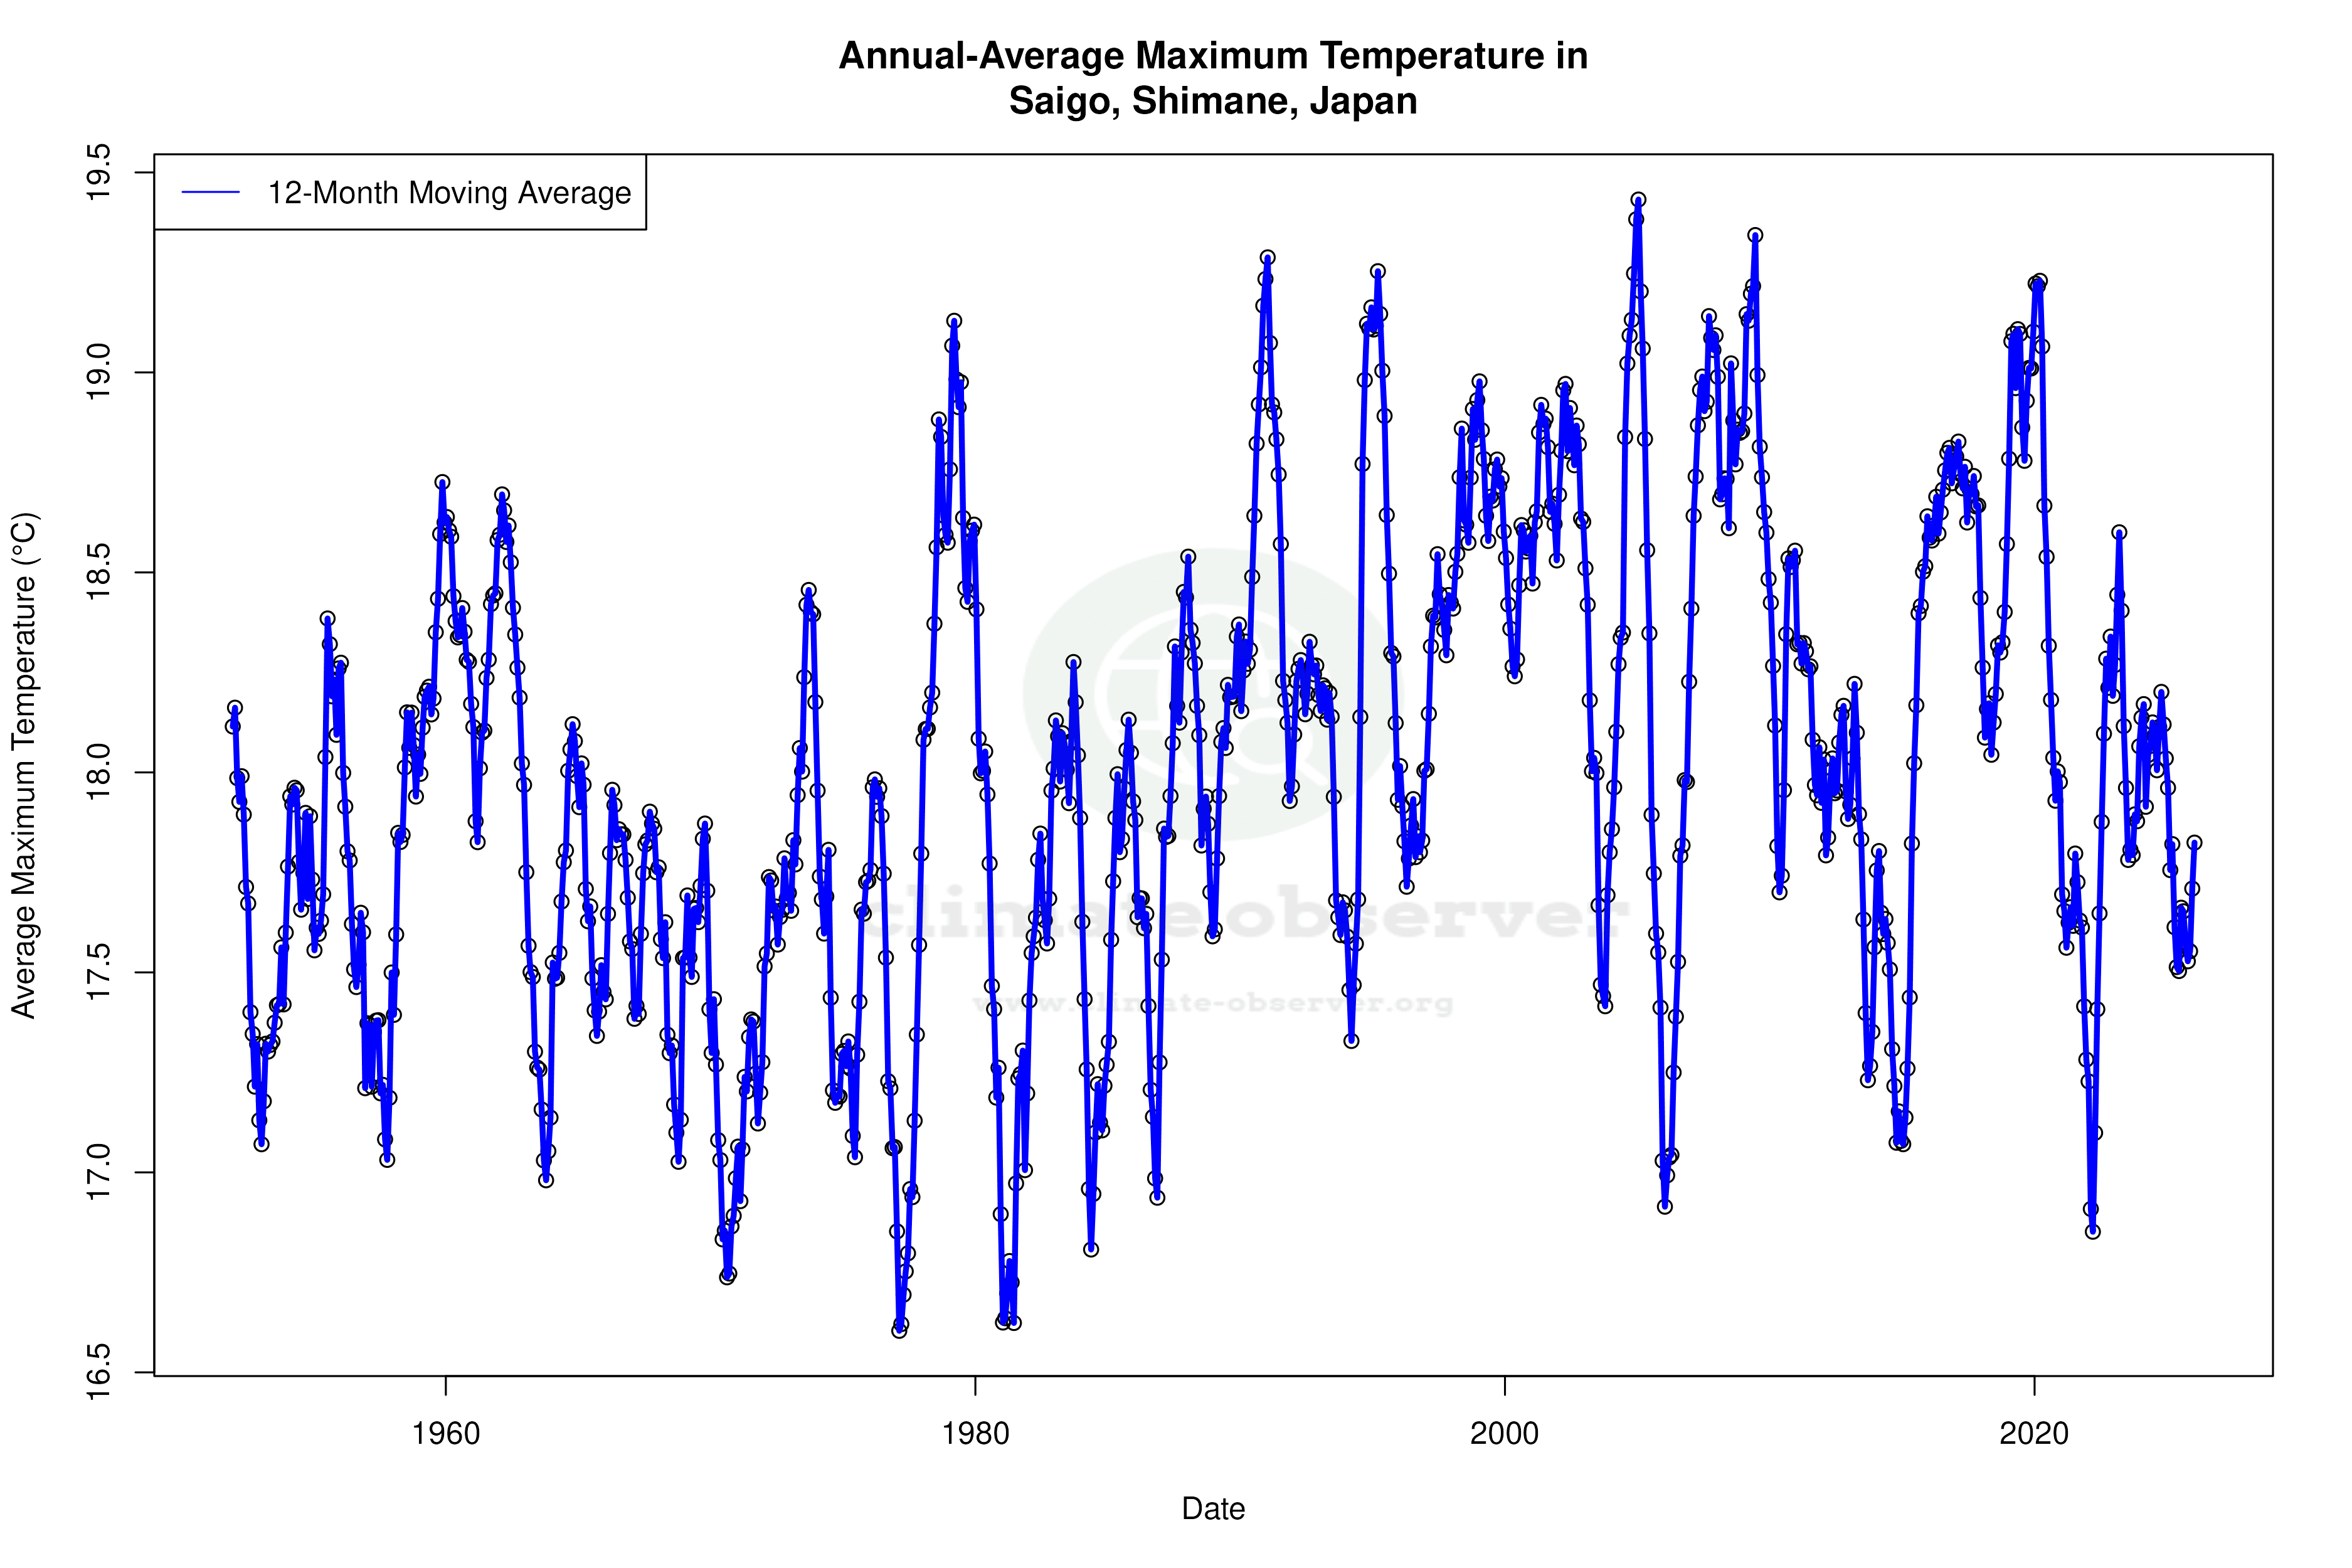


Max Temperature 12-Month MA | 1 of 6
Daily Data Points and Averages Throughout the Year


Average Max Temperature Throughout Year | 1 of 5
