Climate for Station: King Hussein, Mafraq Governorate, Jordan
Loading live weather...
Climate Analysis & Overview
Over the past decade, King Hussein Air Base has experienced a notable warming trend, with both high and low temperatures rising. This warming aligns with Jordan's broader climate patterns, emphasizing the need for adaptive strategies. Precipitation patterns have also become slightly more concentrated, indicating potential shifts in rainfall distribution.
Warming Trends in the Desert Climate
Located at 32.356°N, 36.259°E, King Hussein Air Base is situated in a region characterized by a hot desert climate, classified as BWh under the Köppen system. This climate type is marked by extreme temperature variations and minimal precipitation. Over the past decade, the base has seen a warming trend, with high temperatures increasing by 0.28°C (0.50°F) and low temperatures rising by 0.51°C (0.92°F). This trend is consistent with broader regional climate changes, where warming is more pronounced in recent years. All-time data further supports this, showing a warming of 0.41°C (0.74°F) for highs and 0.31°C (0.56°F) for lows, underscoring a persistent rise in temperatures.
Extreme Temperature Records
The air base has recorded some of the most extreme temperatures in the region, with a maximum of 45.0°C (113.0°F) and a minimum of -9.0°C (15.8°F). These extremes reflect the harsh desert environment, where daytime temperatures can soar, and nights can be surprisingly cold. Such variability poses challenges for both local ecosystems and human activities, requiring robust measures to mitigate heat stress and cold snaps.
Precipitation Patterns and Concentration
The Precipitation Concentration Index (PCI) has shown a slight increase from a baseline of 23.19 to a current value of 24.15. This metric indicates that rainfall is becoming slightly more concentrated in fewer events, a common trend in desert climates where intense, sporadic rainfalls are interspersed with prolonged dry periods. Understanding PCI helps in planning for water resource management, crucial for a country like Jordan, where water scarcity is a significant concern.
Regional Implications and Climate Goals
Jordan is actively pursuing climate adaptation strategies, with a focus on managing water resources and enhancing resilience to temperature extremes. The trends observed at King Hussein Air Base highlight the importance of these efforts. As temperatures continue to rise and precipitation becomes more erratic, the need for effective climate policies becomes increasingly urgent. Recent weather events, such as heatwaves, further emphasize the reality of climate change impacts in the region.
Geographical Influences on Climate Data
The base's geographical location, surrounded by arid landscapes and distant from major water bodies, influences its climate profile. The lack of moderating influences from oceans or large lakes contributes to the pronounced temperature extremes. This isolation accentuates the importance of localised climate data in informing regional climate strategies and ensuring sustainable development in the face of ongoing environmental changes.
Station Statistics
10-Year Trend
High: +0.25 °C/decade
Low: +0.66 °C/decade
Rain: -0.19 mm/decade
25-Year Trend
High: +0.41 °C/decade
Low: +0.62 °C/decade
Rain: +0.02 mm/decade
50-Year Trend
High: +0.44 °C/decade
Low: +0.43 °C/decade
Rain: -0.01 mm/decade
All-Time Trend
High: +0.40 °C/decade
Low: +0.31 °C/decade
Rain: -0.01 mm/decade
Percentage Above-Average Days
Last 12 Months: 55.6%
This Year: 44.4%
Precipitation Concentration Index (PCI) ℹ️
Last 12 Months: 22.4
Historical Average: 22.6
Percentile Rank of Last 12 Months ℹ️
High: 79th percentile
Low: 91st percentile
Rain: 25th percentile
Change in Variance ℹ️
High: -4.9%
Low: +0.3%
Intraday: -5.4%
Data Coverage
66.7%
First Year of Data
1953
Station Location
Historical Weather Records
| Max High | Avg High | Min High | Max Avg | Avg Avg | Min Avg | Max Low | Avg Low | Min Low | Max Precipitation | Avg Precipitation | Max Snow | Avg Snow | |
|---|---|---|---|---|---|---|---|---|---|---|---|---|---|
| Record | 45.0 °C | — | 2.0 °C | 37.1 °C | — | -1.4 °C | 28.4 °C | — | -9.0 °C | 41.0 mm | — | — | — |
| January | 23.9 °C | 13.4 °C | 2.7 °C | 16.7 °C | 7.9 °C | -1.1 °C | 10.8 °C | 2.6 °C | -7.6 °C | 39.9 mm | 1.4 mm | — | — |
| February | 27.2 °C | 14.9 °C | 2.0 °C | 21.6 °C | 9.2 °C | -1.4 °C | 14.0 °C | 3.4 °C | -6.6 °C | 29.0 mm | 1.3 mm | — | — |
| March | 33.6 °C | 18.7 °C | 5.5 °C | 25.3 °C | 12.3 °C | 1.7 °C | 17.0 °C | 5.6 °C | -3.8 °C | 41.0 mm | 1.0 mm | — | — |
| April | 37.4 °C | 24.6 °C | 9.0 °C | 31.1 °C | 17.0 °C | 3.7 °C | 20.3 °C | 9.0 °C | -5.5 °C | 20.2 mm | 0.3 mm | — | — |
| May | 41.5 °C | 29.4 °C | 14.5 °C | 33.9 °C | 21.4 °C | 11.0 °C | 25.8 °C | 12.5 °C | 1.3 °C | 15.9 mm | 0.1 mm | — | — |
| June | 43.0 °C | 32.6 °C | 22.2 °C | 36.1 °C | 24.3 °C | 15.0 °C | 23.9 °C | 15.1 °C | 7.0 °C | 9.0 mm | 0.0 mm | — | — |
| July | 44.7 °C | 34.3 °C | 27.4 °C | 37.1 °C | 25.9 °C | 18.5 °C | 26.0 °C | 17.1 °C | 9.1 °C | 8.9 mm | 0.0 mm | — | — |
| August | 45.0 °C | 34.3 °C | 27.5 °C | 36.9 °C | 25.9 °C | 18.8 °C | 28.4 °C | 17.6 °C | 8.3 °C | 4.3 mm | 0.0 mm | — | — |
| September | 43.5 °C | 32.2 °C | 23.0 °C | 34.3 °C | 23.9 °C | 16.8 °C | 28.0 °C | 15.8 °C | 4.6 °C | 4.1 mm | 0.0 mm | — | — |
| October | 38.2 °C | 27.9 °C | 14.0 °C | 31.1 °C | 20.3 °C | 10.7 °C | 23.0 °C | 12.7 °C | 0.9 °C | 17.4 mm | 0.2 mm | — | — |
| November | 31.2 °C | 20.8 °C | 8.0 °C | 24.3 °C | 14.2 °C | 3.6 °C | 18.4 °C | 7.8 °C | -4.0 °C | 24.9 mm | 0.7 mm | — | — |
| December | 26.7 °C | 15.4 °C | 4.0 °C | 17.6 °C | 9.4 °C | -0.6 °C | 13.3 °C | 4.0 °C | -9.0 °C | 26.4 mm | 1.1 mm | — | — |
Data Visualisations
Remove WatermarksCurrent Year Climate Trends vs Historical


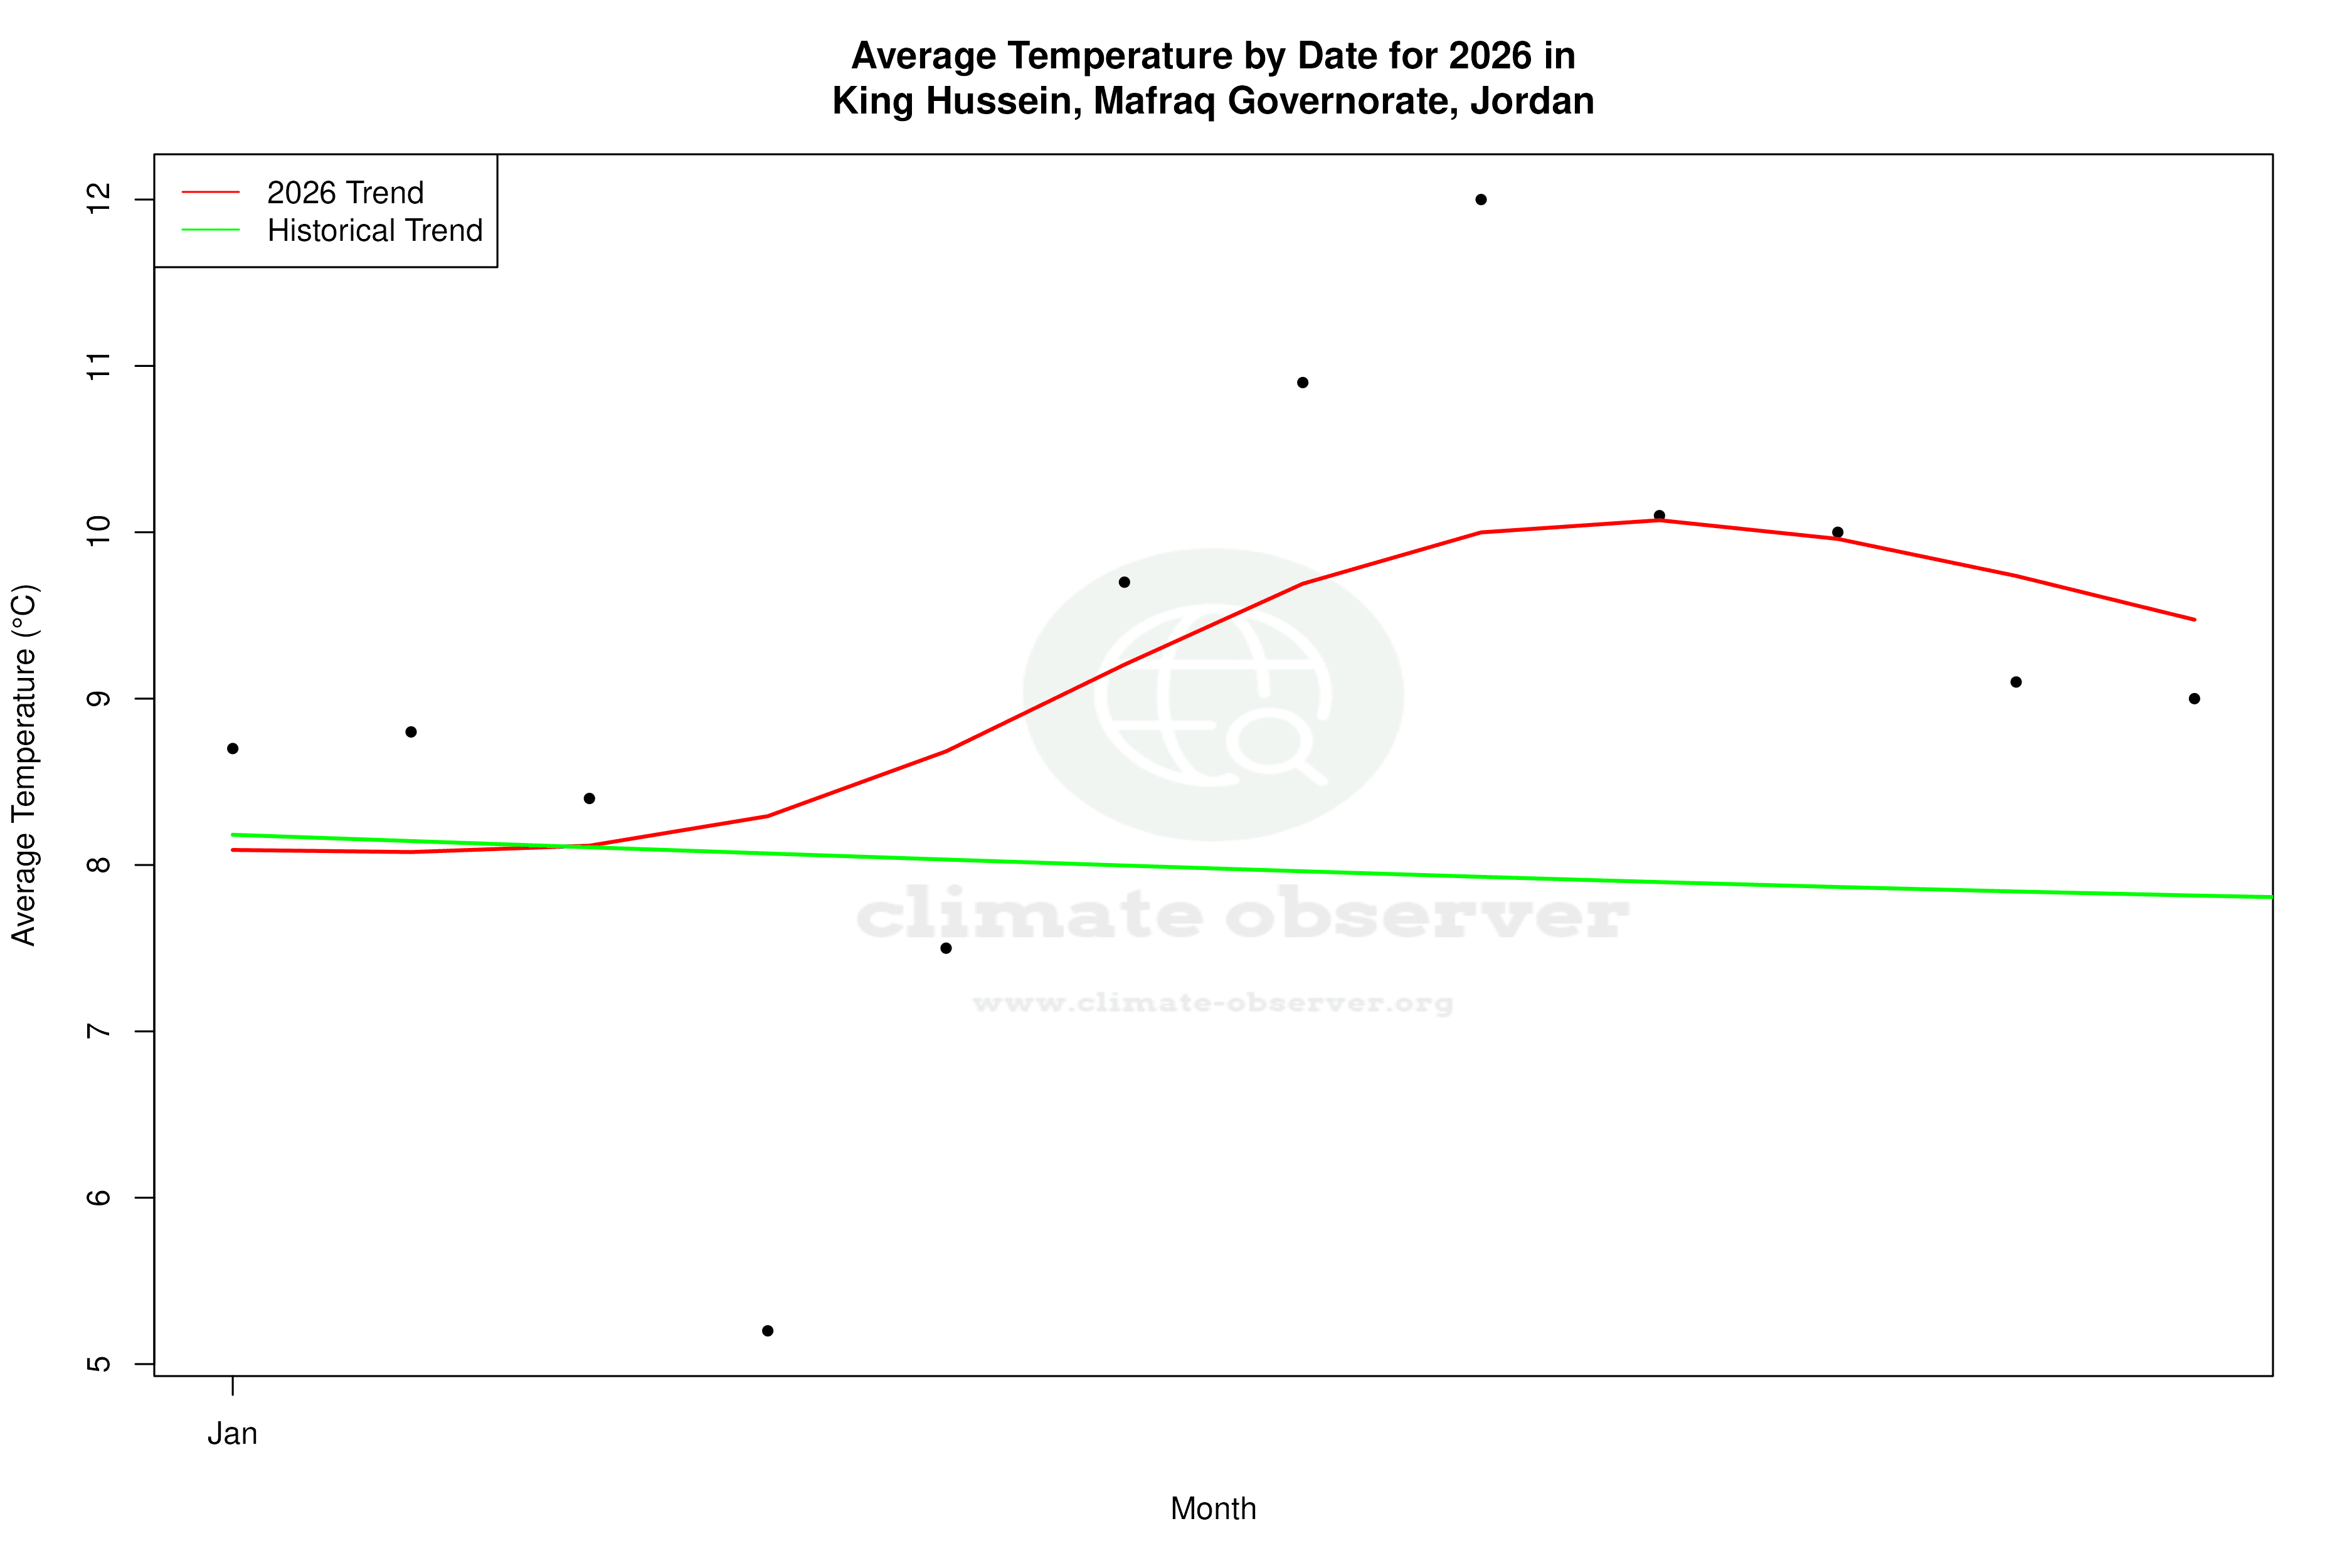
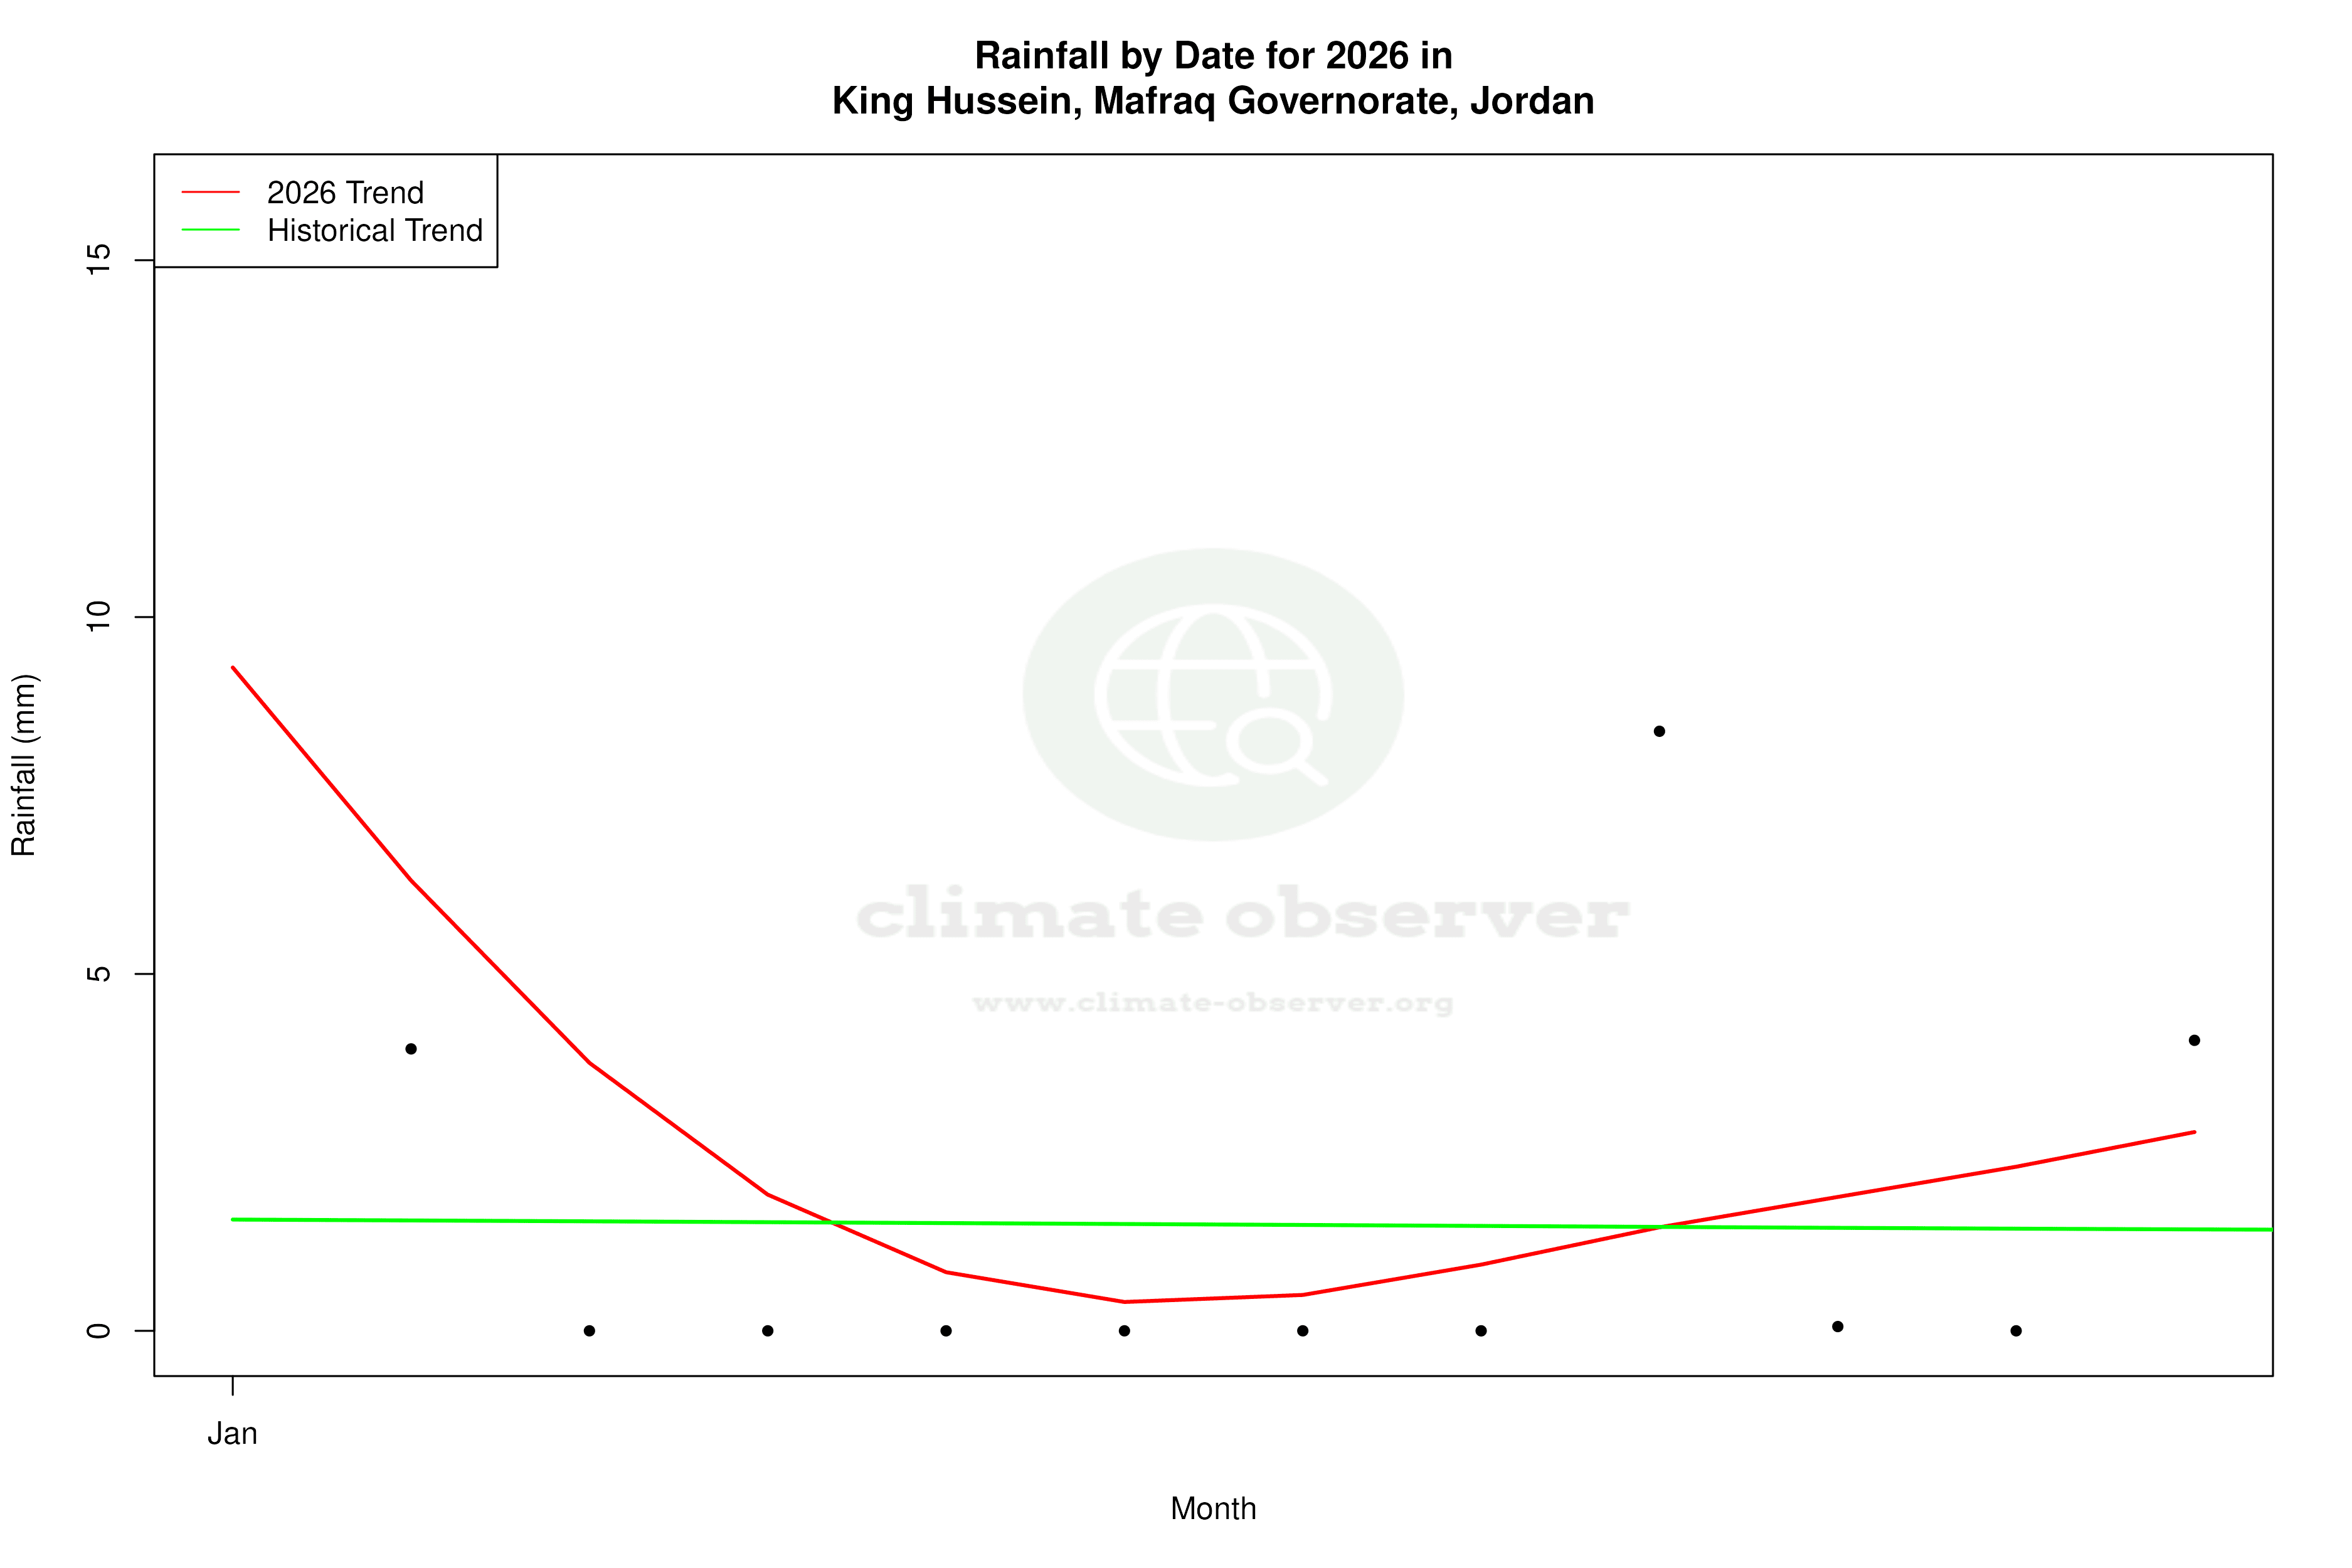


Max Temperature this Year | 1 of 6
Climate 12-Month Moving Averages


Max Temperature 12-Month MA | 1 of 6
Daily Data Points and Averages Throughout the Year


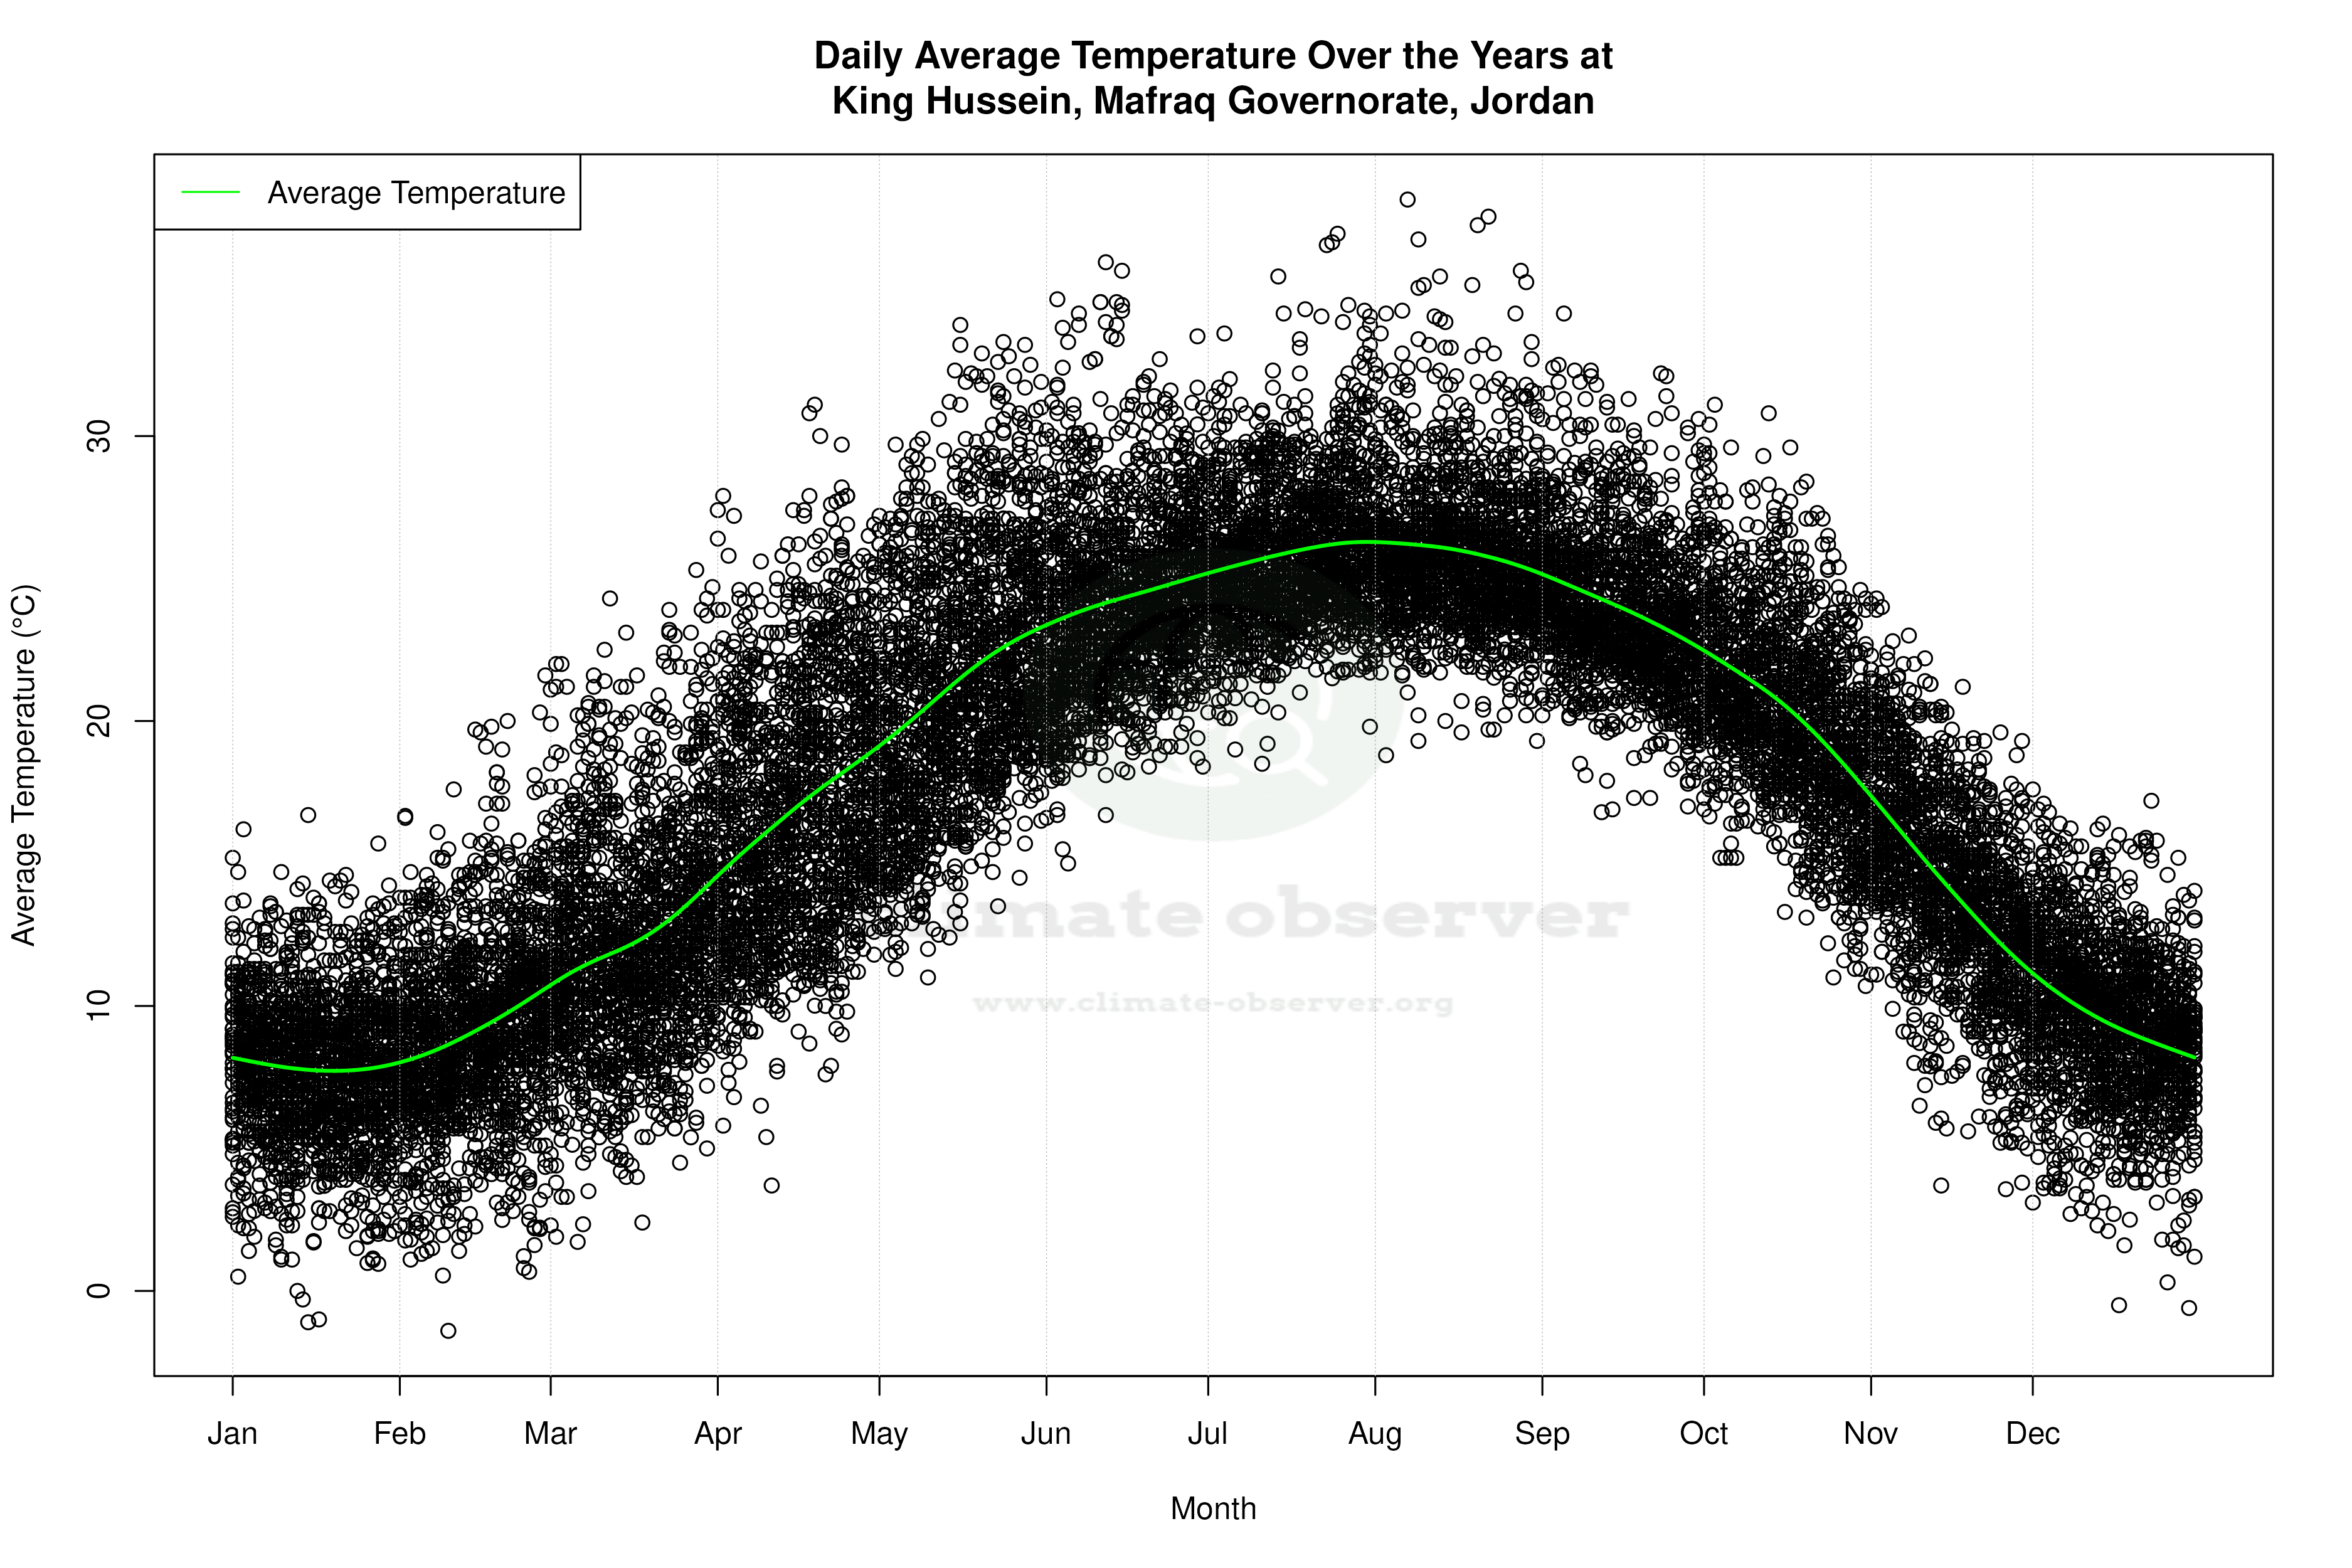


Average Max Temperature Throughout Year | 1 of 5
