Climate for Station: Lodwar, Turkana County, Kenya
Loading live weather...
Climate Analysis & Overview
Lodwar, located in Kenya's Turkana region, is experiencing a nuanced climate shift. While long-term trends show a slight warming, recent years indicate a cooling of daytime highs. The precipitation pattern has become marginally more even, reflecting subtle changes in local climate dynamics.
Köppen Climate and Local Geography
Lodwar is classified under the BSh category of the Köppen climate classification, indicating a semi-arid climate. The region is characterised by its proximity to Lake Turkana and the surrounding arid landscapes. These geographical features significantly influence the local climate, contributing to high temperatures and limited precipitation. The area's climate is shaped by the Intertropical Convergence Zone (ITCZ) and its seasonal movements, affecting rainfall distribution and temperature patterns.
Temperature Trends and Variability
The all-time temperature trends for Lodwar reveal a slight warming. The highs have increased by 0.10°C (0.18°F), while the lows have risen by 0.22°C (0.40°F). This suggests a gradual warming over the long term. However, the last decade shows a contrasting pattern, with daytime highs experiencing a cooling trend, decreasing by 0.44°C (0.79°F). Conversely, nighttime lows have shown a more pronounced warming, increasing by 0.62°C (1.12°F). This divergence between long-term and recent trends highlights the complexity of climate dynamics in the region.
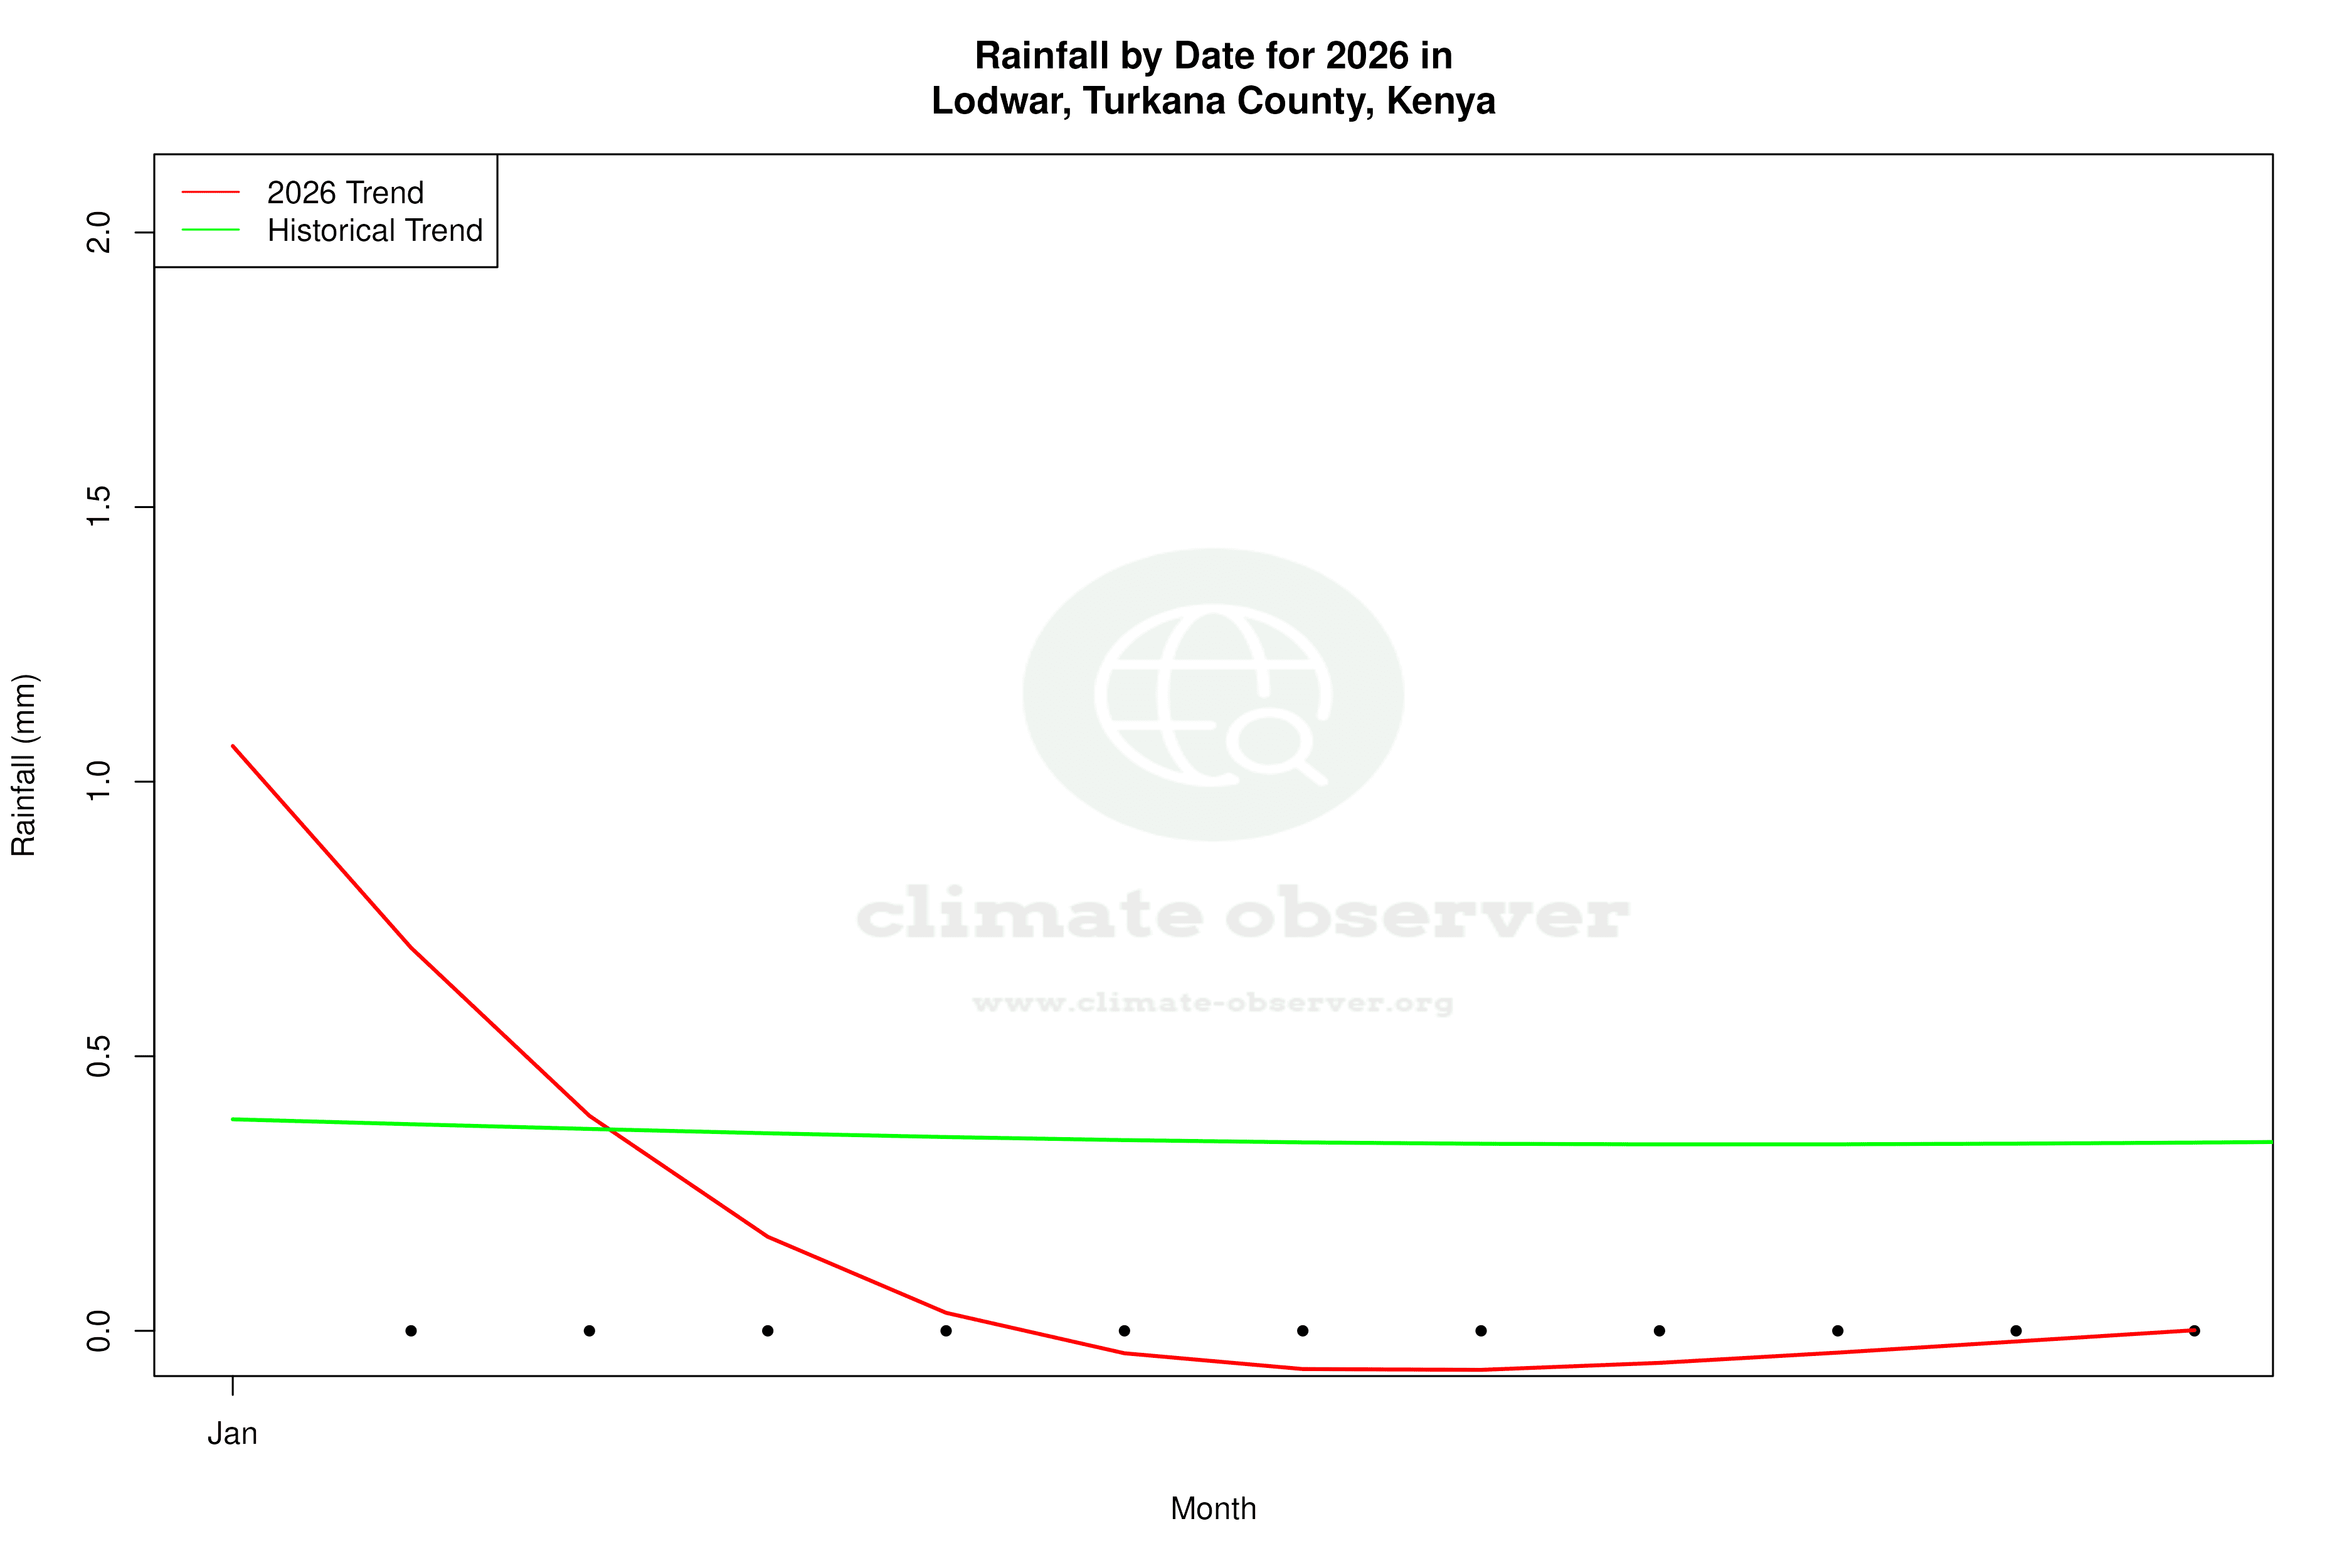
Precipitation Patterns and PCI Analysis
The Precipitation Concentration Index (PCI) for Lodwar has shown a slight decrease from a baseline of 18.55 to a current value of 18.28. The PCI measures how precipitation is distributed over time, with lower values indicating more evenly spread rainfall. This marginal change suggests that rainfall events have become slightly more evenly distributed, although the region remains prone to concentrated rainfall events. Such changes could affect water availability and agricultural practices in the area.
Extreme Temperature Records
Lodwar has recorded a maximum temperature of 40.83°C (105.49°F) and a minimum of 12.60°C (54.68°F). These extremes underscore the variability and harshness of the local climate, influenced by its semi-arid nature. The high temperatures are typical for the region, driven by intense solar radiation and limited cloud cover.
Regional Climate Goals and Implications
Kenya has been actively pursuing climate resilience and adaptation strategies, focusing on sustainable water management and agricultural practices. The subtle shifts in Lodwar's climate, including the recent cooling of daytime highs and more evenly distributed rainfall, could offer insights for regional planning. Understanding these trends is crucial for developing strategies that align with national climate goals, ensuring the resilience of local communities against future climate variability.
Station Statistics
10-Year Trend
High: -0.45 °C/decade
Low: +0.72 °C/decade
Rain: +1.12 mm/decade
25-Year Trend
High: +0.04 °C/decade
Low: +0.41 °C/decade
Rain: +0.14 mm/decade
50-Year Trend
High: +0.09 °C/decade
Low: +0.22 °C/decade
Rain: +0.17 mm/decade
All-Time Trend
High: +0.09 °C/decade
Low: +0.22 °C/decade
Rain: +0.17 mm/decade
Percentage Above-Average Days
Last 12 Months: 39.2%
This Year: 35.3%
Precipitation Concentration Index (PCI) ℹ️
Last 12 Months: 17.5
Historical Average: 20.5
Percentile Rank of Last 12 Months ℹ️
High: 35th percentile
Low: 89th percentile
Rain: 92nd percentile
Change in Variance ℹ️
High: +11.5%
Low: +6.1%
Intraday: +4.5%
Data Coverage
71.3%
First Year of Data
1957
Station Location
Historical Weather Records
| Max High | Avg High | Min High | Max Avg | Avg Avg | Min Avg | Max Low | Avg Low | Min Low | Max Precipitation | Avg Precipitation | Max Snow | Avg Snow | |
|---|---|---|---|---|---|---|---|---|---|---|---|---|---|
| Record | 40.8 °C | — | 24.4 °C | 36.7 °C | — | 21.7 °C | 30.7 °C | — | 12.6 °C | 132.8 mm | — | — | — |
| January | 39.8 °C | 36.1 °C | 24.5 °C | 34.3 °C | 30.0 °C | 21.7 °C | 28.0 °C | 22.2 °C | 15.0 °C | 32.0 mm | 0.3 mm | — | — |
| February | 40.1 °C | 37.2 °C | 27.4 °C | 35.5 °C | 30.8 °C | 22.5 °C | 29.0 °C | 23.3 °C | 12.6 °C | 32.8 mm | 0.2 mm | — | — |
| March | 40.8 °C | 37.0 °C | 28.5 °C | 36.5 °C | 31.0 °C | 22.1 °C | 30.7 °C | 24.3 °C | 15.2 °C | 45.0 mm | 1.0 mm | — | — |
| April | 40.7 °C | 35.5 °C | 25.6 °C | 36.7 °C | 30.3 °C | 22.5 °C | 29.6 °C | 24.5 °C | 14.3 °C | 56.9 mm | 2.1 mm | — | — |
| May | 39.0 °C | 35.3 °C | 25.6 °C | 34.4 °C | 30.2 °C | 23.5 °C | 29.0 °C | 24.7 °C | 18.0 °C | 42.7 mm | 1.2 mm | — | — |
| June | 37.8 °C | 34.5 °C | 25.0 °C | 33.8 °C | 29.6 °C | 23.7 °C | 28.0 °C | 24.2 °C | 18.2 °C | 17.0 mm | 0.3 mm | — | — |
| July | 38.3 °C | 33.7 °C | 26.9 °C | 32.8 °C | 28.9 °C | 23.1 °C | 27.8 °C | 24.0 °C | 19.0 °C | 22.1 mm | 0.5 mm | — | — |
| August | 39.0 °C | 34.3 °C | 24.4 °C | 35.0 °C | 29.3 °C | 23.8 °C | 27.0 °C | 24.0 °C | 19.2 °C | 51.9 mm | 0.6 mm | — | — |
| September | 39.0 °C | 35.6 °C | 28.4 °C | 34.6 °C | 30.3 °C | 24.7 °C | 28.3 °C | 24.6 °C | 19.2 °C | 13.9 mm | 0.2 mm | — | — |
| October | 39.0 °C | 35.9 °C | 27.2 °C | 34.3 °C | 30.7 °C | 24.7 °C | 28.5 °C | 25.1 °C | 19.0 °C | 59.9 mm | 0.6 mm | — | — |
| November | 39.9 °C | 35.2 °C | 25.6 °C | 34.6 °C | 29.9 °C | 22.1 °C | 28.9 °C | 23.9 °C | 13.5 °C | 43.9 mm | 1.1 mm | — | — |
| December | 39.3 °C | 35.3 °C | 25.0 °C | 34.7 °C | 29.5 °C | 21.9 °C | 29.0 °C | 22.6 °C | 14.5 °C | 132.8 mm | 0.6 mm | — | — |
Data Visualisations
Remove WatermarksCurrent Year Climate Trends vs Historical


Max Temperature this Year | 1 of 6
Climate 12-Month Moving Averages


Max Temperature 12-Month MA | 1 of 6
Daily Data Points and Averages Throughout the Year


Average Max Temperature Throughout Year | 1 of 5
