Climate for Station: Mombasa, Mombasa County, Kenya
Loading live weather...
Climate Analysis & Overview
Mombasa's climate is experiencing a noticeable warming trend, with both high and low temperatures rising over the past decade. The increase in the Precipitation Concentration Index suggests rainfall is becoming more concentrated, potentially impacting local agriculture and infrastructure.
Coastal Climate Dynamics
Mombasa, located on the southeastern coast of Kenya, falls under the Köppen climate classification of Aw, which denotes a tropical savanna climate with a distinct wet and dry season. The city's proximity to the Indian Ocean significantly influences its weather patterns, contributing to high humidity and consistent temperatures throughout the year. Over the past decade, Mombasa has experienced a warming trend, with high temperatures increasing by 0.17°C (0.31°F) and low temperatures rising even more sharply by 1.46°C (2.63°F). This warming is consistent with broader regional climate trends, reflecting the influence of global climate change on coastal cities.
Long-term Temperature Trends
Analysing the all-time data, Mombasa has shown a gradual warming, with high temperatures rising by 0.11°C (0.20°F) and low temperatures by 0.21°C (0.38°F). This long-term trend is less pronounced than the recent decade's data, indicating an acceleration in warming. The highest recorded temperature in Mombasa stands at 39.98°C (104.0°F), while the lowest is 15.3°C (59.5°F). These records highlight the city's relatively stable temperature range, despite the incremental increases over time.
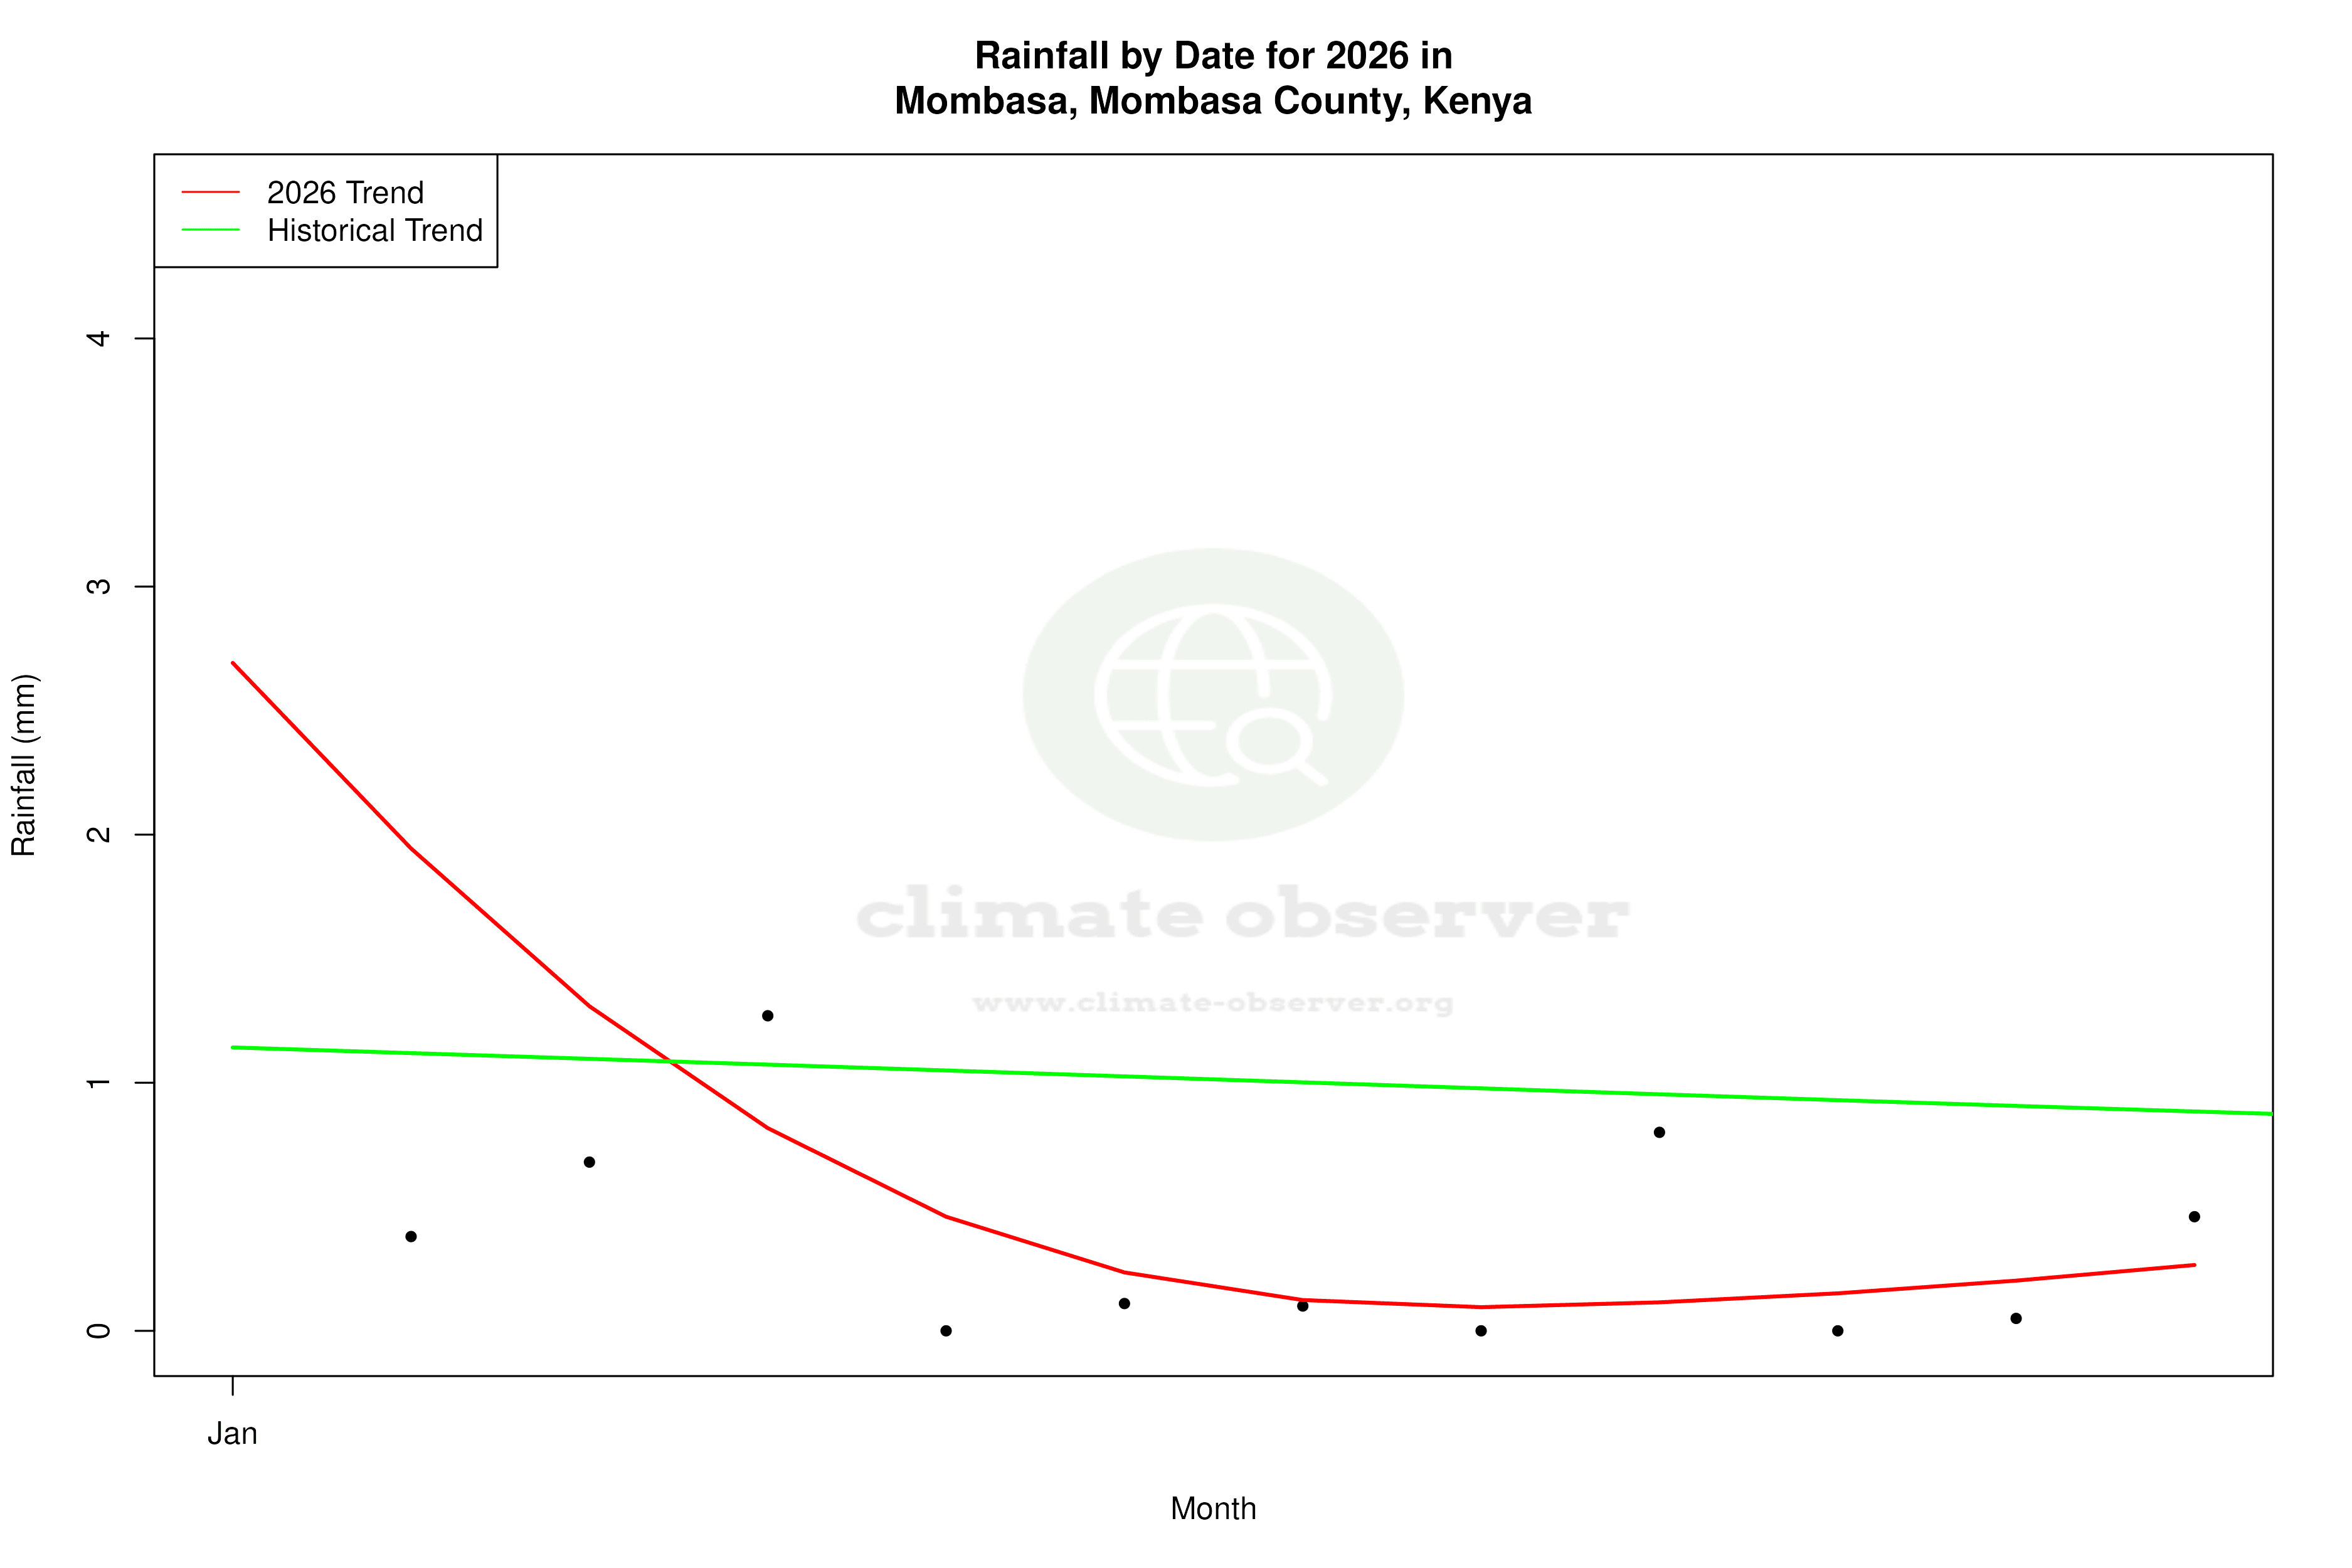
Precipitation Patterns and Implications
The Precipitation Concentration Index (PCI) for Mombasa has risen from a baseline of 16.4 to a current value of 17.3. This marginal increase suggests that rainfall is becoming slightly more concentrated in fewer events, which could lead to more intense rainfall episodes and longer dry spells. Such changes in precipitation patterns can have significant implications for water resource management and agricultural practices in the region. A PCI value above 20 would indicate highly concentrated rainfall, but Mombasa remains below this threshold, suggesting a moderate shift at present.
Regional Climate Goals and Challenges
Kenya is actively working towards climate resilience, with national goals focused on sustainable development and reducing vulnerability to climate change impacts. The trends observed in Mombasa align with the challenges faced by coastal cities globally, where rising temperatures and changing precipitation patterns necessitate adaptive strategies. Recent weather events, such as heavy rainfall leading to flooding, underscore the importance of these efforts. As Mombasa continues to develop, integrating climate data into urban planning and infrastructure development will be crucial to mitigate potential adverse effects.
Impacts on Local Ecosystems
The warming trend and changing precipitation patterns have implications for Mombasa's local ecosystems. Coastal and marine environments, which are integral to the city's economy and biodiversity, may experience stress due to temperature increases and altered rainfall. These changes can affect fish populations, coral reefs, and mangrove forests, all of which play critical roles in maintaining ecological balance and supporting livelihoods. Understanding these dynamics is essential for developing effective conservation strategies and ensuring the sustainability of Mombasa's natural resources.
Station Statistics
10-Year Trend
High: +0.11 °C/decade
Low: +1.34 °C/decade
Rain: -0.07 mm/decade
25-Year Trend
High: -0.13 °C/decade
Low: +0.54 °C/decade
Rain: +0.34 mm/decade
50-Year Trend
High: +0.13 °C/decade
Low: +0.39 °C/decade
Rain: -0.06 mm/decade
All-Time Trend
High: +0.11 °C/decade
Low: +0.21 °C/decade
Rain: -0.06 mm/decade
Percentage Above-Average Days
Last 12 Months: 44.7%
This Year: 16.0%
Precipitation Concentration Index (PCI) ℹ️
Last 12 Months: 16.0
Historical Average: 16.9
Percentile Rank of Last 12 Months ℹ️
High: 50th percentile
Low: 91st percentile
Rain: 54th percentile
Change in Variance ℹ️
High: -15.6%
Low: +4.3%
Intraday: -24.5%
Data Coverage
85.6%
First Year of Data
1957
Station Location
Historical Weather Records
| Max High | Avg High | Min High | Max Avg | Avg Avg | Min Avg | Max Low | Avg Low | Min Low | Max Precipitation | Avg Precipitation | Max Snow | Avg Snow | |
|---|---|---|---|---|---|---|---|---|---|---|---|---|---|
| Record | 40.0 °C | — | 23.2 °C | 31.6 °C | — | 20.3 °C | 27.8 °C | — | 15.3 °C | 166.6 mm | — | — | — |
| January | 38.0 °C | 32.7 °C | 27.0 °C | 30.7 °C | 27.4 °C | 23.0 °C | 26.7 °C | 23.5 °C | 18.3 °C | 54.6 mm | 0.8 mm | — | — |
| February | 40.0 °C | 33.2 °C | 28.0 °C | 31.1 °C | 27.7 °C | 23.9 °C | 27.8 °C | 23.7 °C | 19.4 °C | 63.5 mm | 0.5 mm | — | — |
| March | 38.7 °C | 33.1 °C | 28.0 °C | 31.5 °C | 28.3 °C | 23.3 °C | 27.6 °C | 24.3 °C | 19.7 °C | 70.1 mm | 2.1 mm | — | — |
| April | 37.2 °C | 31.4 °C | 24.7 °C | 31.6 °C | 27.5 °C | 22.9 °C | 27.0 °C | 24.0 °C | 18.9 °C | 149.3 mm | 6.0 mm | — | — |
| May | 35.0 °C | 29.7 °C | 23.2 °C | 29.6 °C | 26.0 °C | 22.1 °C | 26.7 °C | 22.8 °C | 18.8 °C | 166.6 mm | 8.2 mm | — | — |
| June | 32.2 °C | 28.7 °C | 24.0 °C | 28.1 °C | 24.8 °C | 21.8 °C | 25.0 °C | 21.4 °C | 17.4 °C | 102.1 mm | 3.4 mm | — | — |
| July | 32.0 °C | 28.1 °C | 23.2 °C | 27.7 °C | 24.0 °C | 20.6 °C | 24.0 °C | 20.5 °C | 15.7 °C | 67.0 mm | 2.1 mm | — | — |
| August | 31.6 °C | 28.4 °C | 24.0 °C | 28.4 °C | 24.1 °C | 20.3 °C | 24.0 °C | 20.5 °C | 15.3 °C | 62.0 mm | 1.9 mm | — | — |
| September | 33.2 °C | 29.1 °C | 24.0 °C | 27.8 °C | 24.9 °C | 21.3 °C | 25.0 °C | 21.1 °C | 16.3 °C | 147.3 mm | 1.7 mm | — | — |
| October | 35.1 °C | 30.1 °C | 25.0 °C | 28.4 °C | 25.9 °C | 21.4 °C | 26.0 °C | 22.2 °C | 18.0 °C | 152.5 mm | 3.5 mm | — | — |
| November | 35.9 °C | 31.0 °C | 25.4 °C | 30.2 °C | 26.8 °C | 22.1 °C | 27.0 °C | 23.2 °C | 18.8 °C | 140.2 mm | 3.7 mm | — | — |
| December | 37.4 °C | 32.0 °C | 26.2 °C | 30.4 °C | 27.3 °C | 23.2 °C | 26.0 °C | 23.5 °C | 19.7 °C | 59.5 mm | 2.2 mm | — | — |
Data Visualisations
Remove WatermarksCurrent Year Climate Trends vs Historical


Max Temperature this Year | 1 of 6
Climate 12-Month Moving Averages


Max Temperature 12-Month MA | 1 of 6
Daily Data Points and Averages Throughout the Year


Average Max Temperature Throughout Year | 1 of 5
