Climate for Station: Naryn, Naryn Region, Kyrgyzstan
Loading live weather...
Climate Analysis & Overview
Naryn, nestled in the heart of Kyrgyzstan, is experiencing a warming trend with significant increases in both high and low temperatures over the past decade. Despite this, the all-time trends show a more modest rise, indicating long-term stability. Precipitation patterns have become slightly more even, suggesting a shift in local weather dynamics.
Mountainous Climate Dynamics
Naryn, located at 41.4331°N, 76.0°E, is characterised by its continental climate, classified under the Köppen system as Dfb, which denotes a humid continental climate with warm summers. The city's high-altitude position in the Tien Shan mountain range influences its climate, leading to significant temperature variations and unique precipitation patterns. The surrounding mountains act as a barrier, impacting wind patterns and precipitation distribution.
Temperature Trends: A Decadal Surge
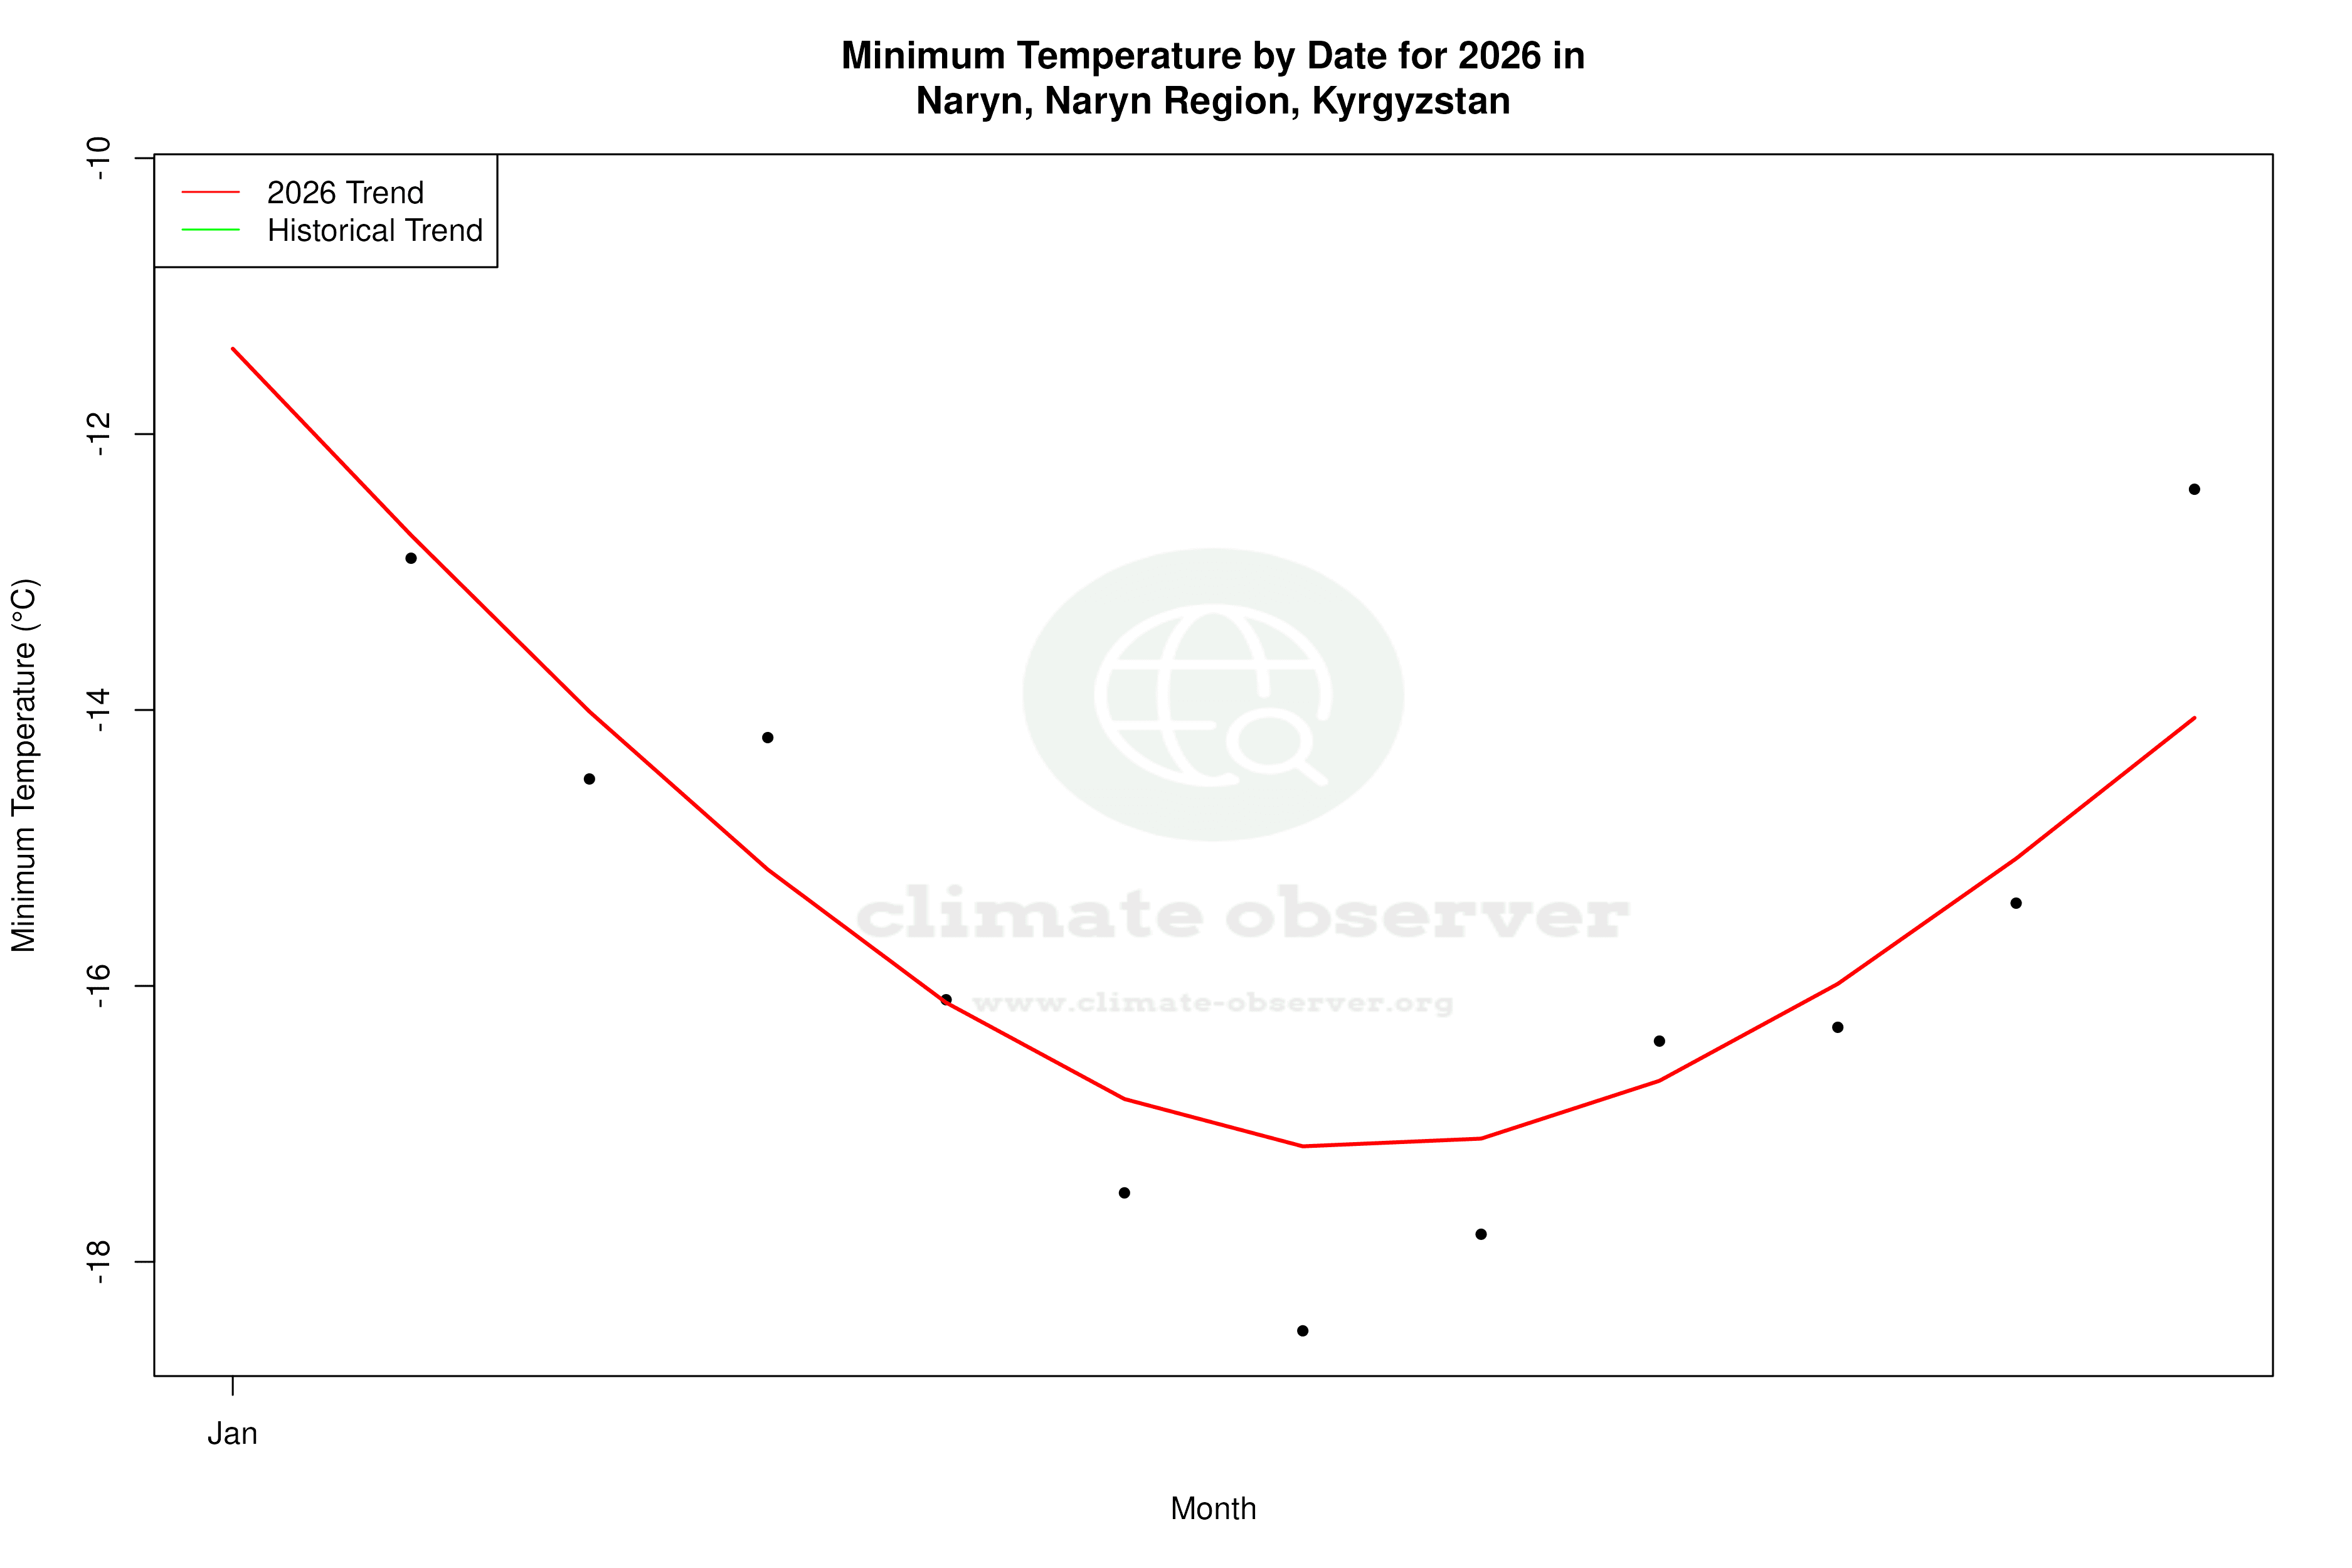
Over the past decade, Naryn has witnessed a notable warming trend. The average high temperatures have increased by 1.32°C (2.38°F), while the lows have surged by 3.89°C (7.00°F). This sharp rise in low temperatures could suggest milder winters, which might affect local ecosystems and agriculture. In contrast, the all-time trends are more subdued, with highs rising by just 0.29°C (0.52°F) and lows by 0.24°C (0.43°F). This discrepancy highlights the importance of considering both short-term and long-term data to understand climate dynamics fully.
Precipitation Patterns: A Slight Shift
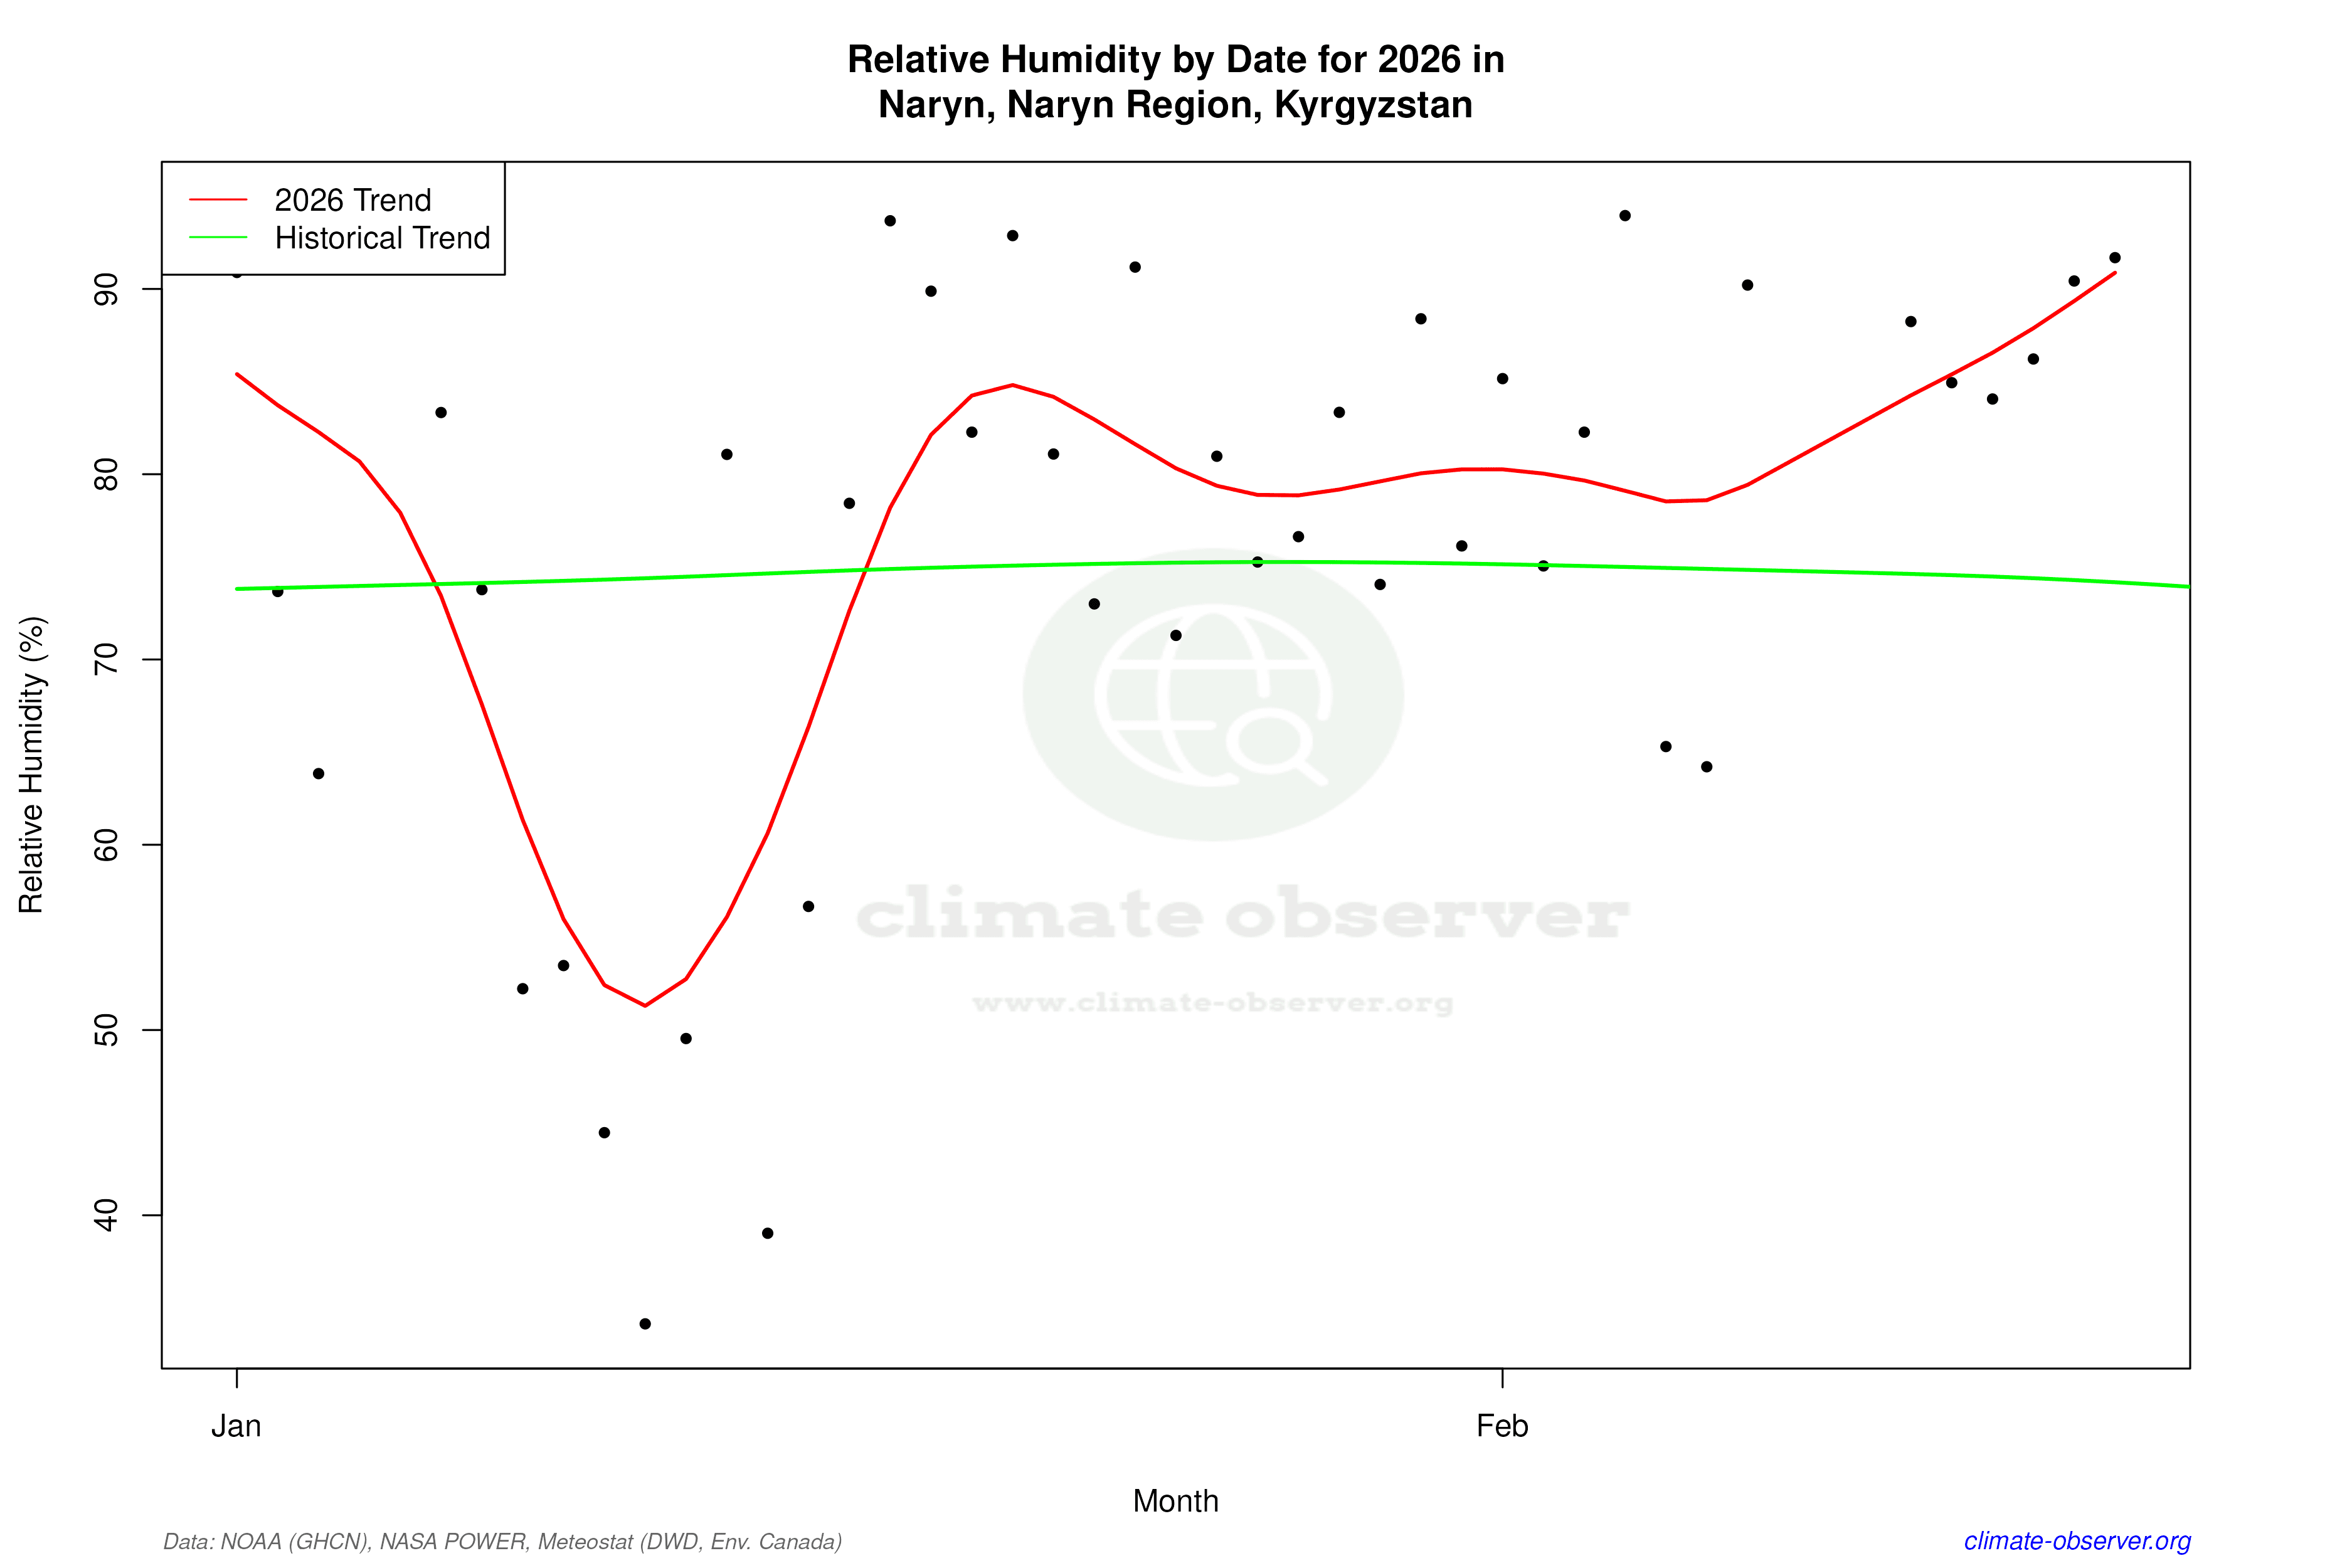
The Precipitation Concentration Index (PCI) for Naryn has decreased from a baseline of 14.35 to 13.07, indicating that rainfall is now more evenly distributed throughout the year. This slight change suggests a reduction in extreme weather events, such as heavy downpours, which could mitigate flood risks and benefit agricultural practices. However, the PCI remains above 10, suggesting that while the distribution is more even, precipitation is still somewhat concentrated.
Temperature Extremes: Record Highs and Lows
Naryn's climate is marked by its temperature extremes, with a record high of 36.9°C (98.4°F) and a chilling low of -38.0°C (-36.4°F). These extremes are typical of continental climates and reflect the city's geographical location and elevation. Such variations can pose challenges for infrastructure and require adaptive measures to ensure resilience against both heatwaves and cold snaps.
Regional Climate Considerations
Kyrgyzstan has been actively working towards regional climate goals, focusing on sustainable development and adaptation strategies. The observed warming trends in Naryn align with broader regional patterns, underscoring the need for continued monitoring and adaptation. Recent weather events, such as unseasonal temperature fluctuations, highlight the importance of integrating climate data into planning and policy-making to safeguard the region's natural and human systems.
Station Statistics
10-Year Trend
High: +1.21 °C/decade
Low: +2.64 °C/decade
Rain: +0.91 mm/decade
25-Year Trend
High: +0.17 °C/decade
Low: -0.66 °C/decade
Rain: +0.35 mm/decade
50-Year Trend
High: +0.34 °C/decade
Low: -0.16 °C/decade
Rain: +0.10 mm/decade
All-Time Trend
High: +0.27 °C/decade
Low: +0.19 °C/decade
Rain: +0.02 mm/decade
Percentage Above-Average Days
Last 12 Months: 59.7%
This Year: 2.6%
Precipitation Concentration Index (PCI) ℹ️
Last 12 Months: 14.3
Historical Average: 14.4
Percentile Rank of Last 12 Months ℹ️
High: 68th percentile
Low: 62nd percentile
Rain: 96th percentile
Change in Variance ℹ️
High: -9.9%
Low: -14.2%
Intraday: +9.5%
Data Coverage
93.4%
First Year of Data
1913
Station Location
Historical Weather Records
| Max High | Avg High | Min High | Max Avg | Avg Avg | Min Avg | Max Low | Avg Low | Min Low | Max Precipitation | Avg Precipitation | Max Snow | Avg Snow | |
|---|---|---|---|---|---|---|---|---|---|---|---|---|---|
| Record | 36.9 °C | — | -25.5 °C | 29.2 °C | — | -33.3 °C | 20.0 °C | — | -38.0 °C | 51.9 mm | — | — | — |
| January | 5.3 °C | -9.6 °C | -25.5 °C | -1.6 °C | -15.9 °C | -33.3 °C | -5.9 °C | -20.7 °C | -37.9 °C | 8.6 mm | 0.3 mm | — | — |
| February | 9.0 °C | -6.0 °C | -20.9 °C | 1.7 °C | -12.2 °C | -30.5 °C | -1.4 °C | -17.3 °C | -38.0 °C | 26.6 mm | 0.5 mm | — | — |
| March | 20.0 °C | 2.9 °C | -15.9 °C | 12.7 °C | -2.8 °C | -20.6 °C | 6.6 °C | -7.5 °C | -30.6 °C | 32.6 mm | 0.7 mm | — | — |
| April | 29.5 °C | 13.6 °C | -4.3 °C | 20.5 °C | 7.3 °C | -9.5 °C | 11.4 °C | 1.5 °C | -17.3 °C | 25.1 mm | 1.1 mm | — | — |
| May | 29.6 °C | 18.2 °C | 0.7 °C | 22.6 °C | 11.9 °C | -3.4 °C | 16.0 °C | 5.6 °C | -8.9 °C | 37.1 mm | 1.7 mm | — | — |
| June | 33.1 °C | 21.5 °C | 5.6 °C | 25.8 °C | 14.7 °C | 2.6 °C | 16.8 °C | 8.1 °C | -2.2 °C | 43.8 mm | 1.8 mm | — | — |
| July | 36.9 °C | 24.8 °C | 10.3 °C | 26.8 °C | 17.5 °C | 6.4 °C | 19.5 °C | 10.2 °C | -1.0 °C | 51.9 mm | 1.2 mm | — | — |
| August | 36.0 °C | 24.9 °C | 11.6 °C | 29.2 °C | 17.4 °C | 6.8 °C | 20.0 °C | 9.8 °C | -2.9 °C | 33.8 mm | 0.7 mm | — | — |
| September | 31.4 °C | 20.7 °C | 5.4 °C | 23.1 °C | 12.9 °C | 0.6 °C | 17.5 °C | 5.7 °C | -7.4 °C | 29.8 mm | 0.5 mm | — | — |
| October | 26.6 °C | 13.2 °C | -4.8 °C | 17.6 °C | 5.9 °C | -10.2 °C | 10.2 °C | 0.1 °C | -14.9 °C | 41.6 mm | 0.5 mm | — | — |
| November | 19.0 °C | 3.0 °C | -19.5 °C | 8.8 °C | -3.5 °C | -25.6 °C | 5.0 °C | -8.0 °C | -29.2 °C | 17.0 mm | 0.5 mm | — | — |
| December | 15.0 °C | -6.6 °C | -23.9 °C | 0.3 °C | -12.4 °C | -30.8 °C | -2.4 °C | -17.0 °C | -35.4 °C | 42.0 mm | 0.3 mm | — | — |
Data Visualisations
Remove WatermarksCurrent Year Climate Trends vs Historical


Max Temperature this Year | 1 of 6
Climate 12-Month Moving Averages


Max Temperature 12-Month MA | 1 of 6
Daily Data Points and Averages Throughout the Year


Average Max Temperature Throughout Year | 1 of 5
