Climate for Station: Chunggang, Chagang Province, Korea, North
Loading live weather...
Climate Analysis & Overview
Chunggang's climate is experiencing notable warming, particularly in nighttime temperatures, over the past decade. Despite a slight decrease in precipitation concentration, the overall warming trend aligns with regional climate goals to monitor and adapt to changing conditions.
Climate Classification and Geography
Chunggang, located at 41.783, 126.883, falls under the Köppen climate classification of Dwa, indicating a humid continental climate with dry winters and hot summers. The region's mountainous terrain, typical of North Korea's northern areas, influences its weather patterns, contributing to significant temperature variations between seasons. The local geography, with its elevation and proximity to the Yalu River, plays a critical role in moderating temperatures and precipitation distribution.
Decadal Temperature Trends
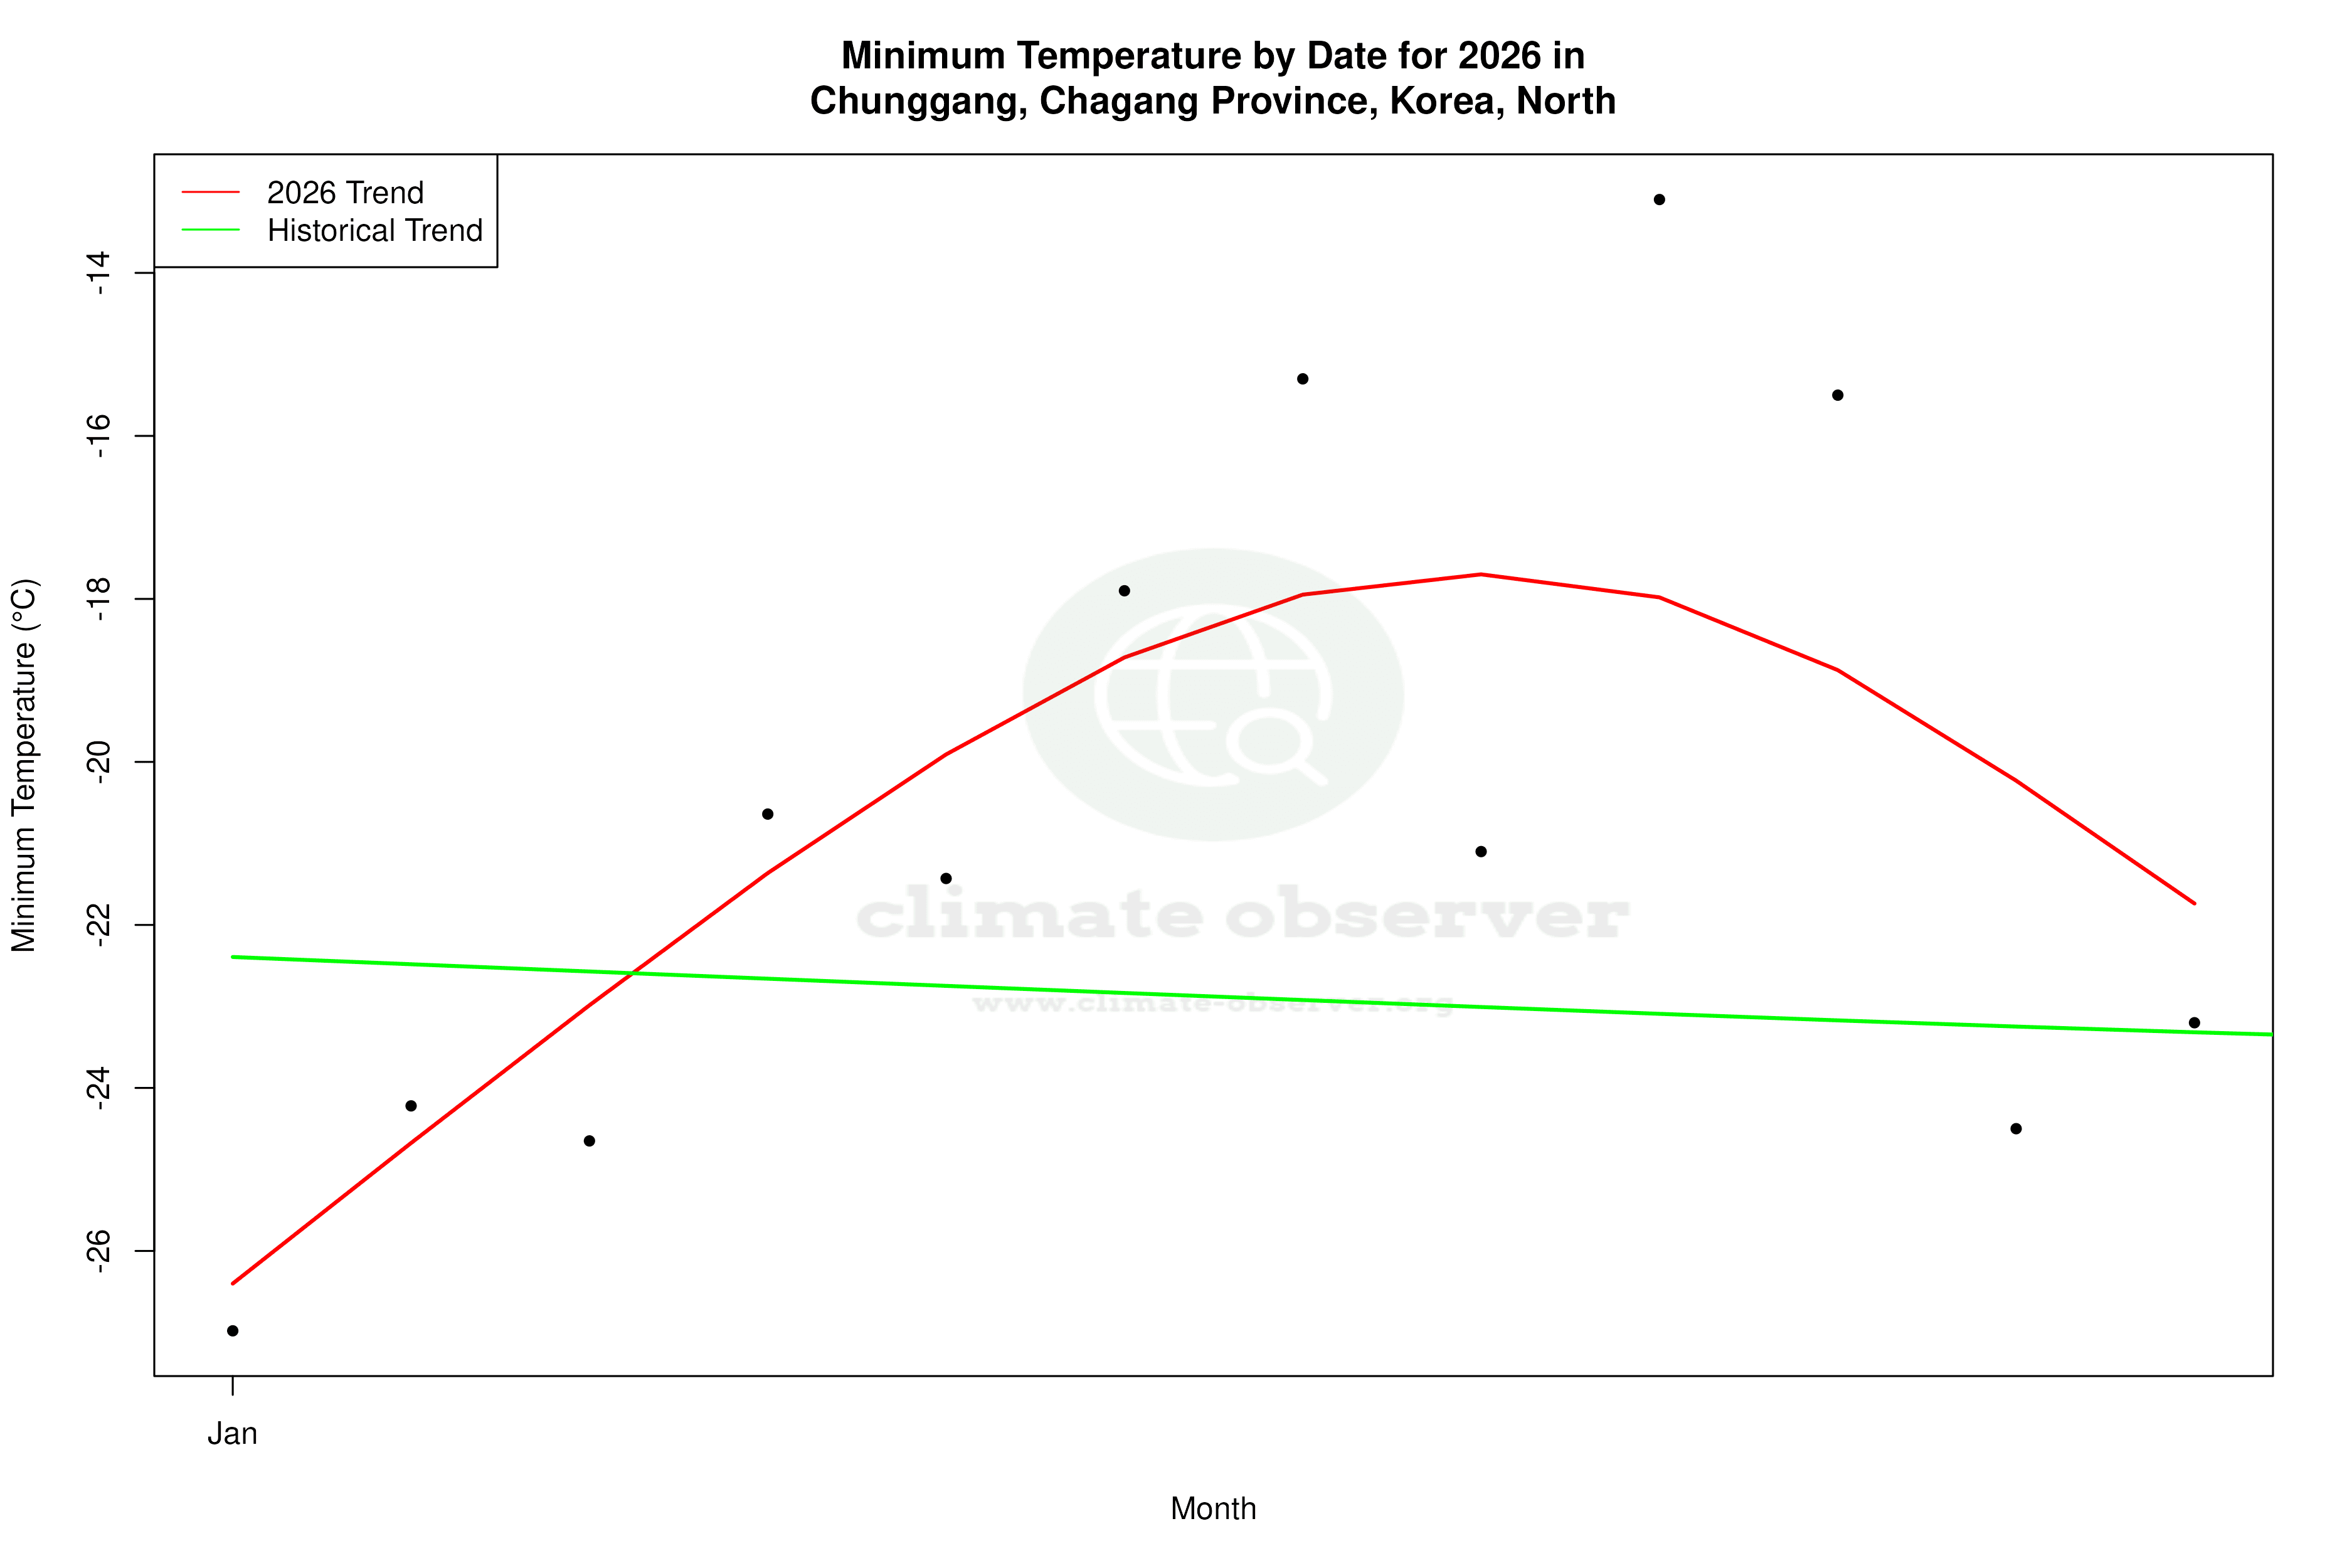
Over the past decade, Chunggang has experienced a significant warming trend, with average high temperatures increasing by 2.70°C (4.86°F) and lows rising by 3.66°C (6.60°F). This substantial increase in nighttime temperatures suggests a warming climate, which could have implications for local ecosystems and agriculture. These trends are more pronounced than the all-time warming trends, where highs have risen by 0.20°C (0.36°F) and lows by 0.17°C (0.31°F). The disparity between the decadal and all-time trends highlights an acceleration in warming over recent years.
Temperature Extremes
Chunggang has recorded a maximum temperature of 40.2°C (104.4°F) and a minimum of -37.2°C (-35.0°F). These extremes underscore the region's significant seasonal variability, characteristic of its continental climate. Such temperature variations can influence local agricultural practices and energy demands, necessitating adaptive strategies to mitigate potential impacts.
Precipitation Patterns and Distribution
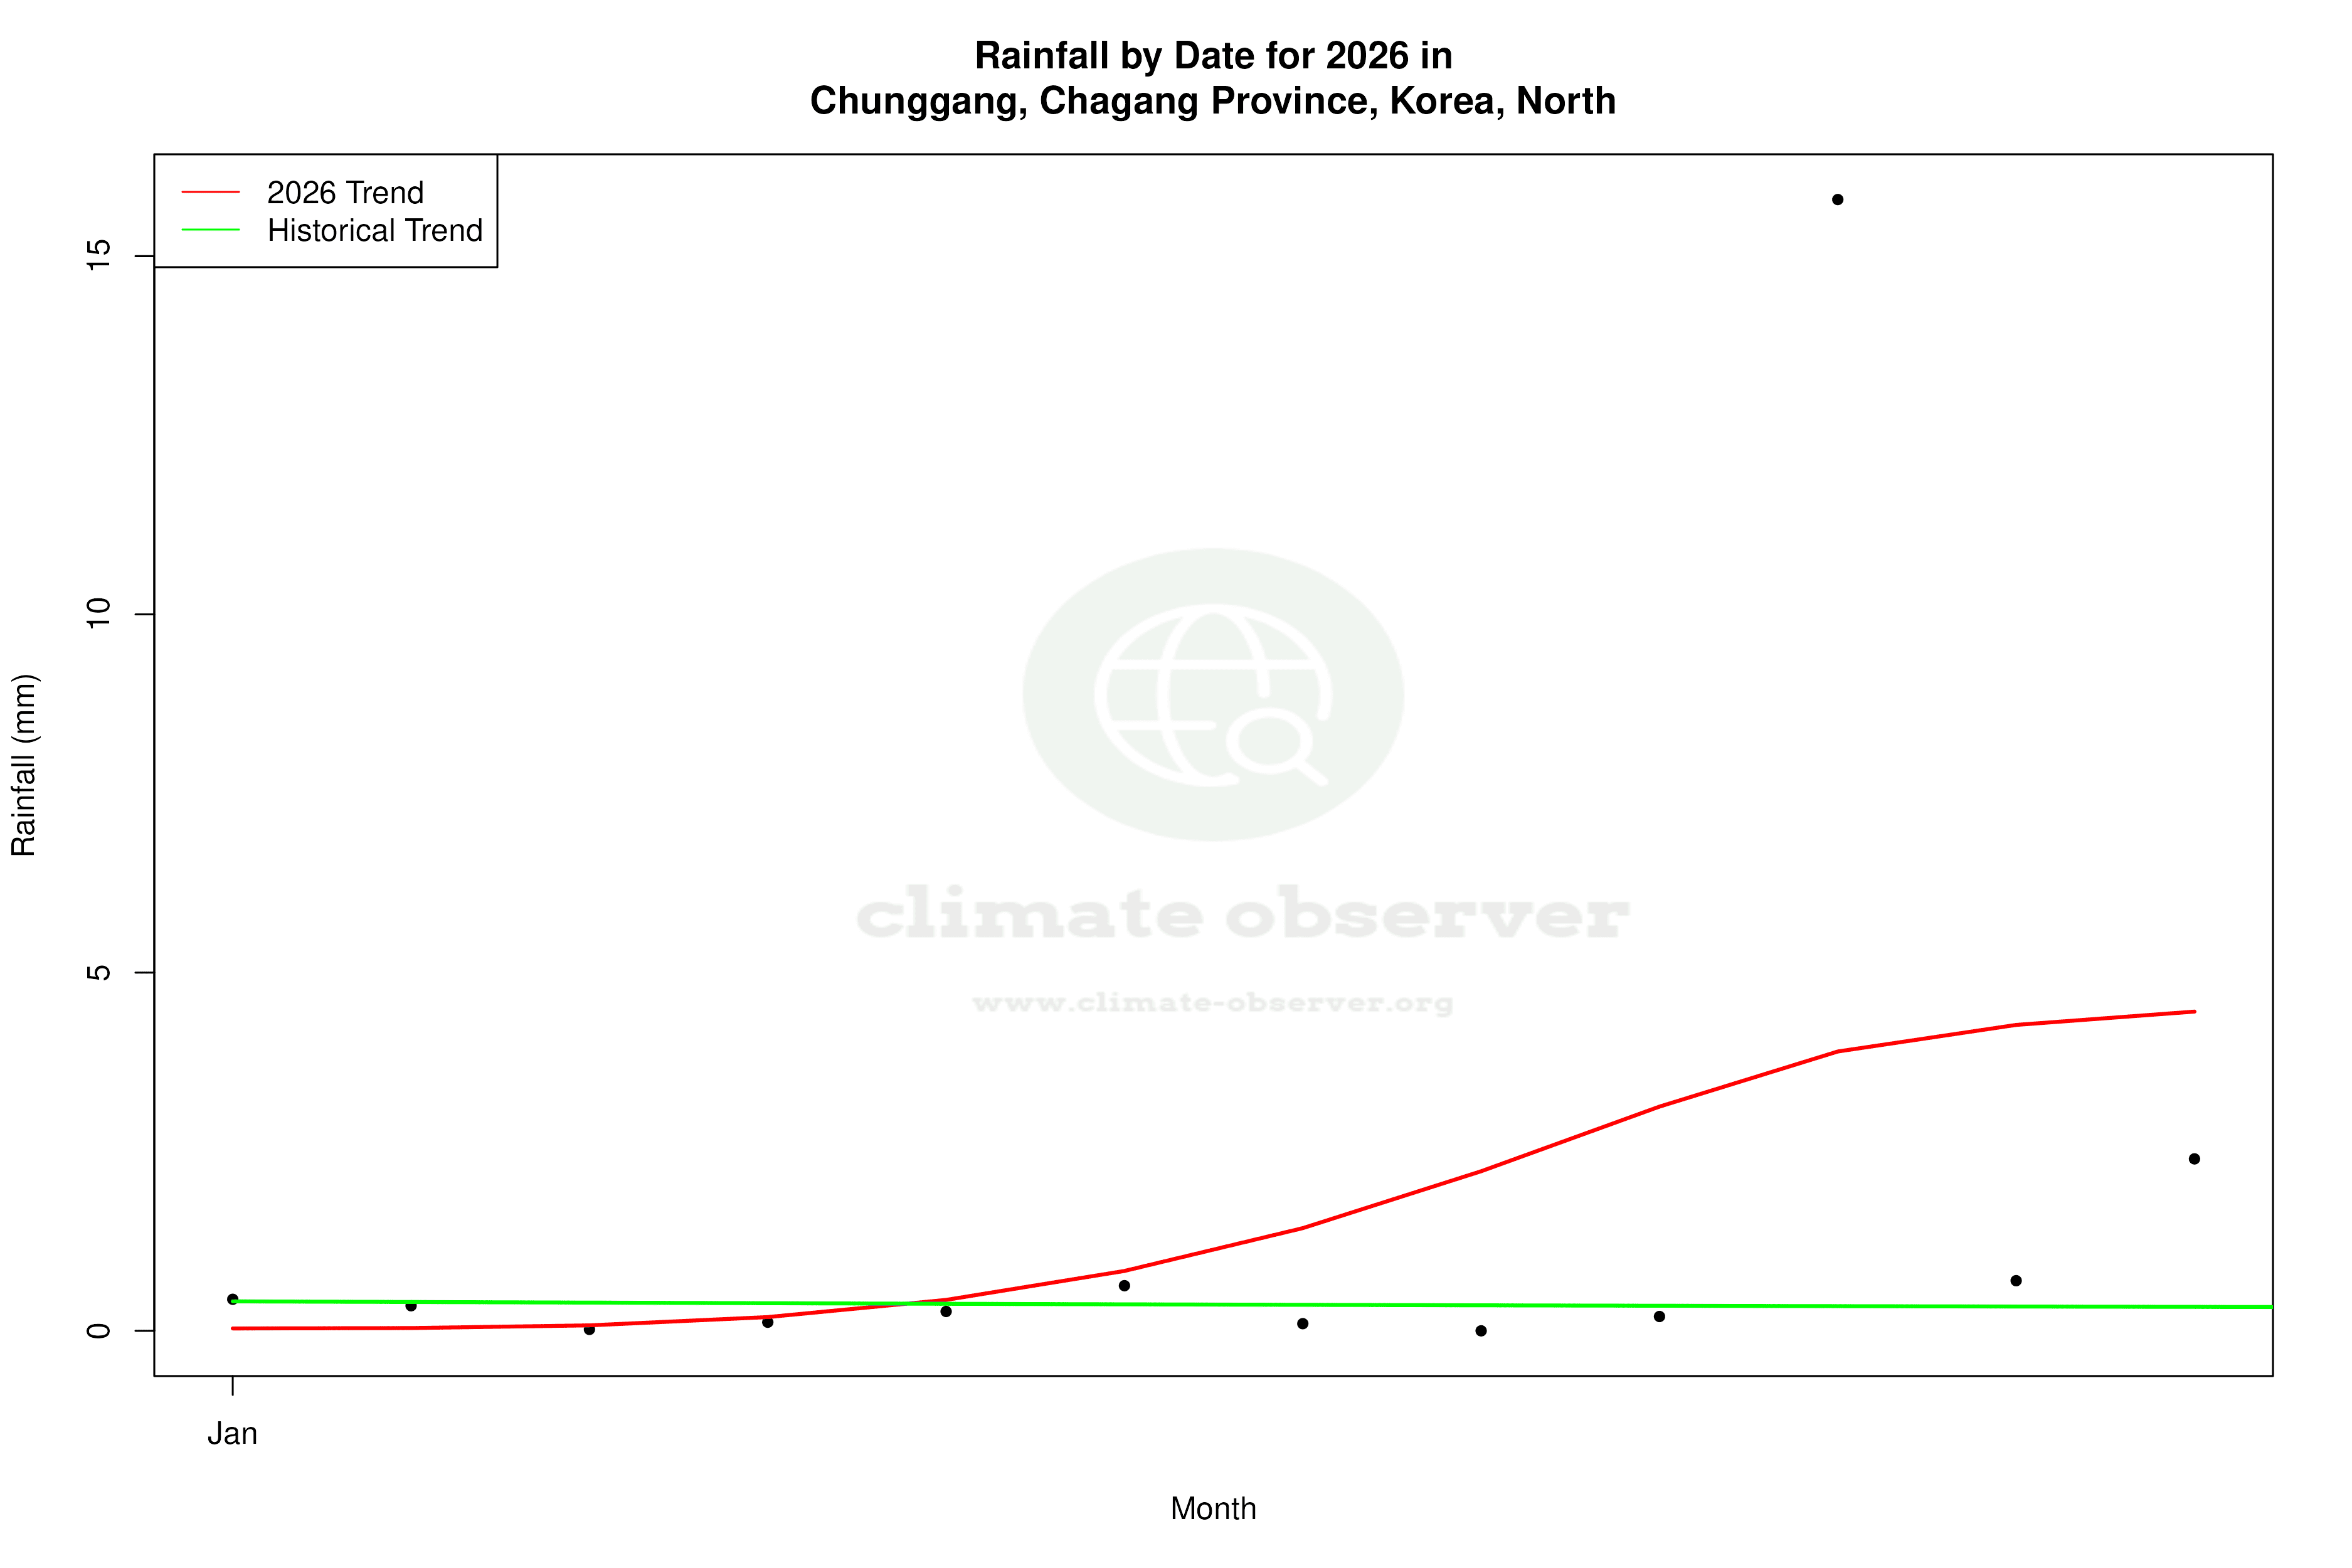
The Precipitation Concentration Index (PCI) for Chunggang has shown a slight decrease from a baseline of 17.91 to a current value of 16.18. This indicates a marginal shift towards more evenly distributed precipitation events, which could benefit agricultural productivity by reducing the risk of droughts and floods. A PCI value under 20 suggests that while precipitation events are still somewhat concentrated, they are becoming more evenly spread over time.
Regional Climate Context
In the context of North Korea's regional climate goals, which focus on monitoring climate changes and adapting to their impacts, Chunggang's data provides valuable insights. The warming trends observed, particularly the rapid increase in nighttime temperatures, align with broader regional patterns and underscore the importance of continued climate monitoring and adaptation strategies.
Station Statistics
10-Year Trend
High: +2.06 °C/decade
Low: +3.92 °C/decade
Rain: +0.80 mm/decade
25-Year Trend
High: +0.19 °C/decade
Low: +0.15 °C/decade
Rain: +0.39 mm/decade
50-Year Trend
High: +0.14 °C/decade
Low: +0.04 °C/decade
Rain: +0.21 mm/decade
All-Time Trend
High: +0.19 °C/decade
Low: +0.18 °C/decade
Rain: +0.04 mm/decade
Percentage Above-Average Days
Last 12 Months: 48.8%
This Year: 38.5%
Precipitation Concentration Index (PCI) ℹ️
Last 12 Months: 18.5
Historical Average: 17.4
Percentile Rank of Last 12 Months ℹ️
High: 28th percentile
Low: 99th percentile
Rain: 94th percentile
Change in Variance ℹ️
High: -7.0%
Low: -1.3%
Intraday: +22.5%
Data Coverage
99.7%
First Year of Data
1953
Station Location
Historical Weather Records
| Max High | Avg High | Min High | Max Avg | Avg Avg | Min Avg | Max Low | Avg Low | Min Low | Max Precipitation | Avg Precipitation | Max Snow | Avg Snow | |
|---|---|---|---|---|---|---|---|---|---|---|---|---|---|
| Record | 40.2 °C | — | -23.9 °C | 31.2 °C | — | -31.1 °C | 25.0 °C | — | -37.2 °C | 135.9 mm | — | — | — |
| January | 6.9 °C | -8.6 °C | -23.9 °C | 0.4 °C | -16.5 °C | -31.1 °C | -1.7 °C | -23.1 °C | -37.2 °C | 10.9 mm | 0.3 mm | — | — |
| February | 13.6 °C | -2.9 °C | -19.0 °C | 4.4 °C | -10.9 °C | -28.8 °C | 0.8 °C | -18.3 °C | -36.1 °C | 21.1 mm | 0.4 mm | — | — |
| March | 21.0 °C | 5.2 °C | -13.9 °C | 14.7 °C | -1.2 °C | -20.3 °C | 7.2 °C | -7.6 °C | -32.2 °C | 28.4 mm | 0.7 mm | — | — |
| April | 31.0 °C | 15.1 °C | -2.2 °C | 22.0 °C | 7.8 °C | -5.4 °C | 16.3 °C | 0.7 °C | -12.8 °C | 49.0 mm | 1.5 mm | — | — |
| May | 34.0 °C | 21.9 °C | 5.7 °C | 28.3 °C | 14.5 °C | 2.7 °C | 18.7 °C | 7.3 °C | -5.2 °C | 55.9 mm | 2.6 mm | — | — |
| June | 37.2 °C | 25.7 °C | 11.2 °C | 26.8 °C | 19.2 °C | 8.9 °C | 22.1 °C | 13.5 °C | 3.5 °C | 65.0 mm | 4.0 mm | — | — |
| July | 40.2 °C | 28.4 °C | 17.2 °C | 31.2 °C | 22.7 °C | 15.2 °C | 24.4 °C | 18.2 °C | 9.0 °C | 114.0 mm | 6.7 mm | — | — |
| August | 39.0 °C | 27.6 °C | 14.6 °C | 29.7 °C | 21.6 °C | 10.9 °C | 25.0 °C | 17.3 °C | 4.1 °C | 135.9 mm | 6.0 mm | — | — |
| September | 32.0 °C | 22.5 °C | 8.0 °C | 23.8 °C | 15.0 °C | 2.6 °C | 20.7 °C | 9.6 °C | -2.5 °C | 73.1 mm | 2.5 mm | — | — |
| October | 28.1 °C | 14.9 °C | -2.3 °C | 18.7 °C | 7.0 °C | -7.0 °C | 13.9 °C | 0.7 °C | -13.2 °C | 29.7 mm | 1.3 mm | — | — |
| November | 19.9 °C | 3.7 °C | -15.0 °C | 10.9 °C | -2.5 °C | -21.3 °C | 7.0 °C | -7.6 °C | -30.0 °C | 37.1 mm | 1.2 mm | — | — |
| December | 10.2 °C | -6.2 °C | -22.2 °C | 5.1 °C | -12.9 °C | -29.4 °C | 0.1 °C | -18.5 °C | -36.1 °C | 16.8 mm | 0.5 mm | — | — |
Data Visualisations
Remove WatermarksCurrent Year Climate Trends vs Historical


Max Temperature this Year | 1 of 6
Climate 12-Month Moving Averages


Max Temperature 12-Month MA | 1 of 6
Daily Data Points and Averages Throughout the Year


Average Max Temperature Throughout Year | 1 of 5
