Climate for Station: Pyongyang Intl, Pyongyang, Korea, North
Loading live weather...
Climate Analysis & Overview
Pyongyang International Airport, located in the heart of North Korea, exhibits a complex climate profile characterised by a warming trend in low temperatures over the past decade, contrasting with a cooling trend in high temperatures. The region's precipitation patterns have become more evenly distributed, indicating a shift in local weather dynamics.
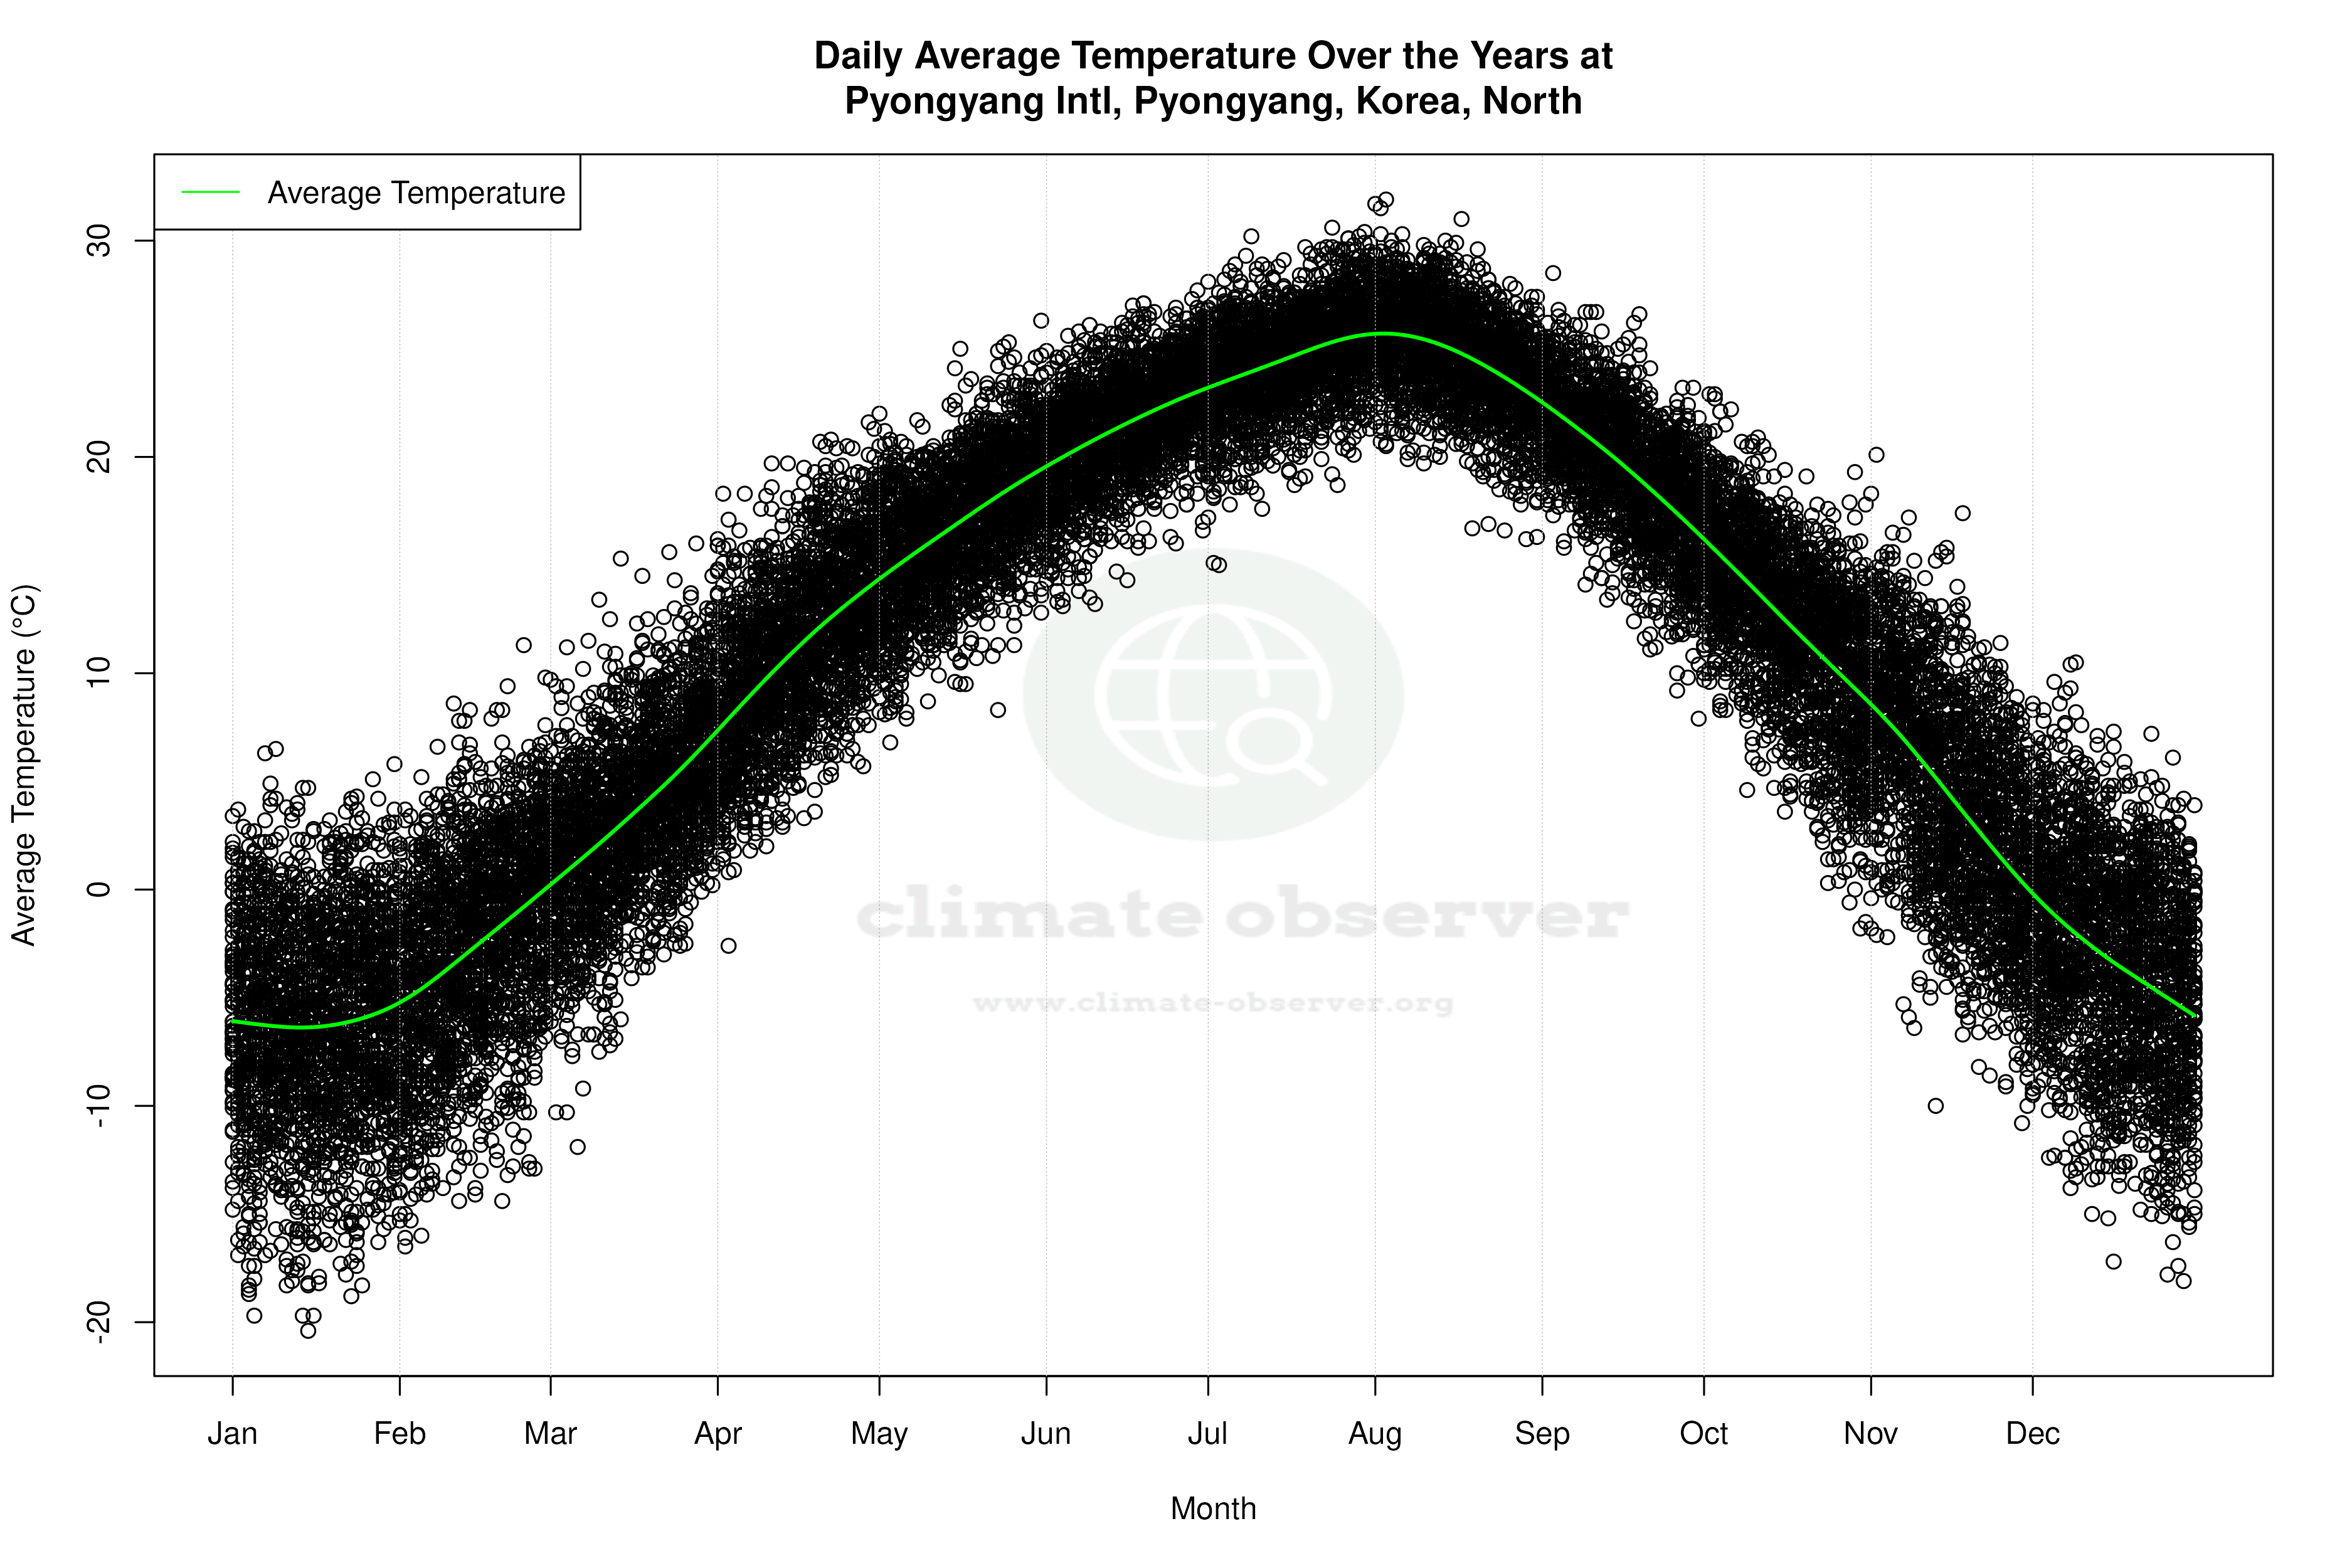
Köppen Climate and Geographic Influences
Pyongyang International Airport, situated at 39.224°N, 125.67°E, falls under the Köppen climate classification of Dwa, indicating a humid continental climate with dry winters and hot summers. The city's geographical setting, nestled between mountains and the Taedong River, influences its climate by moderating temperatures and contributing to the seasonal variability. The all-time temperature trends show a warming pattern, with high temperatures rising by 0.20°C (0.36°F) and low temperatures by 0.61°C (1.10°F). This warming is consistent with broader regional climate changes observed across the Korean Peninsula.
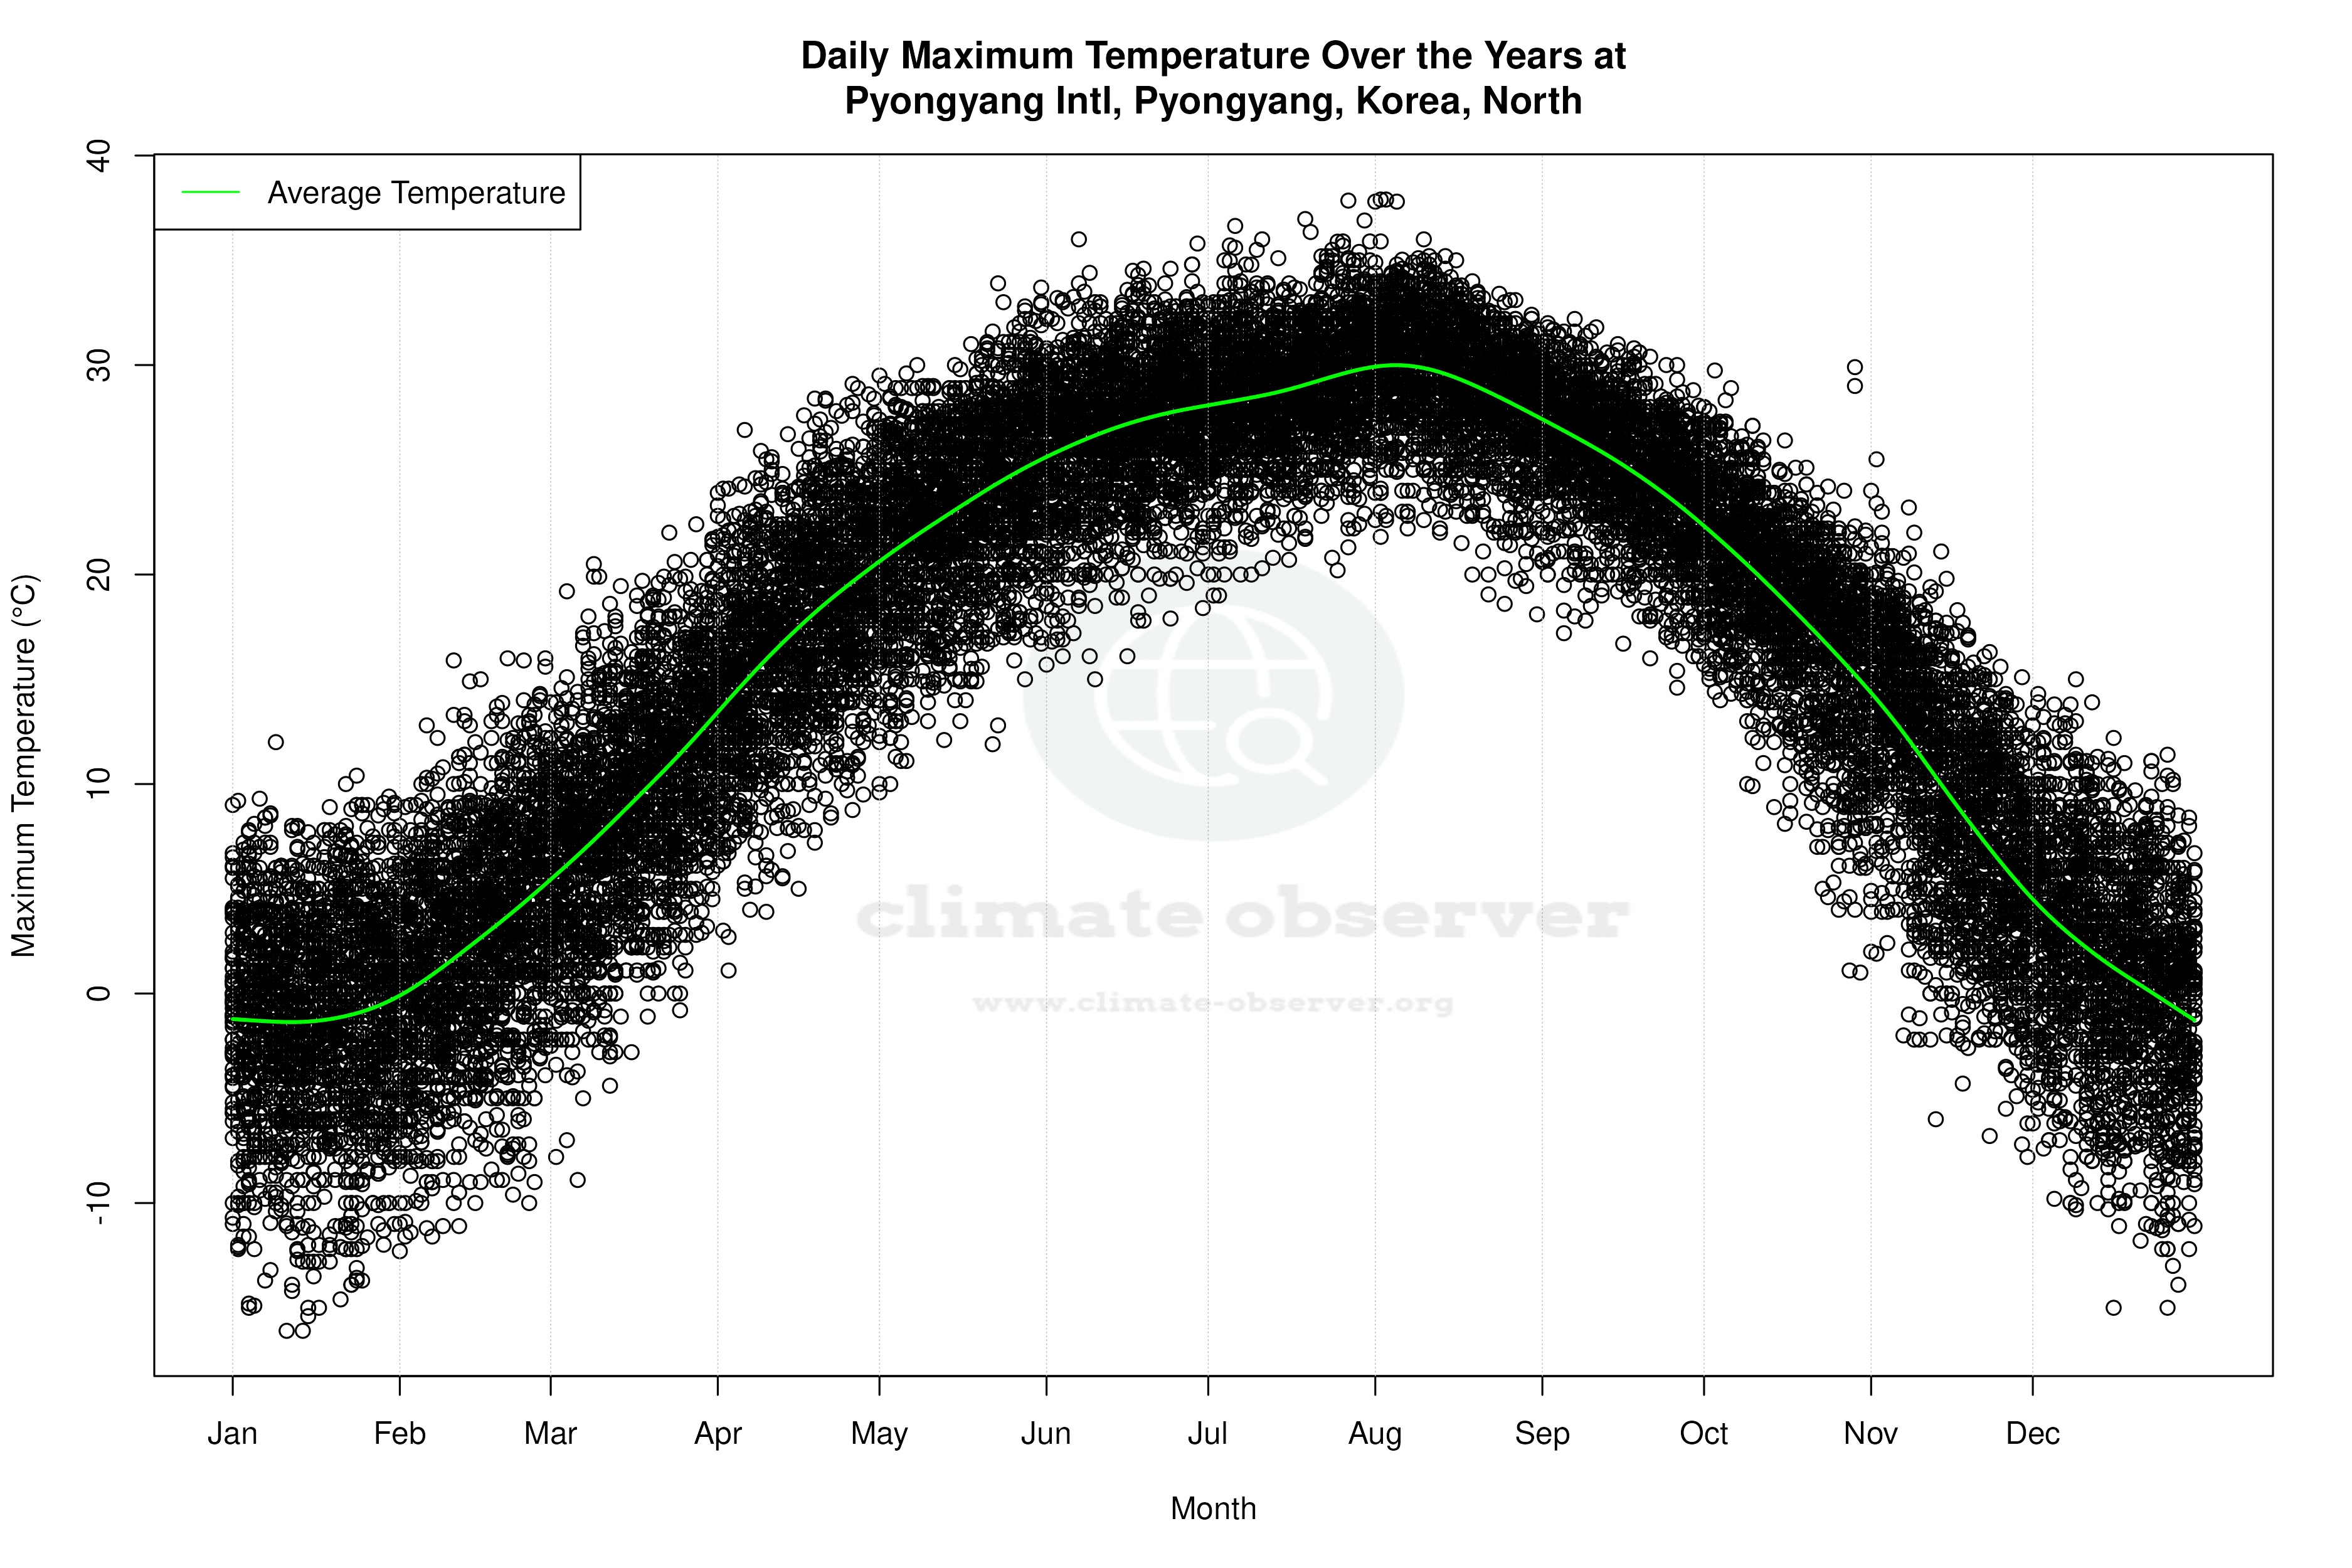
Temperature Trends: A Decade in Review
Over the past ten years, Pyongyang has experienced a notable divergence in temperature trends. While high temperatures have shown a slight cooling trend, decreasing by 0.07°C (0.13°F), low temperatures have risen significantly by 2.29°C (4.13°F). This increase in low temperatures suggests milder winters, potentially impacting local agriculture and energy consumption. The record high temperature at the station is 37.9°C (100.2°F), while the record low is -26.5°C (-15.7°F), highlighting the region's wide temperature range.
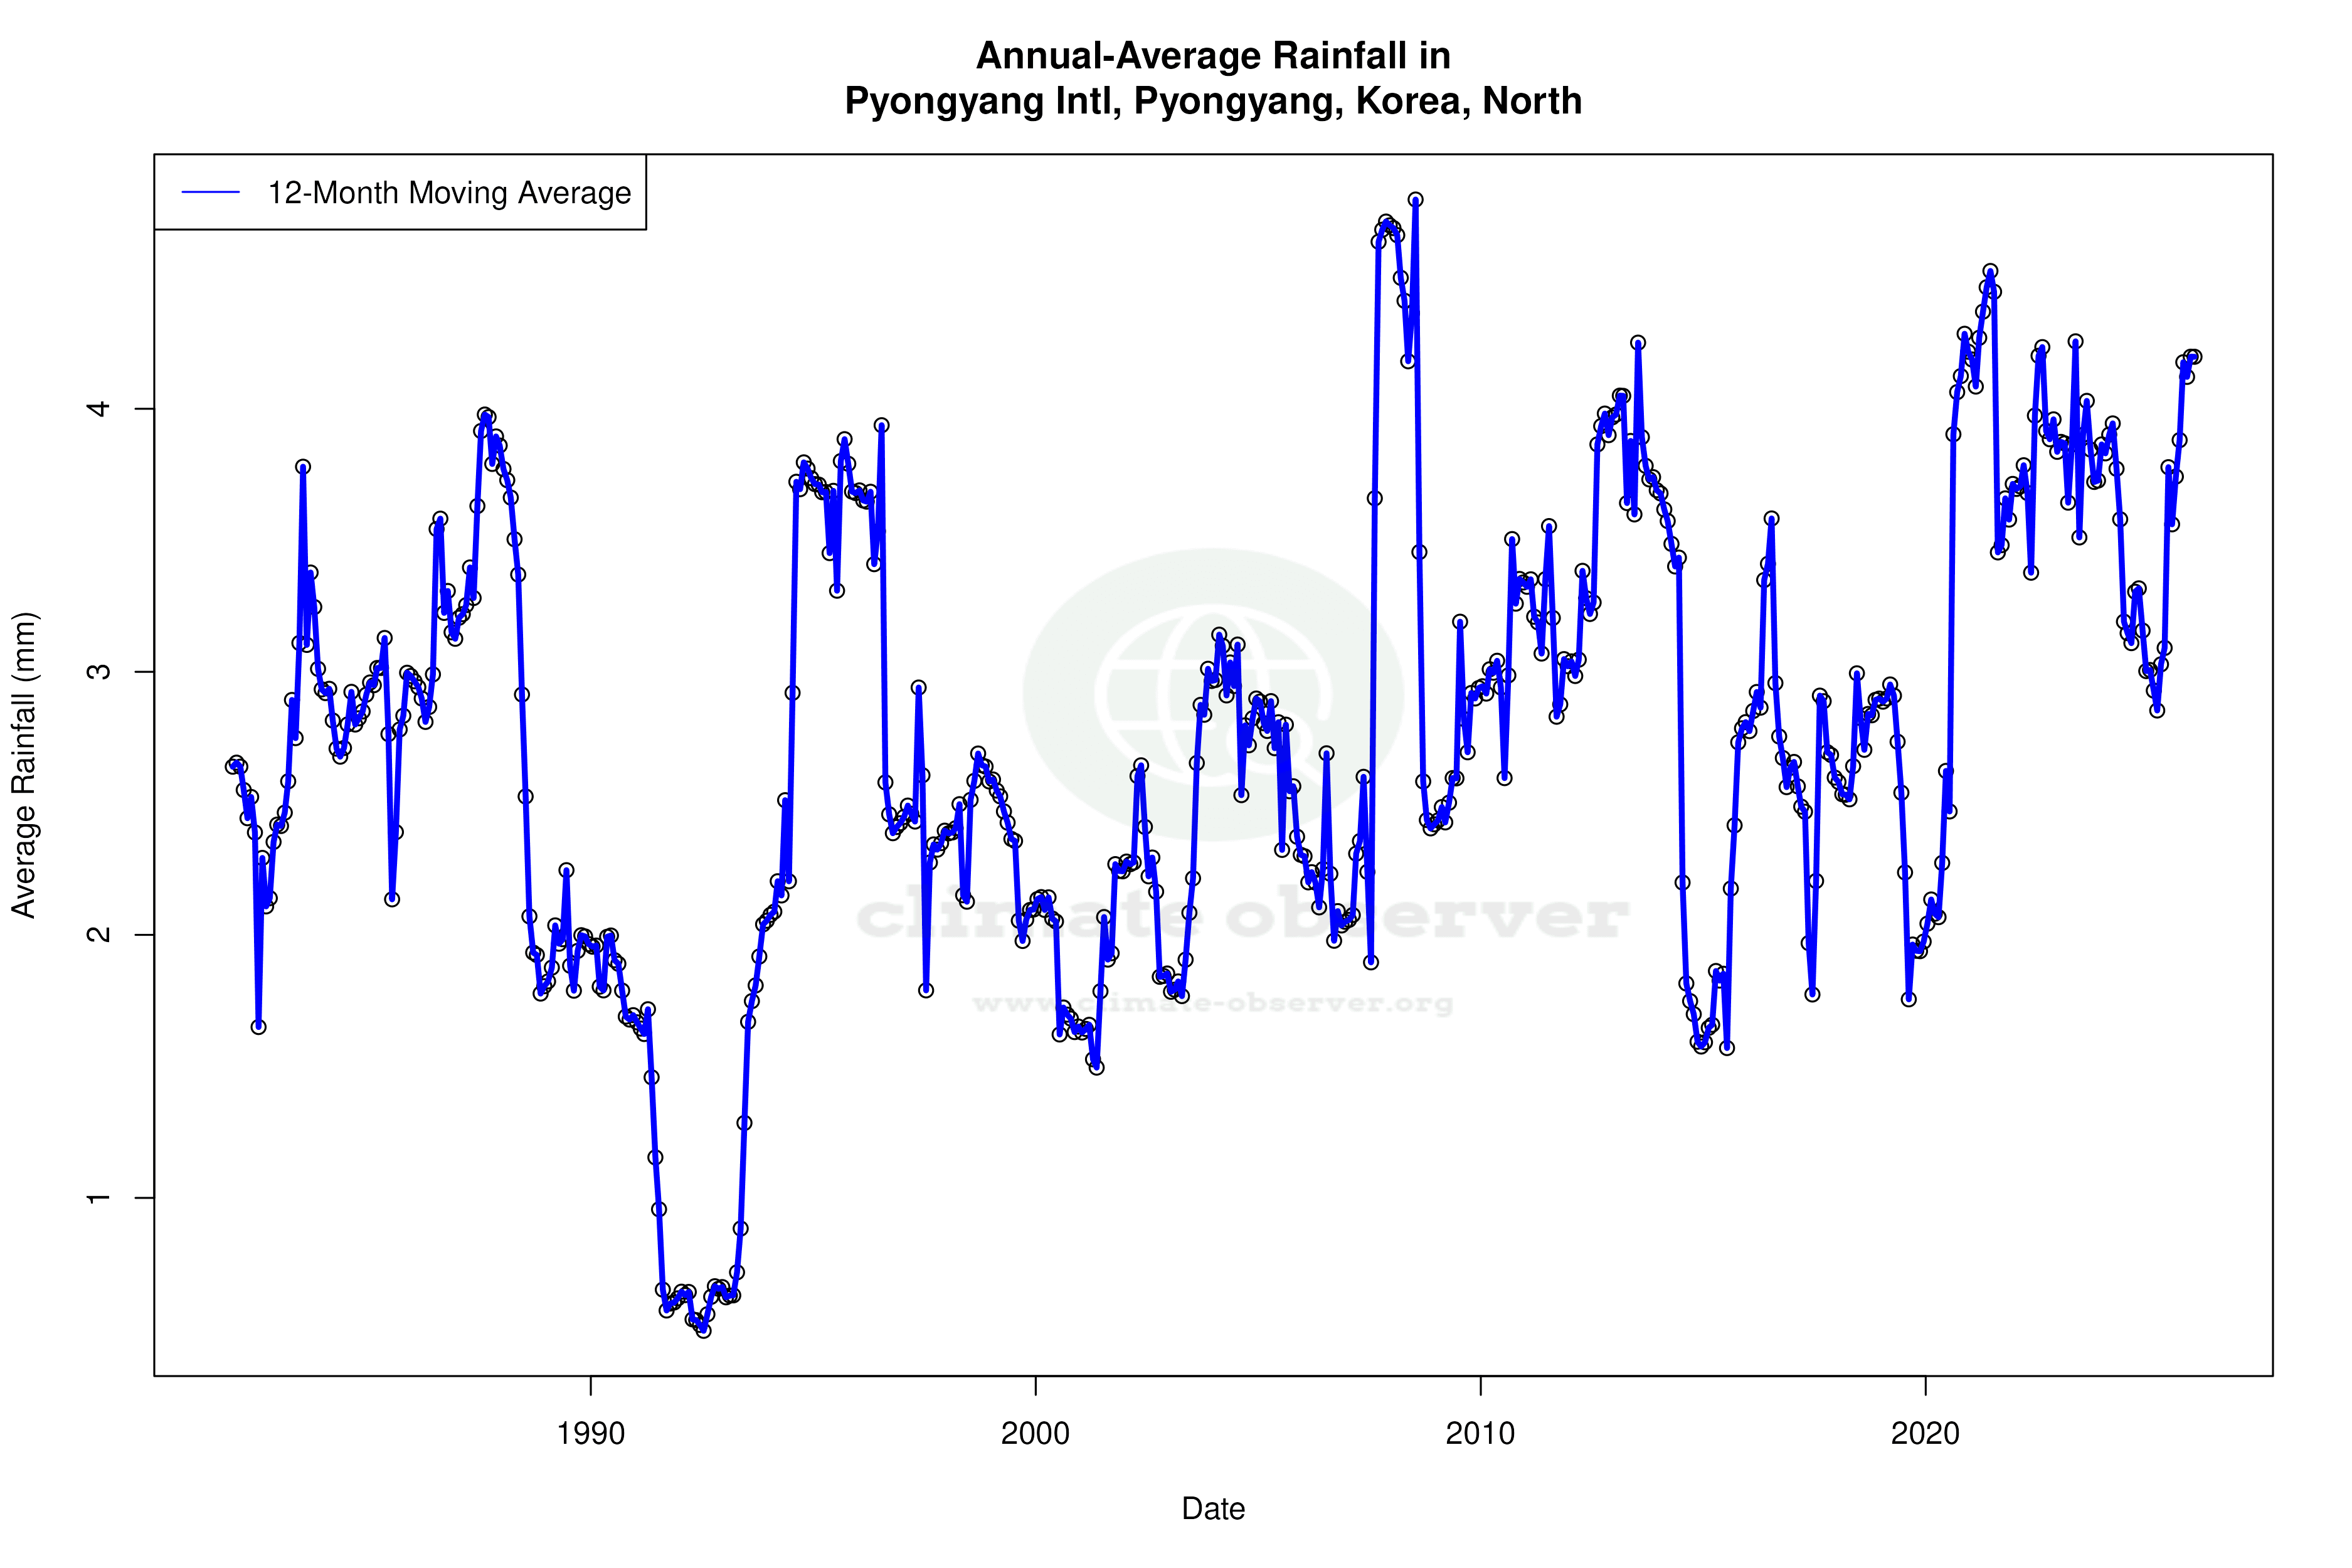
Precipitation Patterns: A Shift Towards Even Distribution
The Precipitation Concentration Index (PCI) for Pyongyang has decreased from a baseline of 20.27 to a current value of 16.00. This change indicates a more even distribution of rainfall throughout the year, as a lower PCI suggests less concentration of precipitation in fewer events. Such a shift could mean reduced risk of extreme rainfall events, which aligns with North Korea's efforts to mitigate flood risks and improve water management.
Regional Climate Goals and Implications
North Korea has been actively pursuing climate resilience strategies, focusing on sustainable agriculture and infrastructure improvements. The observed warming trend in low temperatures and the more evenly distributed precipitation support these goals by potentially reducing the frequency of extreme weather events and enhancing agricultural productivity. However, the cooling trend in high temperatures over the past decade may require adaptive measures to maintain crop yields during the summer months.
Conclusion: A Complex Climate Landscape
Pyongyang International Airport's climate profile reflects a dynamic interplay of warming trends and evolving precipitation patterns. The contrasting temperature trends over the past decade highlight the complexity of local climate dynamics, necessitating continued monitoring and adaptation to support regional climate resilience and sustainability initiatives.
Station Statistics
10-Year Trend
High: -2.16 °C/decade
Low: -0.06 °C/decade
Rain: +0.42 mm/decade
25-Year Trend
High: +0.24 °C/decade
Low: +0.63 °C/decade
Rain: +0.34 mm/decade
50-Year Trend
High: +0.28 °C/decade
Low: +0.64 °C/decade
Rain: +0.22 mm/decade
All-Time Trend
High: +0.23 °C/decade
Low: +0.64 °C/decade
Rain: +0.22 mm/decade
Percentage Above-Average Days
Last 12 Months: 53.4%
This Year: 70.0%
Precipitation Concentration Index (PCI) ℹ️
Last 12 Months: 15.8
Historical Average: 20.7
Percentile Rank of Last 12 Months ℹ️
High: 14th percentile
Low: 33rd percentile
Rain: 51st percentile
Change in Variance ℹ️
High: +0.6%
Low: -0.6%
Intraday: -7.1%
Data Coverage
82.3%
First Year of Data
1950
Station Location
Historical Weather Records
| Max High | Avg High | Min High | Max Avg | Avg Avg | Min Avg | Max Low | Avg Low | Min Low | Max Precipitation | Avg Precipitation | Max Snow | Avg Snow | |
|---|---|---|---|---|---|---|---|---|---|---|---|---|---|
| Record | 37.9 °C | — | -16.1 °C | 31.9 °C | — | -20.4 °C | 28.6 °C | — | -26.5 °C | 232.9 mm | — | — | — |
| January | 12.0 °C | -1.1 °C | -16.1 °C | 6.5 °C | -6.1 °C | -20.4 °C | 2.7 °C | -11.3 °C | -26.5 °C | 24.9 mm | 0.4 mm | — | — |
| February | 16.0 °C | 2.4 °C | -12.3 °C | 11.3 °C | -2.7 °C | -16.5 °C | 5.3 °C | -8.1 °C | -23.4 °C | 43.3 mm | 0.5 mm | — | — |
| March | 22.4 °C | 9.1 °C | -8.9 °C | 16.0 °C | 3.5 °C | -11.9 °C | 9.8 °C | -2.2 °C | -16.1 °C | 46.8 mm | 0.8 mm | — | — |
| April | 29.1 °C | 17.3 °C | 1.1 °C | 21.6 °C | 11.0 °C | -2.6 °C | 15.9 °C | 4.5 °C | -5.1 °C | 83.1 mm | 1.8 mm | — | — |
| May | 33.9 °C | 23.2 °C | 9.6 °C | 26.3 °C | 17.0 °C | 6.8 °C | 19.1 °C | 10.7 °C | 2.2 °C | 82.0 mm | 2.4 mm | — | — |
| June | 36.0 °C | 27.0 °C | 15.0 °C | 27.7 °C | 21.4 °C | 13.1 °C | 24.5 °C | 16.5 °C | 7.0 °C | 151.9 mm | 3.5 mm | — | — |
| July | 37.9 °C | 28.8 °C | 19.0 °C | 30.6 °C | 24.5 °C | 15.0 °C | 27.0 °C | 20.8 °C | 11.1 °C | 232.9 mm | 9.1 mm | — | — |
| August | 37.9 °C | 29.2 °C | 18.1 °C | 31.9 °C | 24.7 °C | 16.2 °C | 28.6 °C | 20.8 °C | 12.0 °C | 223.0 mm | 7.7 mm | — | — |
| September | 32.2 °C | 25.2 °C | 14.6 °C | 28.5 °C | 19.6 °C | 7.9 °C | 23.6 °C | 14.8 °C | 3.6 °C | 178.1 mm | 2.9 mm | — | — |
| October | 29.9 °C | 18.6 °C | 1.0 °C | 22.9 °C | 12.4 °C | -1.8 °C | 20.8 °C | 6.9 °C | -6.0 °C | 72.8 mm | 1.4 mm | — | — |
| November | 25.5 °C | 9.6 °C | -7.8 °C | 20.1 °C | 4.5 °C | -10.8 °C | 15.6 °C | -0.3 °C | -14.0 °C | 51.3 mm | 1.4 mm | — | — |
| December | 15.0 °C | 1.4 °C | -15.0 °C | 10.5 °C | -3.3 °C | -18.1 °C | 7.8 °C | -7.7 °C | -22.8 °C | 38.8 mm | 0.5 mm | — | — |
Data Visualisations
Remove WatermarksCurrent Year Climate Trends vs Historical


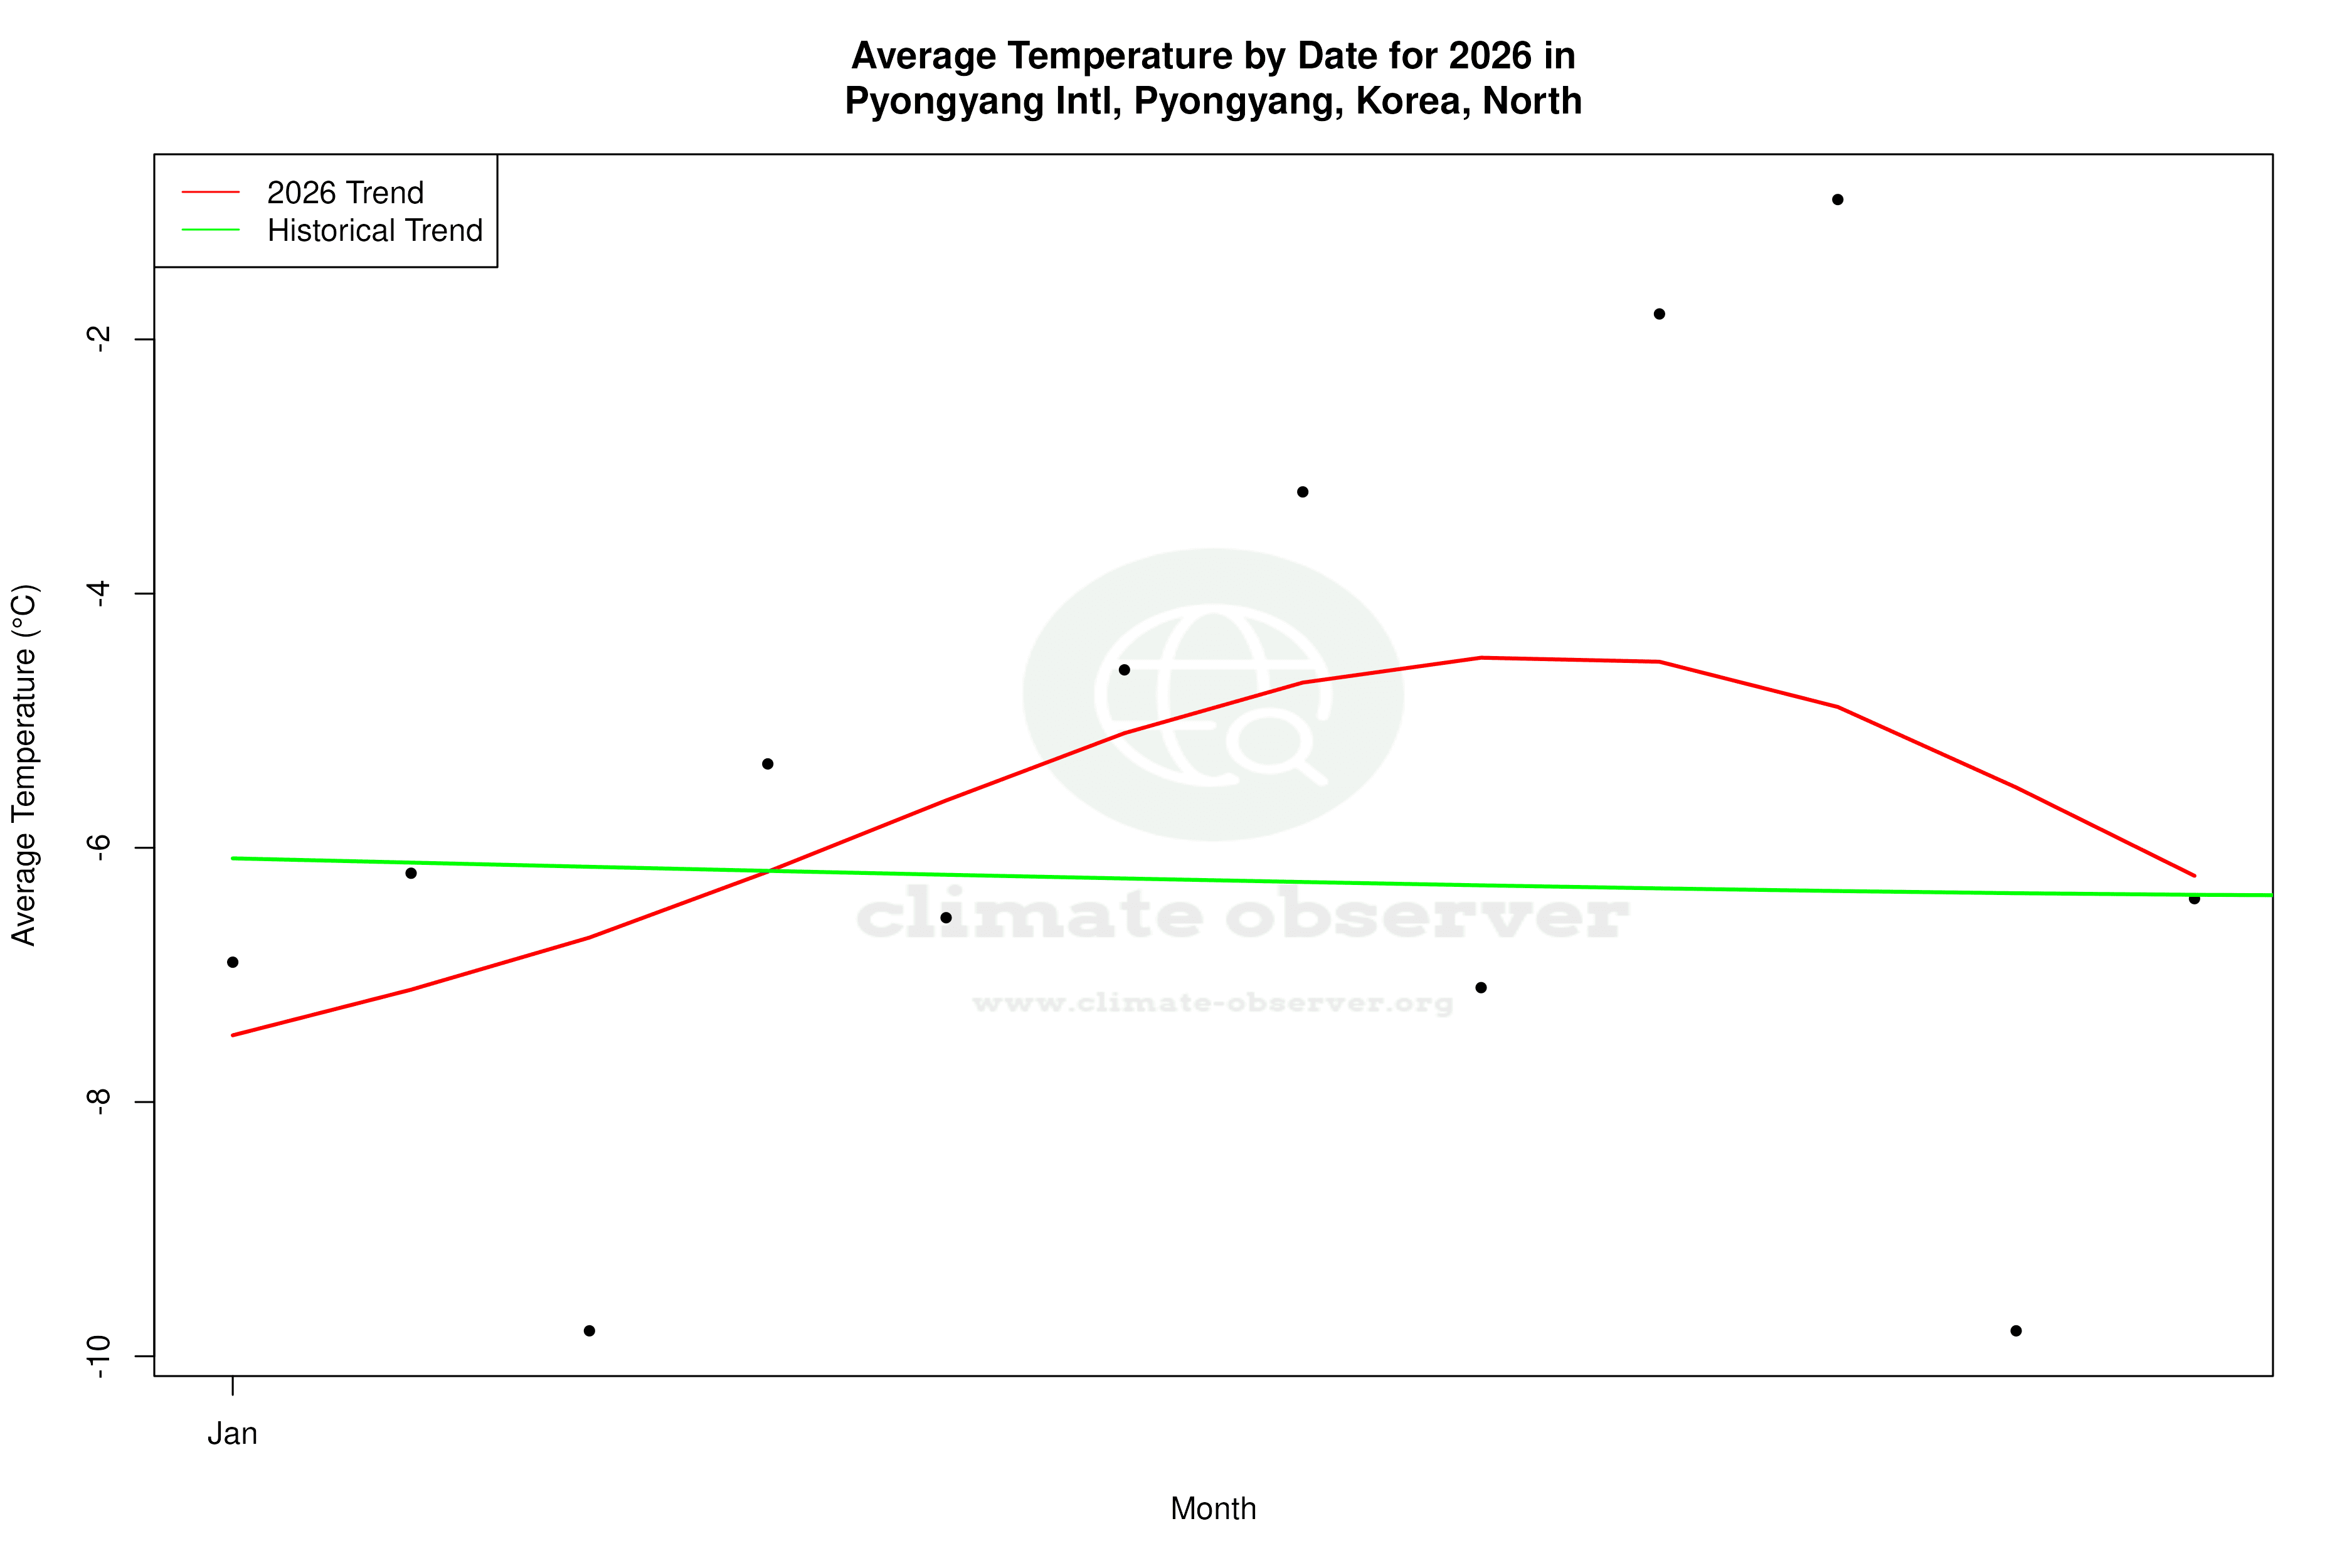

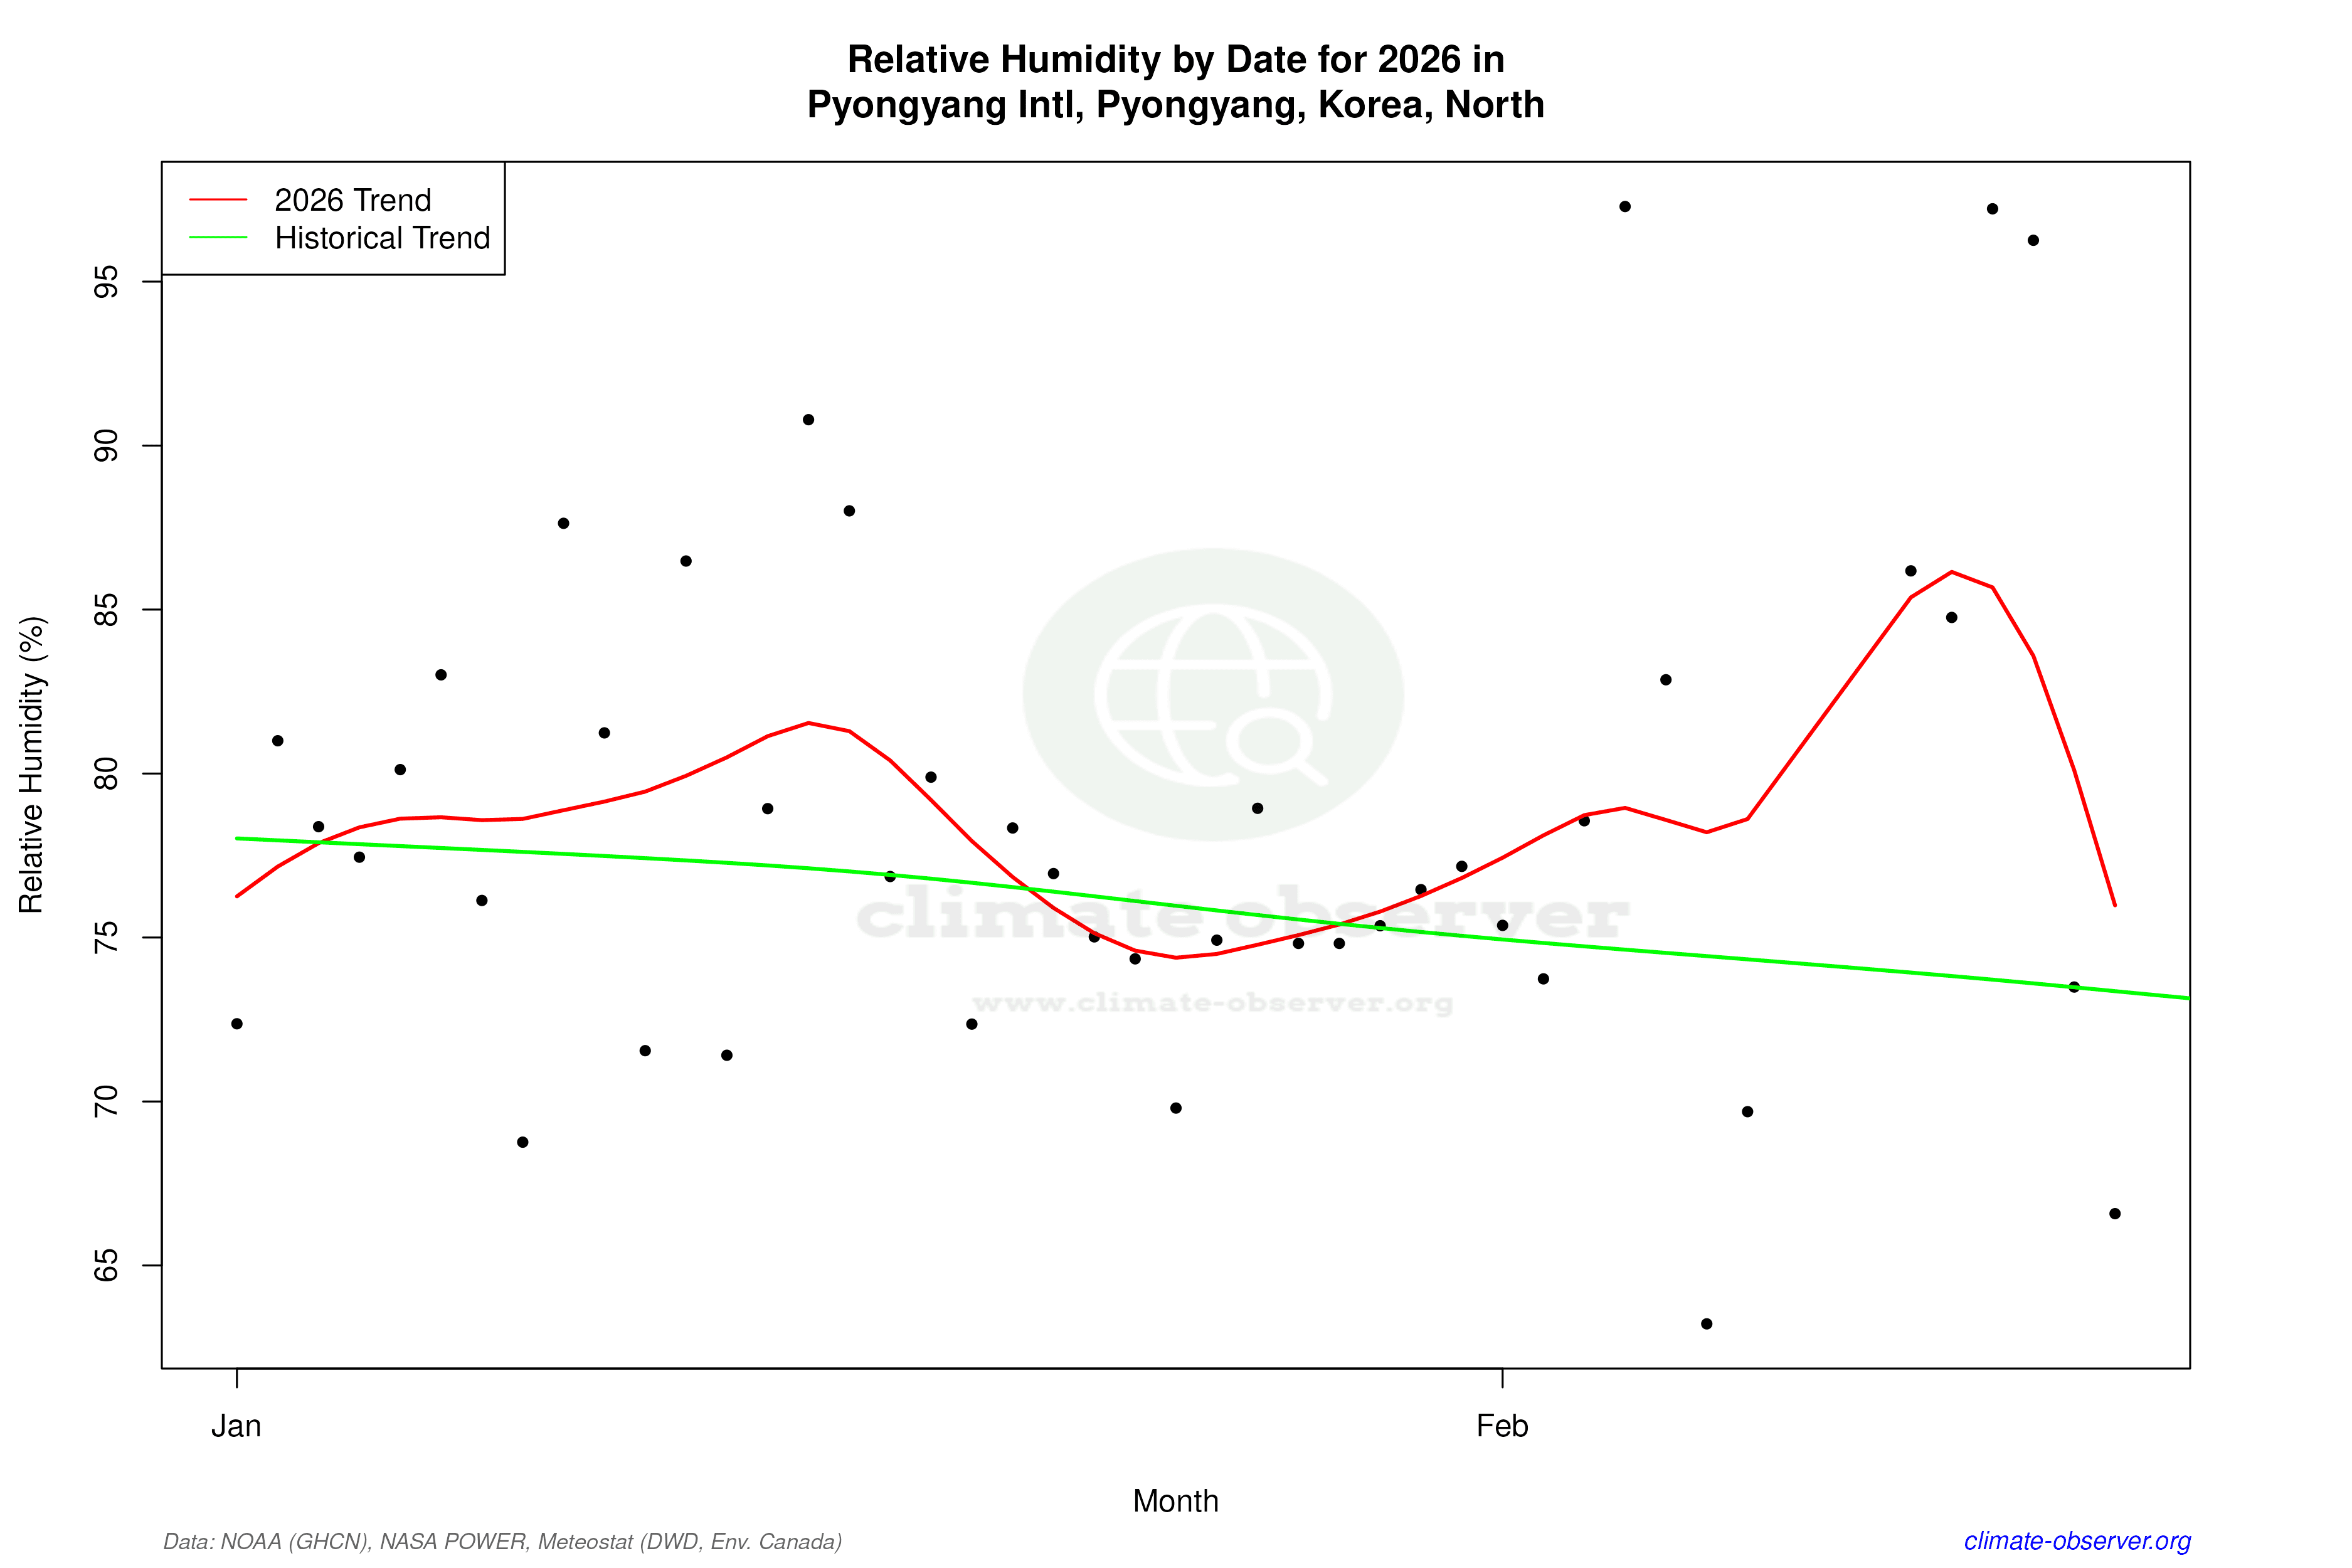

Max Temperature this Year | 1 of 6
Climate 12-Month Moving Averages

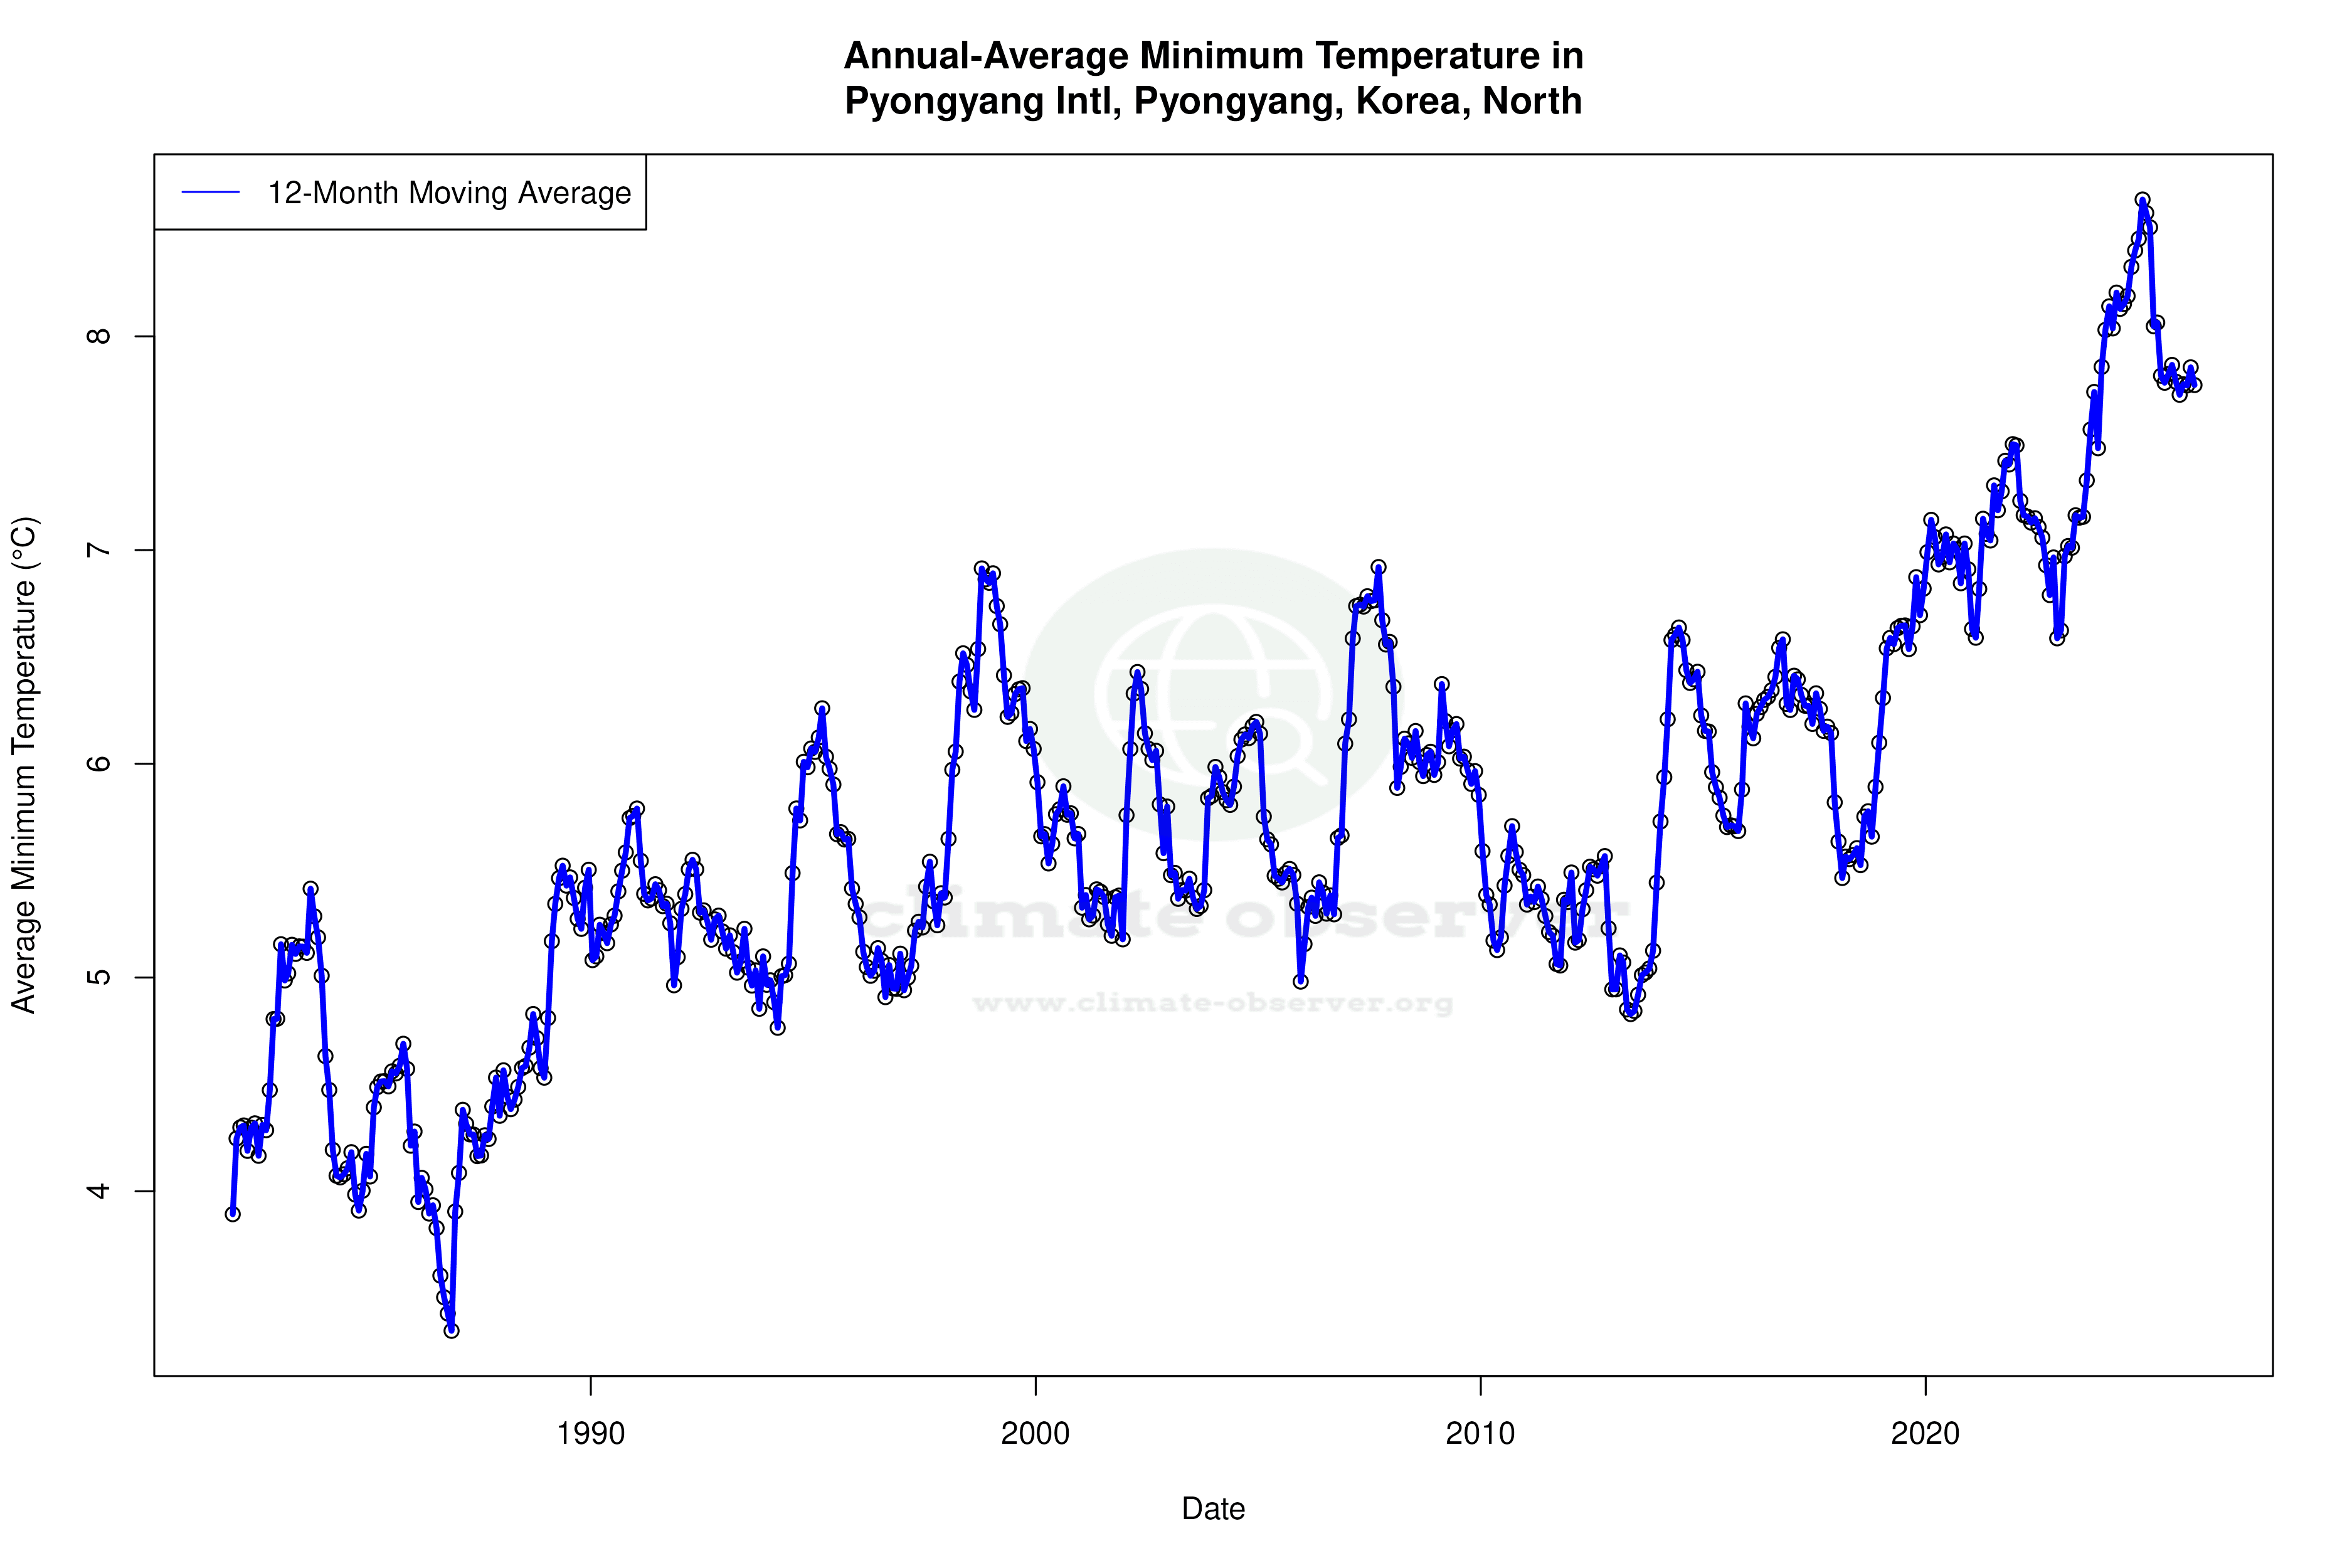
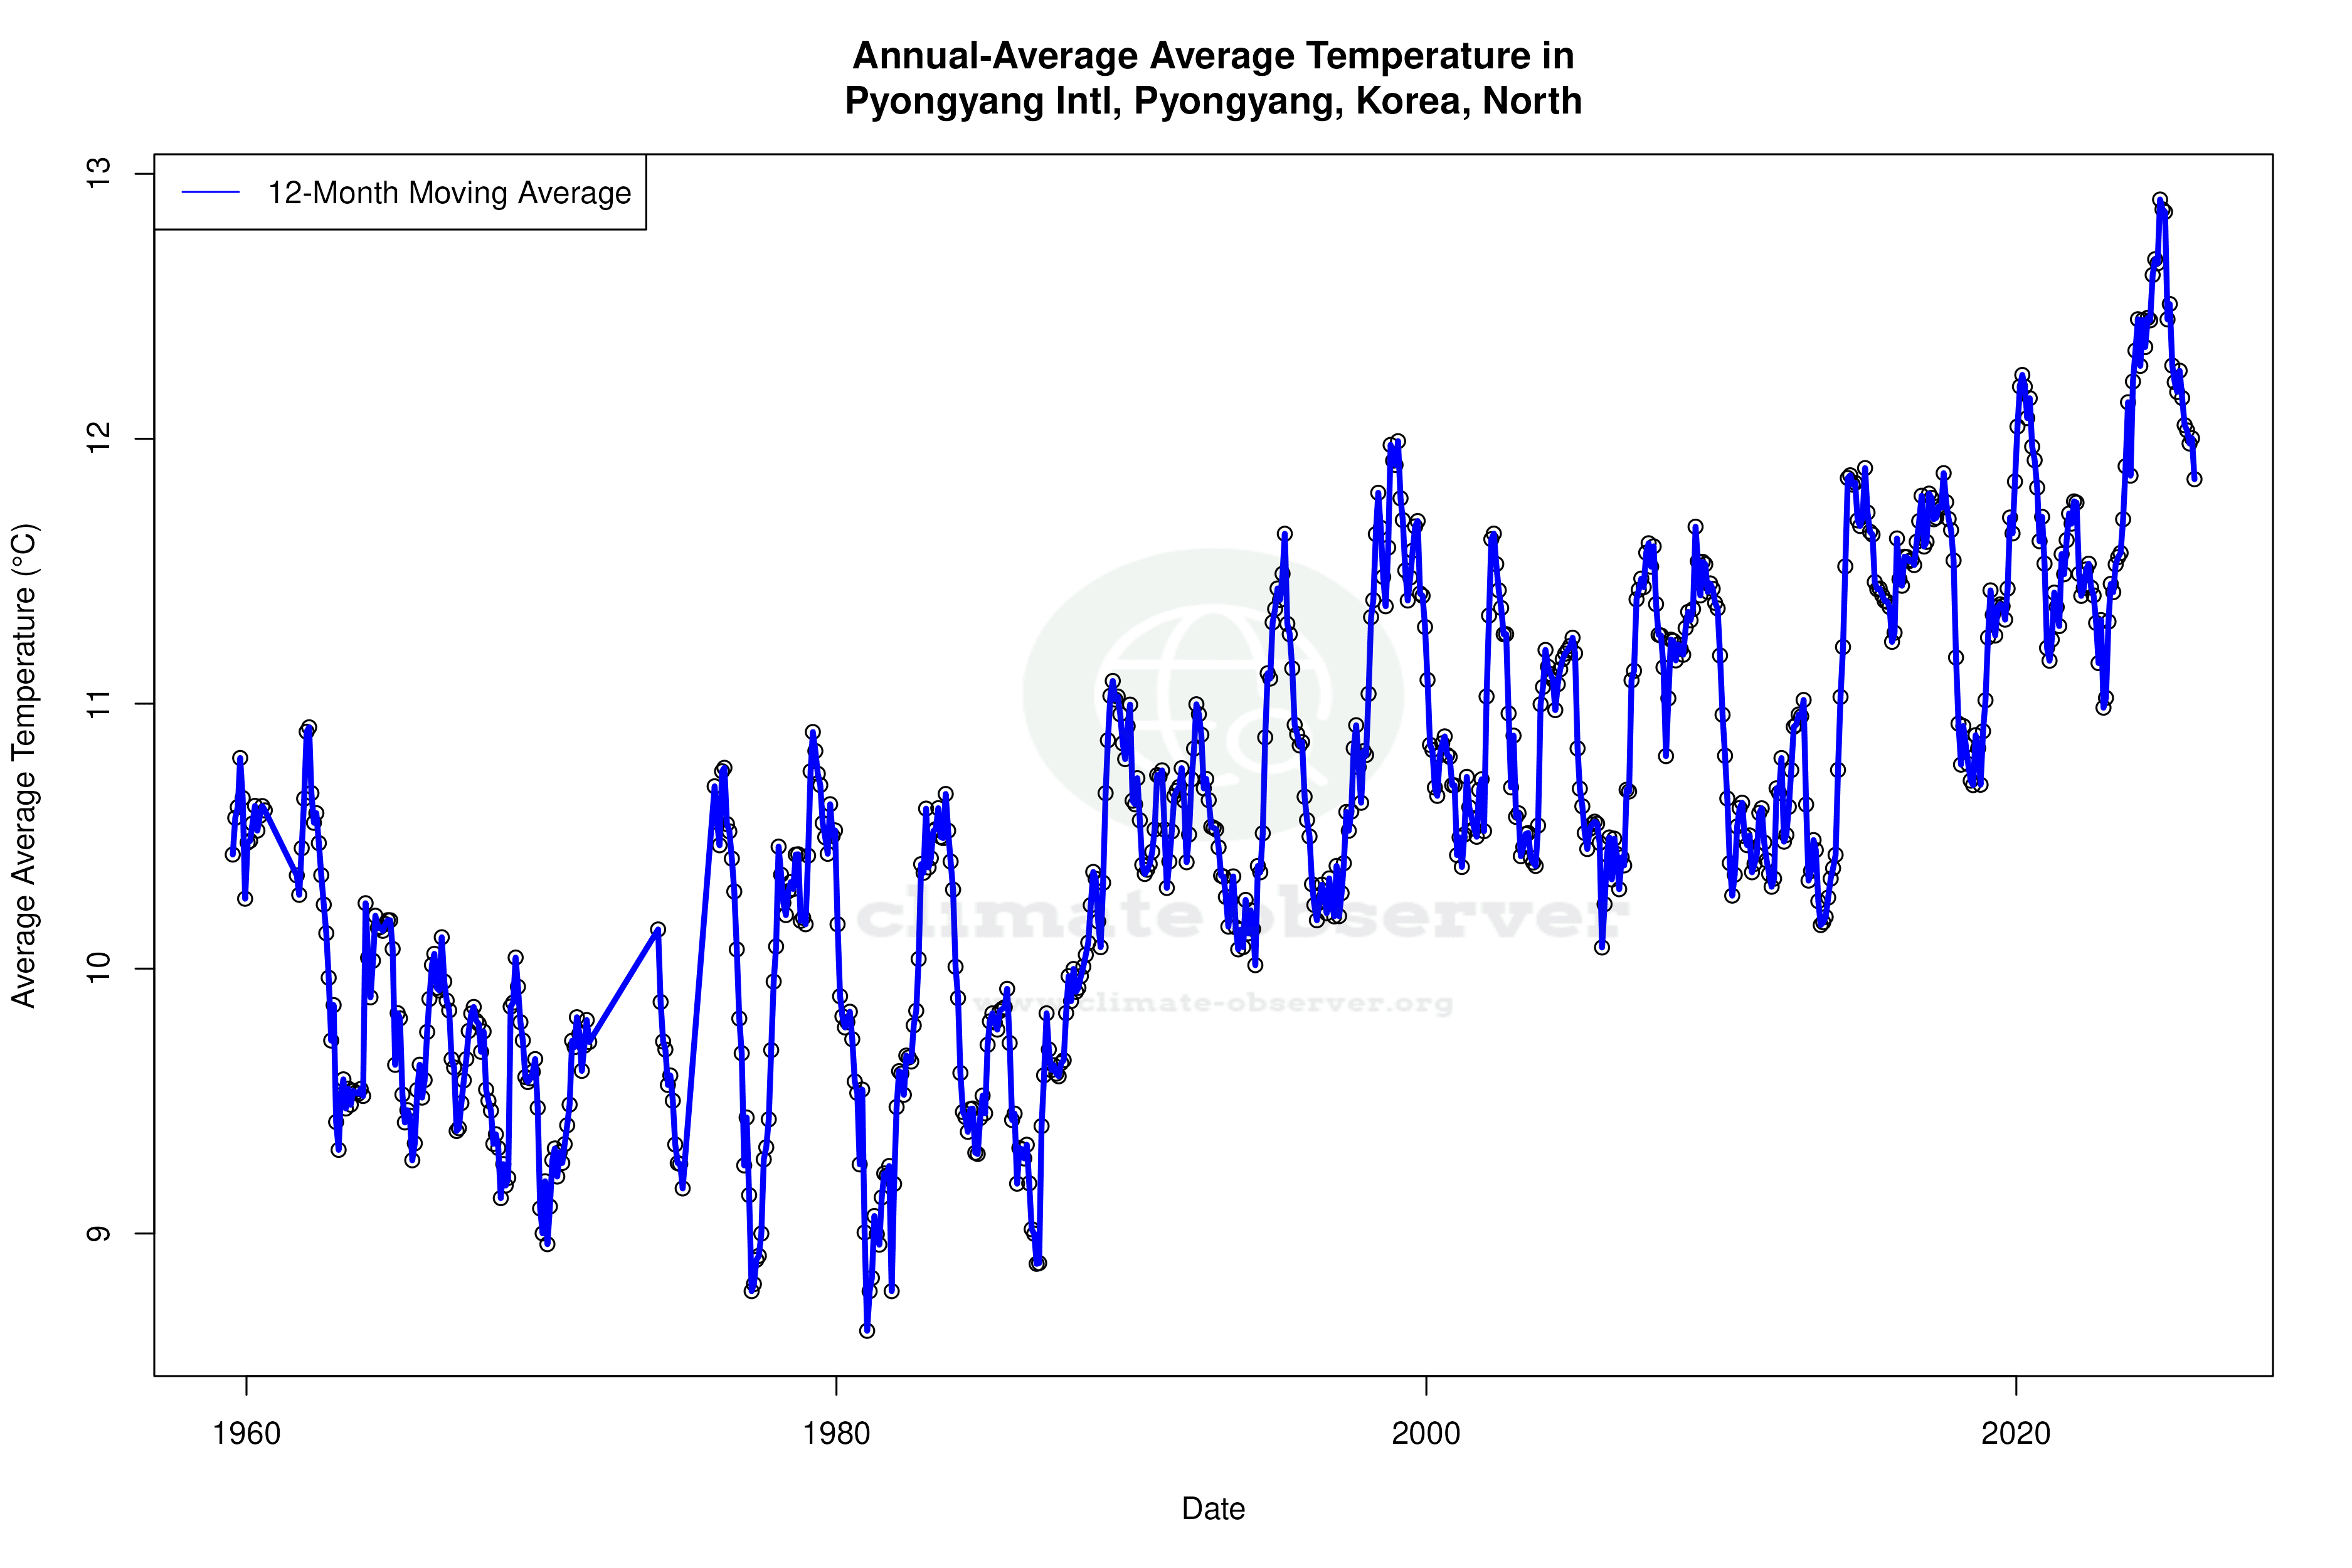


Max Temperature 12-Month MA | 1 of 6
Daily Data Points and Averages Throughout the Year


Average Max Temperature Throughout Year | 1 of 5
