Climate for Station: Ulleungdo, North Gyeongsang, Korea, South
Loading live weather...
Climate Analysis & Overview
Ulleungdo's climate is characterized by a warming trend over the long term, with a noticeable cooling in the past decade. Precipitation patterns have shifted towards a more even distribution, reflecting broader regional climate goals for stability.
Geographic Influence and Climate Classification
Ulleungdo, an island located at 37.483°N, 130.9°E, falls under the Köppen climate classification of Cfa, indicating a humid subtropical climate. This classification is influenced by its maritime position in the East Sea, which moderates temperature extremes and contributes to high humidity levels. The island's rugged terrain, characterised by volcanic origins, plays a pivotal role in shaping its microclimates, where elevation can lead to cooler temperatures and varied precipitation patterns.
Temperature Trends: A Tale of Two Timeframes
Examining the temperature trends reveals a nuanced narrative. Over the past decade, there has been a cooling trend with highs decreasing by 0.24°C (0.43°F) and lows by 0.04°C (0.07°F). This contrasts with the all-time trends, where highs have risen by 0.13°C (0.23°F) and lows by a more pronounced 0.35°C (0.63°F). This indicates a longer-term warming pattern, despite recent cooling, which could be attributed to natural variability or localised climatic factors.
Precipitation Patterns: A Shift Towards Evenness
The Precipitation Concentration Index (PCI) for Ulleungdo has decreased from a baseline of 12.70 to a current value of 11.26. This reduction suggests a more even distribution of rainfall events across the year, moving away from concentrated, extreme precipitation episodes. Such a shift aligns with South Korea's regional climate objectives, which aim to mitigate the impacts of intense rainfall and reduce the risk of flooding and landslides.
Temperature Extremes: Records in Context
Ulleungdo's recorded temperature extremes highlight the island's climatic variability. The highest temperature on record is 39.7°C (103.5°F), while the lowest is -13.6°C (7.5°F). These figures underscore the island's capacity to experience significant thermal oscillations, despite its generally moderate climate, influenced by its maritime setting.
Regional Climate Goals and Recent Weather Events
South Korea's commitment to addressing climate change is evident in its efforts to stabilise regional climates, including Ulleungdo's. Recent weather events, such as typhoons and heavy rainfall, have tested these initiatives. The island's evolving climate profile, marked by a long-term warming trend and more evenly distributed precipitation, reflects both the challenges and progress in adapting to a changing climate landscape.
Station Statistics
10-Year Trend
High: -0.00 °C/decade
Low: +0.20 °C/decade
Rain: -1.89 mm/decade
25-Year Trend
High: +0.01 °C/decade
Low: +0.24 °C/decade
Rain: -0.94 mm/decade
50-Year Trend
High: +0.17 °C/decade
Low: +0.70 °C/decade
Rain: +0.11 mm/decade
All-Time Trend
High: +0.14 °C/decade
Low: +0.36 °C/decade
Rain: +0.03 mm/decade
Percentage Above-Average Days
Last 12 Months: 52.9%
This Year: 56.7%
Precipitation Concentration Index (PCI) ℹ️
Last 12 Months: 9.4
Historical Average: 11.1
Percentile Rank of Last 12 Months ℹ️
High: 99th percentile
Low: 99th percentile
Rain: 14th percentile
Change in Variance ℹ️
High: -21.7%
Low: -1.5%
Intraday: -3.2%
Data Coverage
90.3%
First Year of Data
1939
Station Location
Historical Weather Records
| Max High | Avg High | Min High | Max Avg | Avg Avg | Min Avg | Max Low | Avg Low | Min Low | Max Precipitation | Avg Precipitation | Max Snow | Avg Snow | |
|---|---|---|---|---|---|---|---|---|---|---|---|---|---|
| Record | 39.7 °C | — | -8.3 °C | 31.1 °C | — | -10.2 °C | 28.7 °C | — | -13.6 °C | 227.0 mm | — | — | — |
| January | 15.8 °C | 4.2 °C | -7.5 °C | 12.2 °C | 1.5 °C | -9.1 °C | 11.0 °C | -0.6 °C | -11.6 °C | 162.0 mm | 4.3 mm | — | — |
| February | 19.2 °C | 4.8 °C | -8.3 °C | 13.9 °C | 2.2 °C | -10.2 °C | 12.3 °C | -0.2 °C | -13.6 °C | 69.0 mm | 3.2 mm | — | — |
| March | 21.8 °C | 8.7 °C | -4.8 °C | 18.7 °C | 5.8 °C | -8.4 °C | 15.6 °C | 2.8 °C | -9.9 °C | 64.0 mm | 2.5 mm | — | — |
| April | 26.1 °C | 14.3 °C | 0.6 °C | 21.6 °C | 11.2 °C | 1.2 °C | 18.9 °C | 7.8 °C | -2.7 °C | 97.0 mm | 2.9 mm | — | — |
| May | 29.4 °C | 18.9 °C | 6.8 °C | 26.7 °C | 15.8 °C | 7.1 °C | 23.5 °C | 12.5 °C | 1.0 °C | 87.4 mm | 2.8 mm | — | — |
| June | 34.5 °C | 21.9 °C | 13.3 °C | 29.0 °C | 19.2 °C | 10.1 °C | 26.8 °C | 16.4 °C | 7.0 °C | 122.0 mm | 3.8 mm | — | — |
| July | 39.7 °C | 25.3 °C | 15.6 °C | 29.9 °C | 22.8 °C | 13.7 °C | 27.7 °C | 20.4 °C | 12.5 °C | 171.0 mm | 5.1 mm | — | — |
| August | 35.4 °C | 26.9 °C | 18.4 °C | 31.1 °C | 24.0 °C | 17.2 °C | 28.7 °C | 22.0 °C | 14.7 °C | 128.0 mm | 4.5 mm | — | — |
| September | 32.4 °C | 23.1 °C | 15.1 °C | 28.4 °C | 20.0 °C | 10.6 °C | 26.6 °C | 18.1 °C | 8.9 °C | 227.0 mm | 5.5 mm | — | — |
| October | 27.2 °C | 18.7 °C | 6.9 °C | 23.1 °C | 15.3 °C | 4.2 °C | 22.4 °C | 13.2 °C | 0.7 °C | 137.0 mm | 3.2 mm | — | — |
| November | 23.2 °C | 13.2 °C | 0.0 °C | 21.4 °C | 9.8 °C | -2.0 °C | 19.0 °C | 7.7 °C | -5.9 °C | 82.0 mm | 3.8 mm | — | — |
| December | 17.9 °C | 7.4 °C | -5.5 °C | 15.3 °C | 4.2 °C | -8.4 °C | 14.2 °C | 2.2 °C | -9.6 °C | 79.0 mm | 4.1 mm | — | — |
Data Visualisations
Remove WatermarksCurrent Year Climate Trends vs Historical


Max Temperature this Year | 1 of 6
Climate 12-Month Moving Averages


Max Temperature 12-Month MA | 1 of 6
Daily Data Points and Averages Throughout the Year

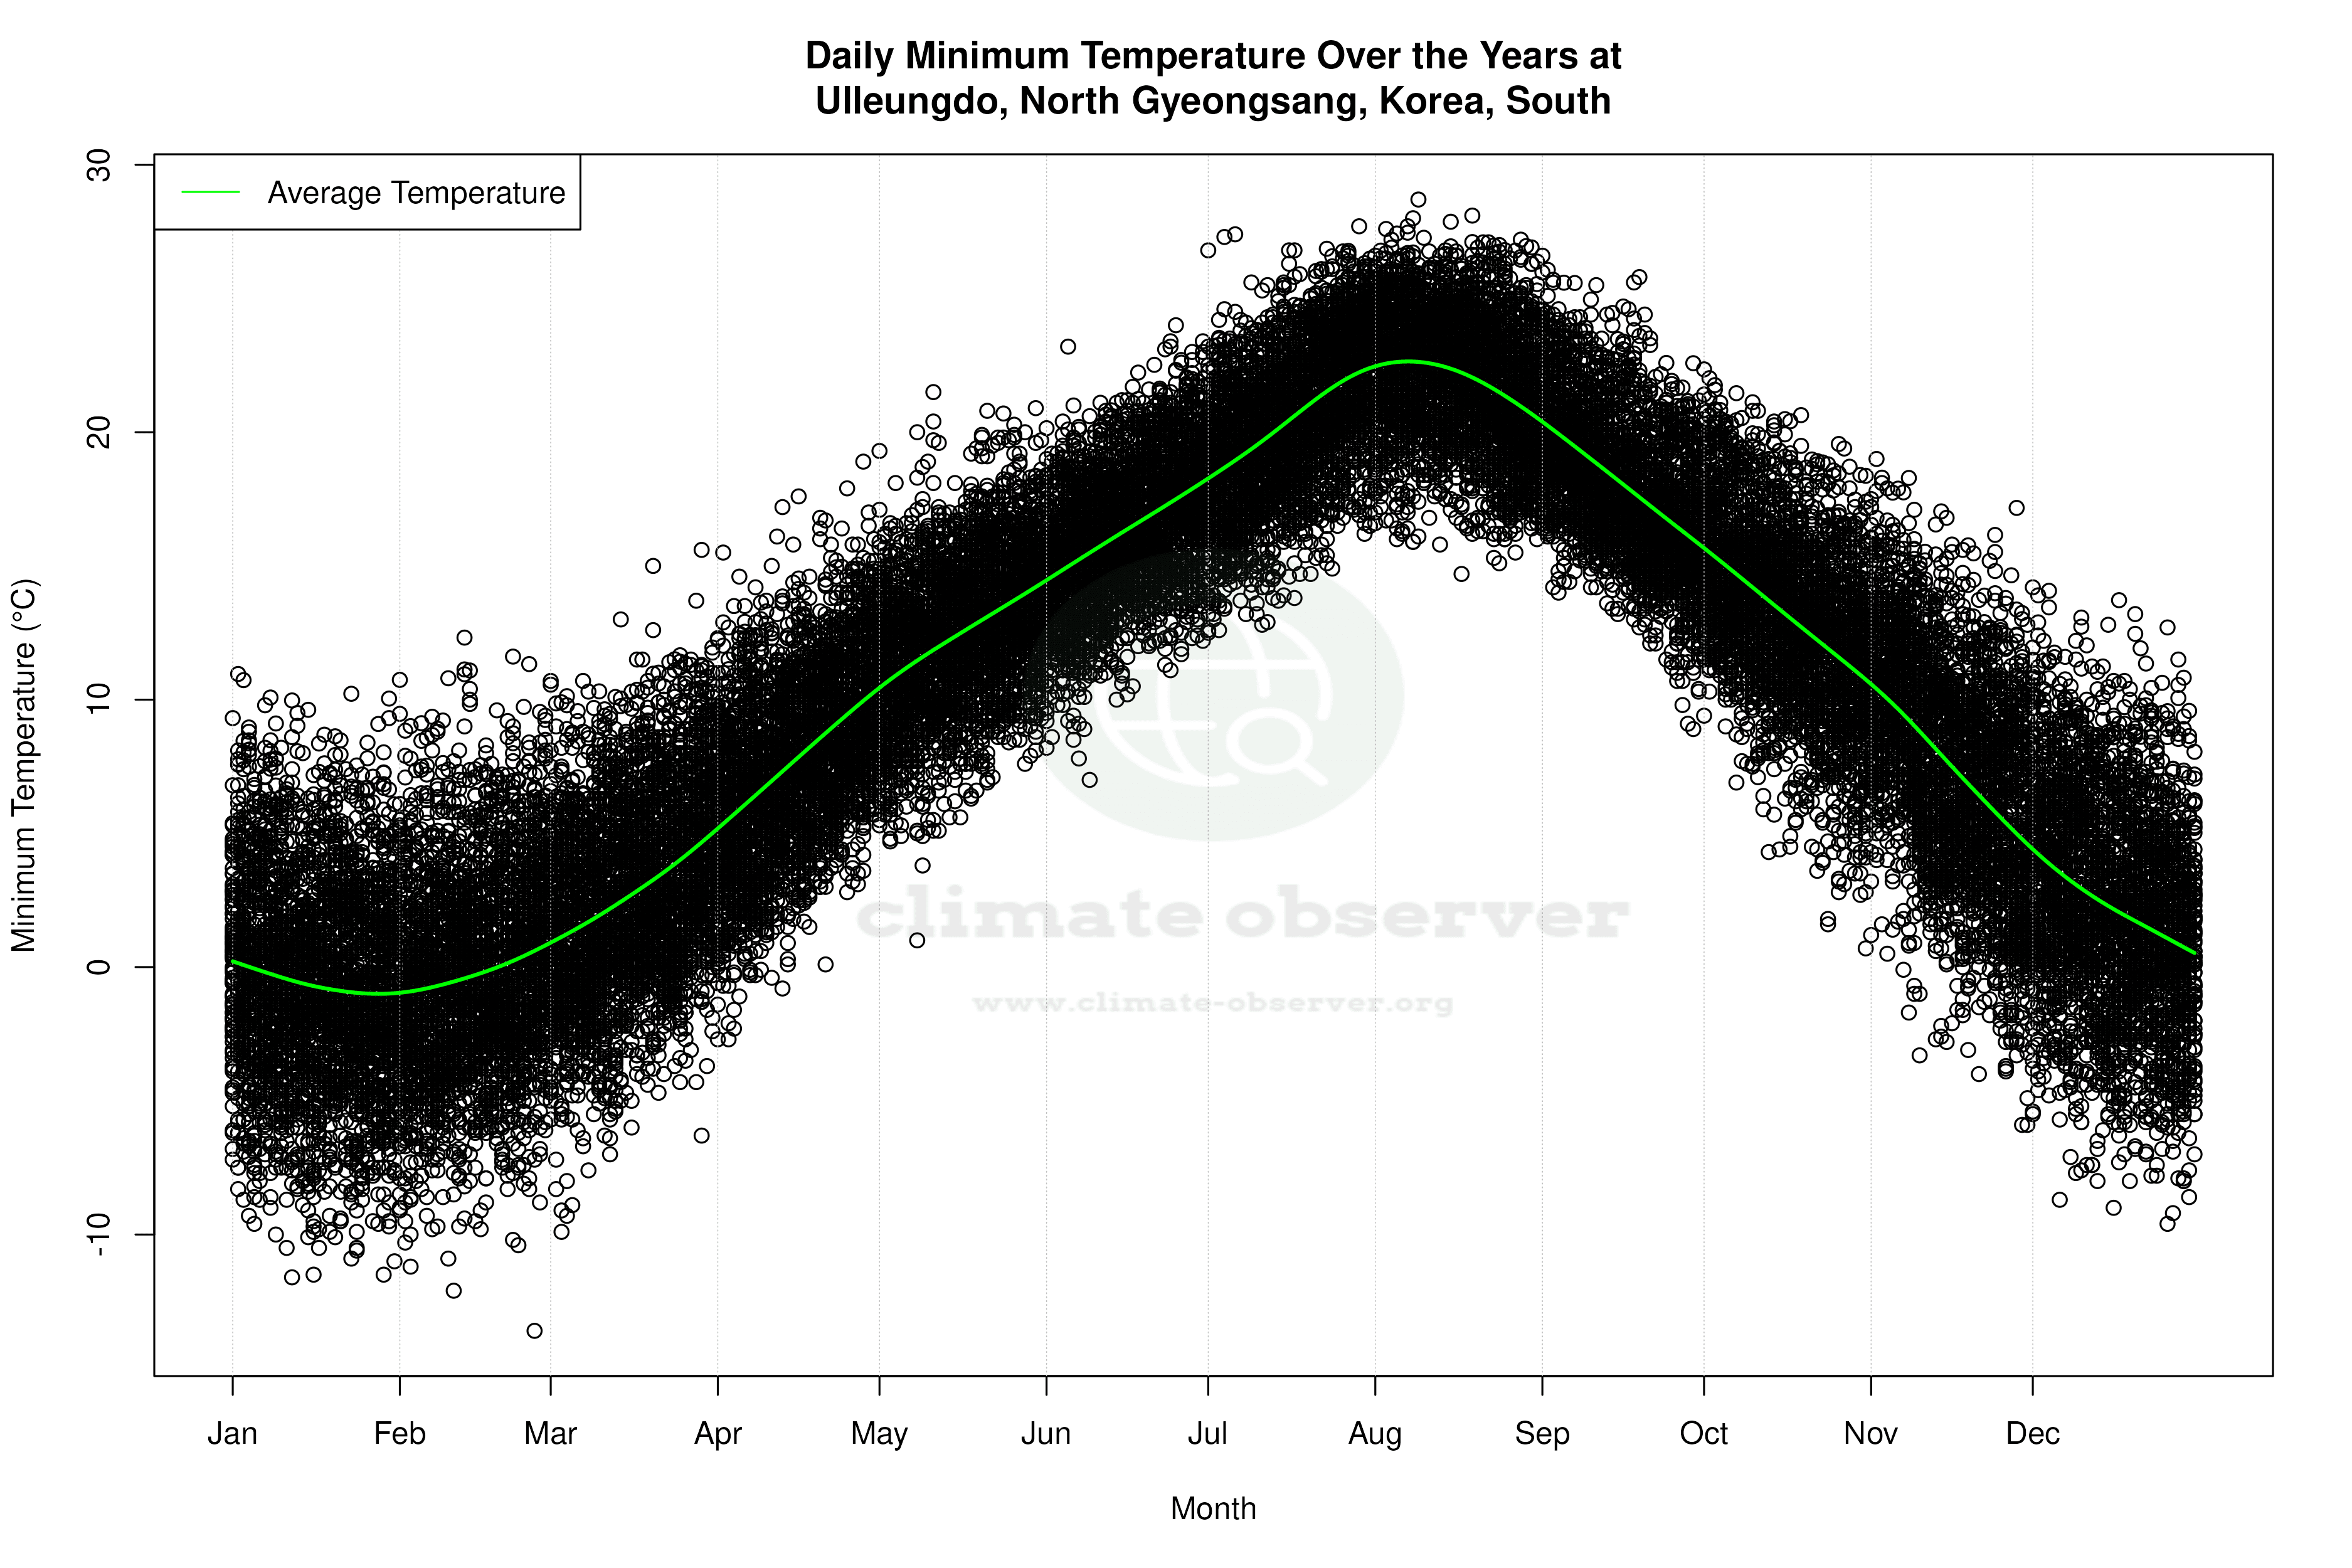


Average Max Temperature Throughout Year | 1 of 5
