Climate for Station: Mokpo, South Jeolla, Korea, South
Loading live weather...
Climate Analysis & Overview
Mokpo's climate is experiencing a warming trend, with significant increases in both high and low temperatures over the past decade. Precipitation is becoming more evenly distributed, potentially altering local weather patterns. These changes are critical in the context of South Korea's climate adaptation strategies.
Geographical Influence on Mokpo's Climate
Mokpo, located at 34.817°N, 126.383°E, is situated on the southwestern coast of South Korea. This region is classified under the Köppen climate classification as Cfa, indicating a humid subtropical climate with hot summers and mild winters. The proximity to the Yellow Sea moderates temperature extremes, contributing to the area's distinctive weather patterns. The local geography, including coastal influences, plays a pivotal role in shaping Mokpo's climate, providing a buffer against extreme temperature fluctuations but also exposing it to maritime weather systems.
Temperature Trends: A Decade of Warming
Over the past ten years, Mokpo has experienced a noticeable warming trend. High temperatures have increased by 0.41°C (0.74°F), while low temperatures have risen even more significantly by 1.09°C (1.96°F). These changes suggest a shift towards warmer conditions, which could have implications for local agriculture and energy consumption. This decade-long trend is more pronounced than the all-time trends, where highs have risen by 0.04°C (0.07°F) and lows by 0.13°C (0.23°F). The more rapid increase in recent years highlights the urgency for adaptive measures in response to climate change.
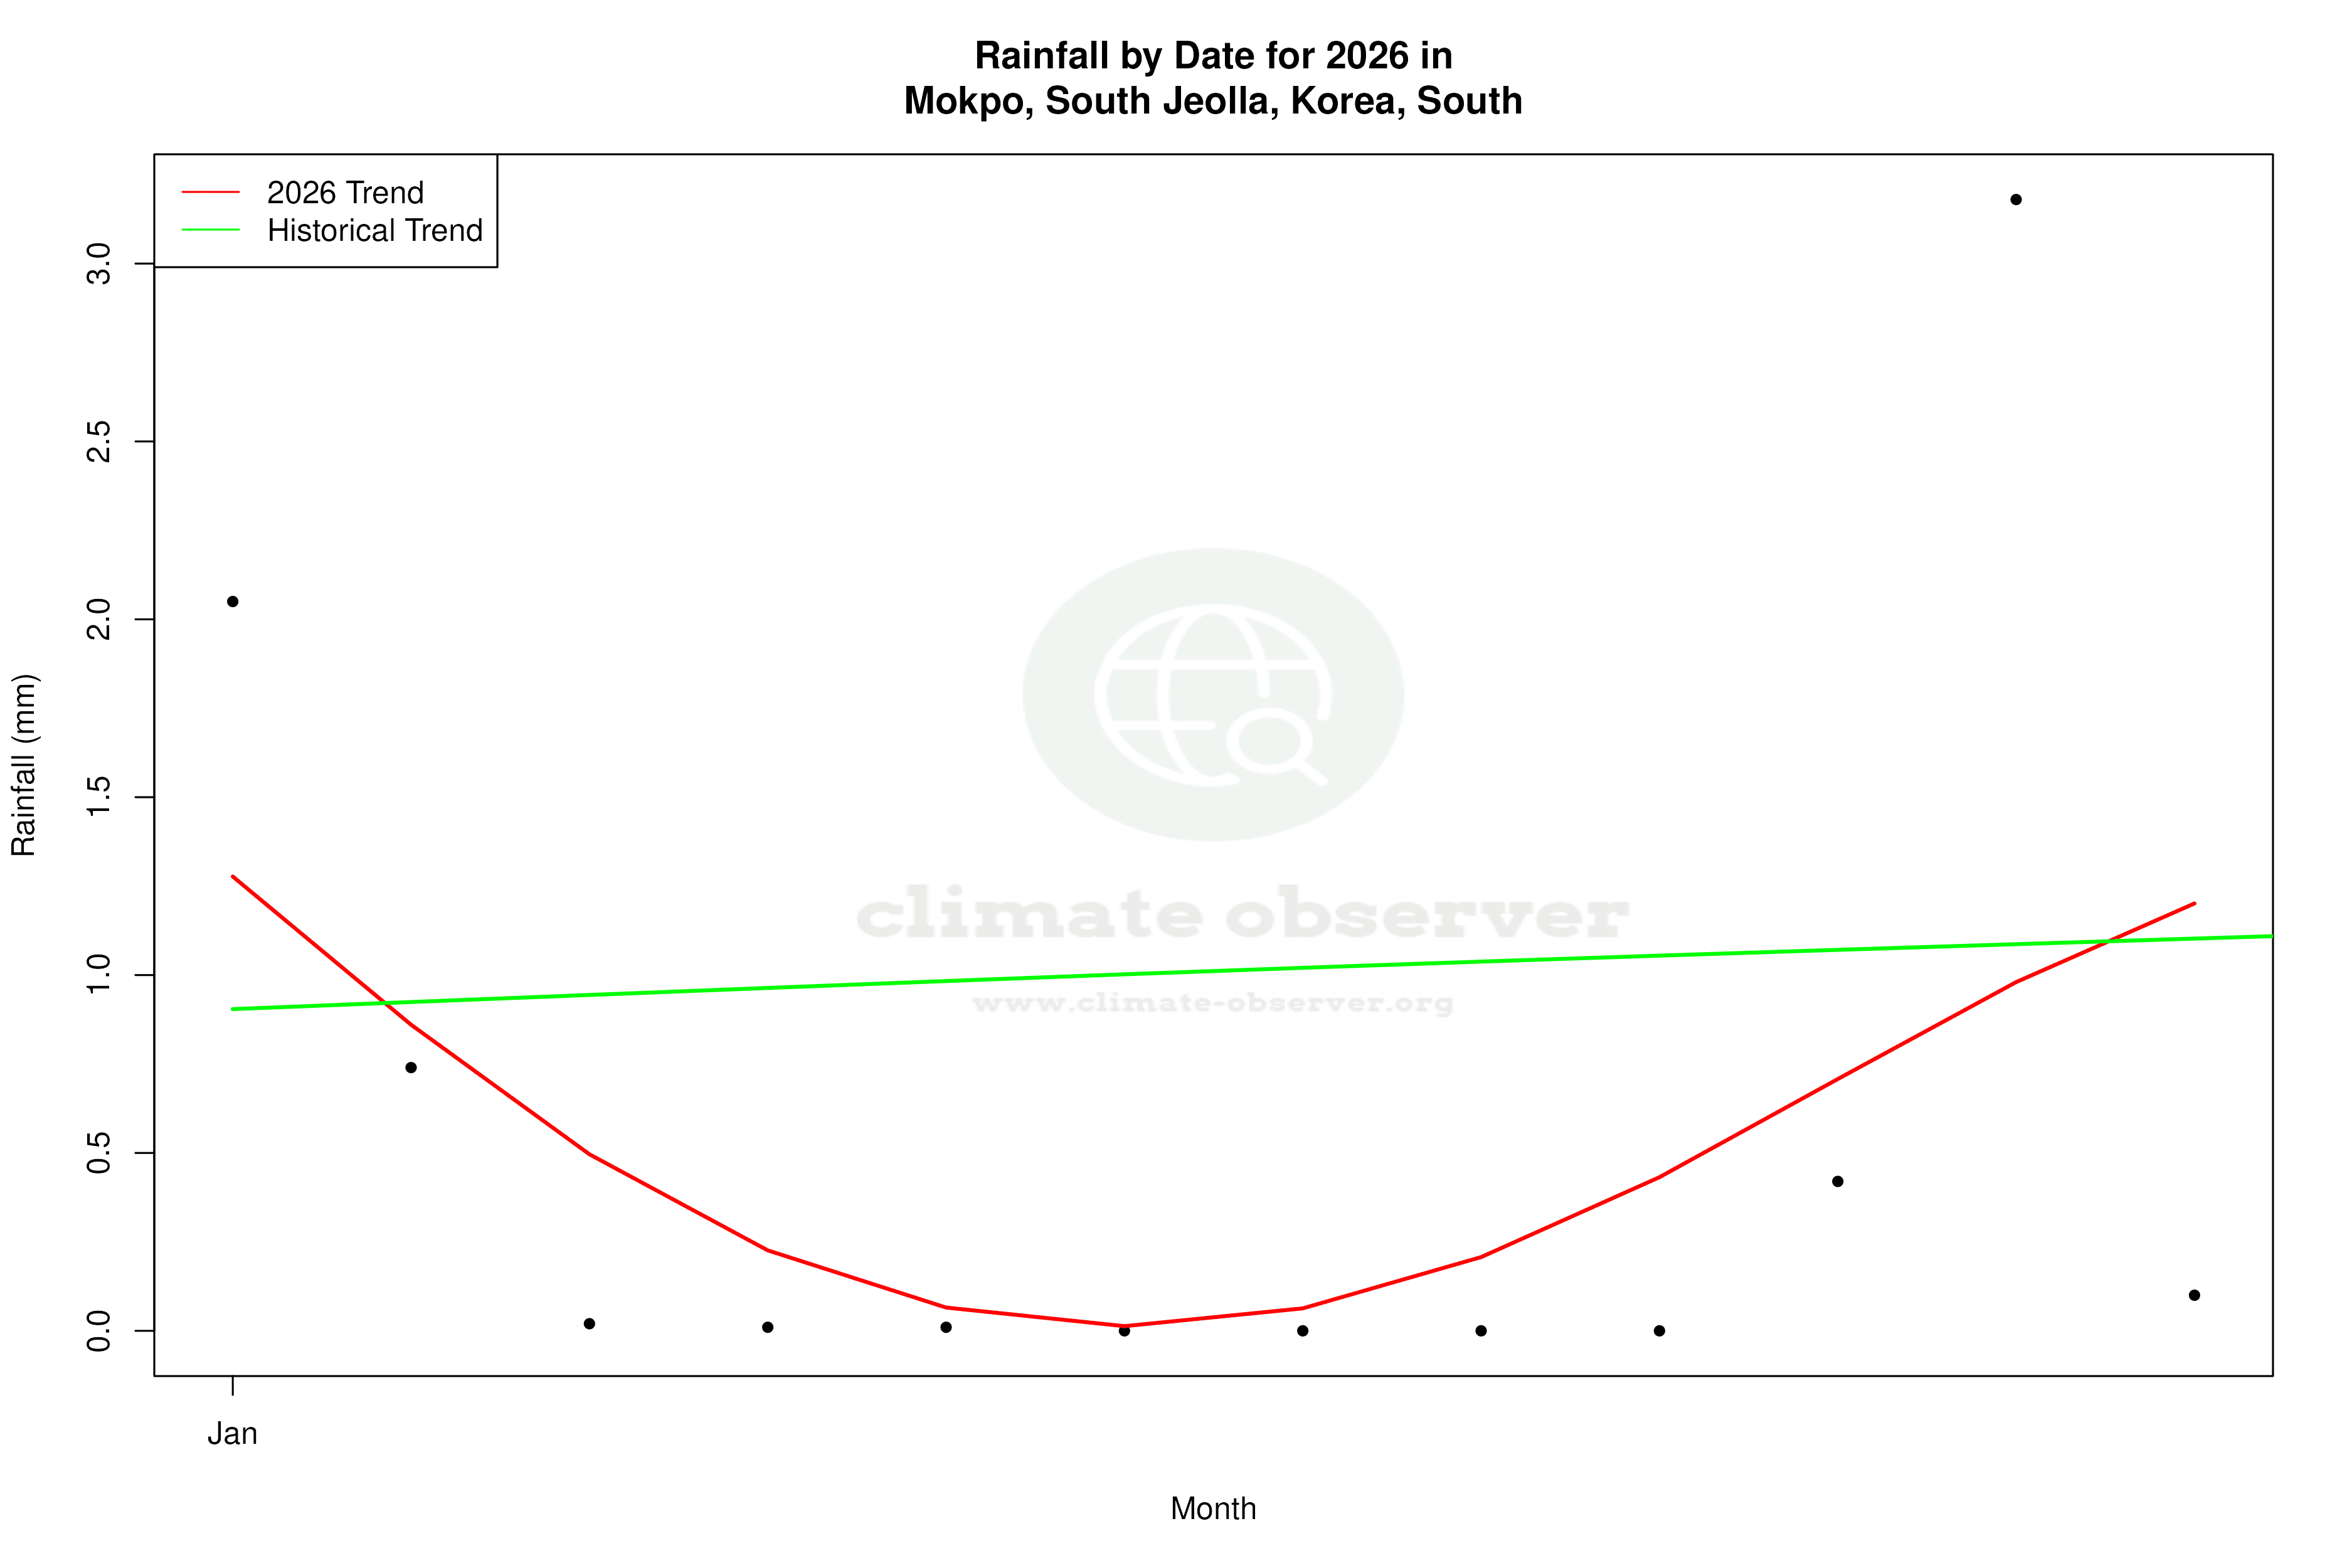
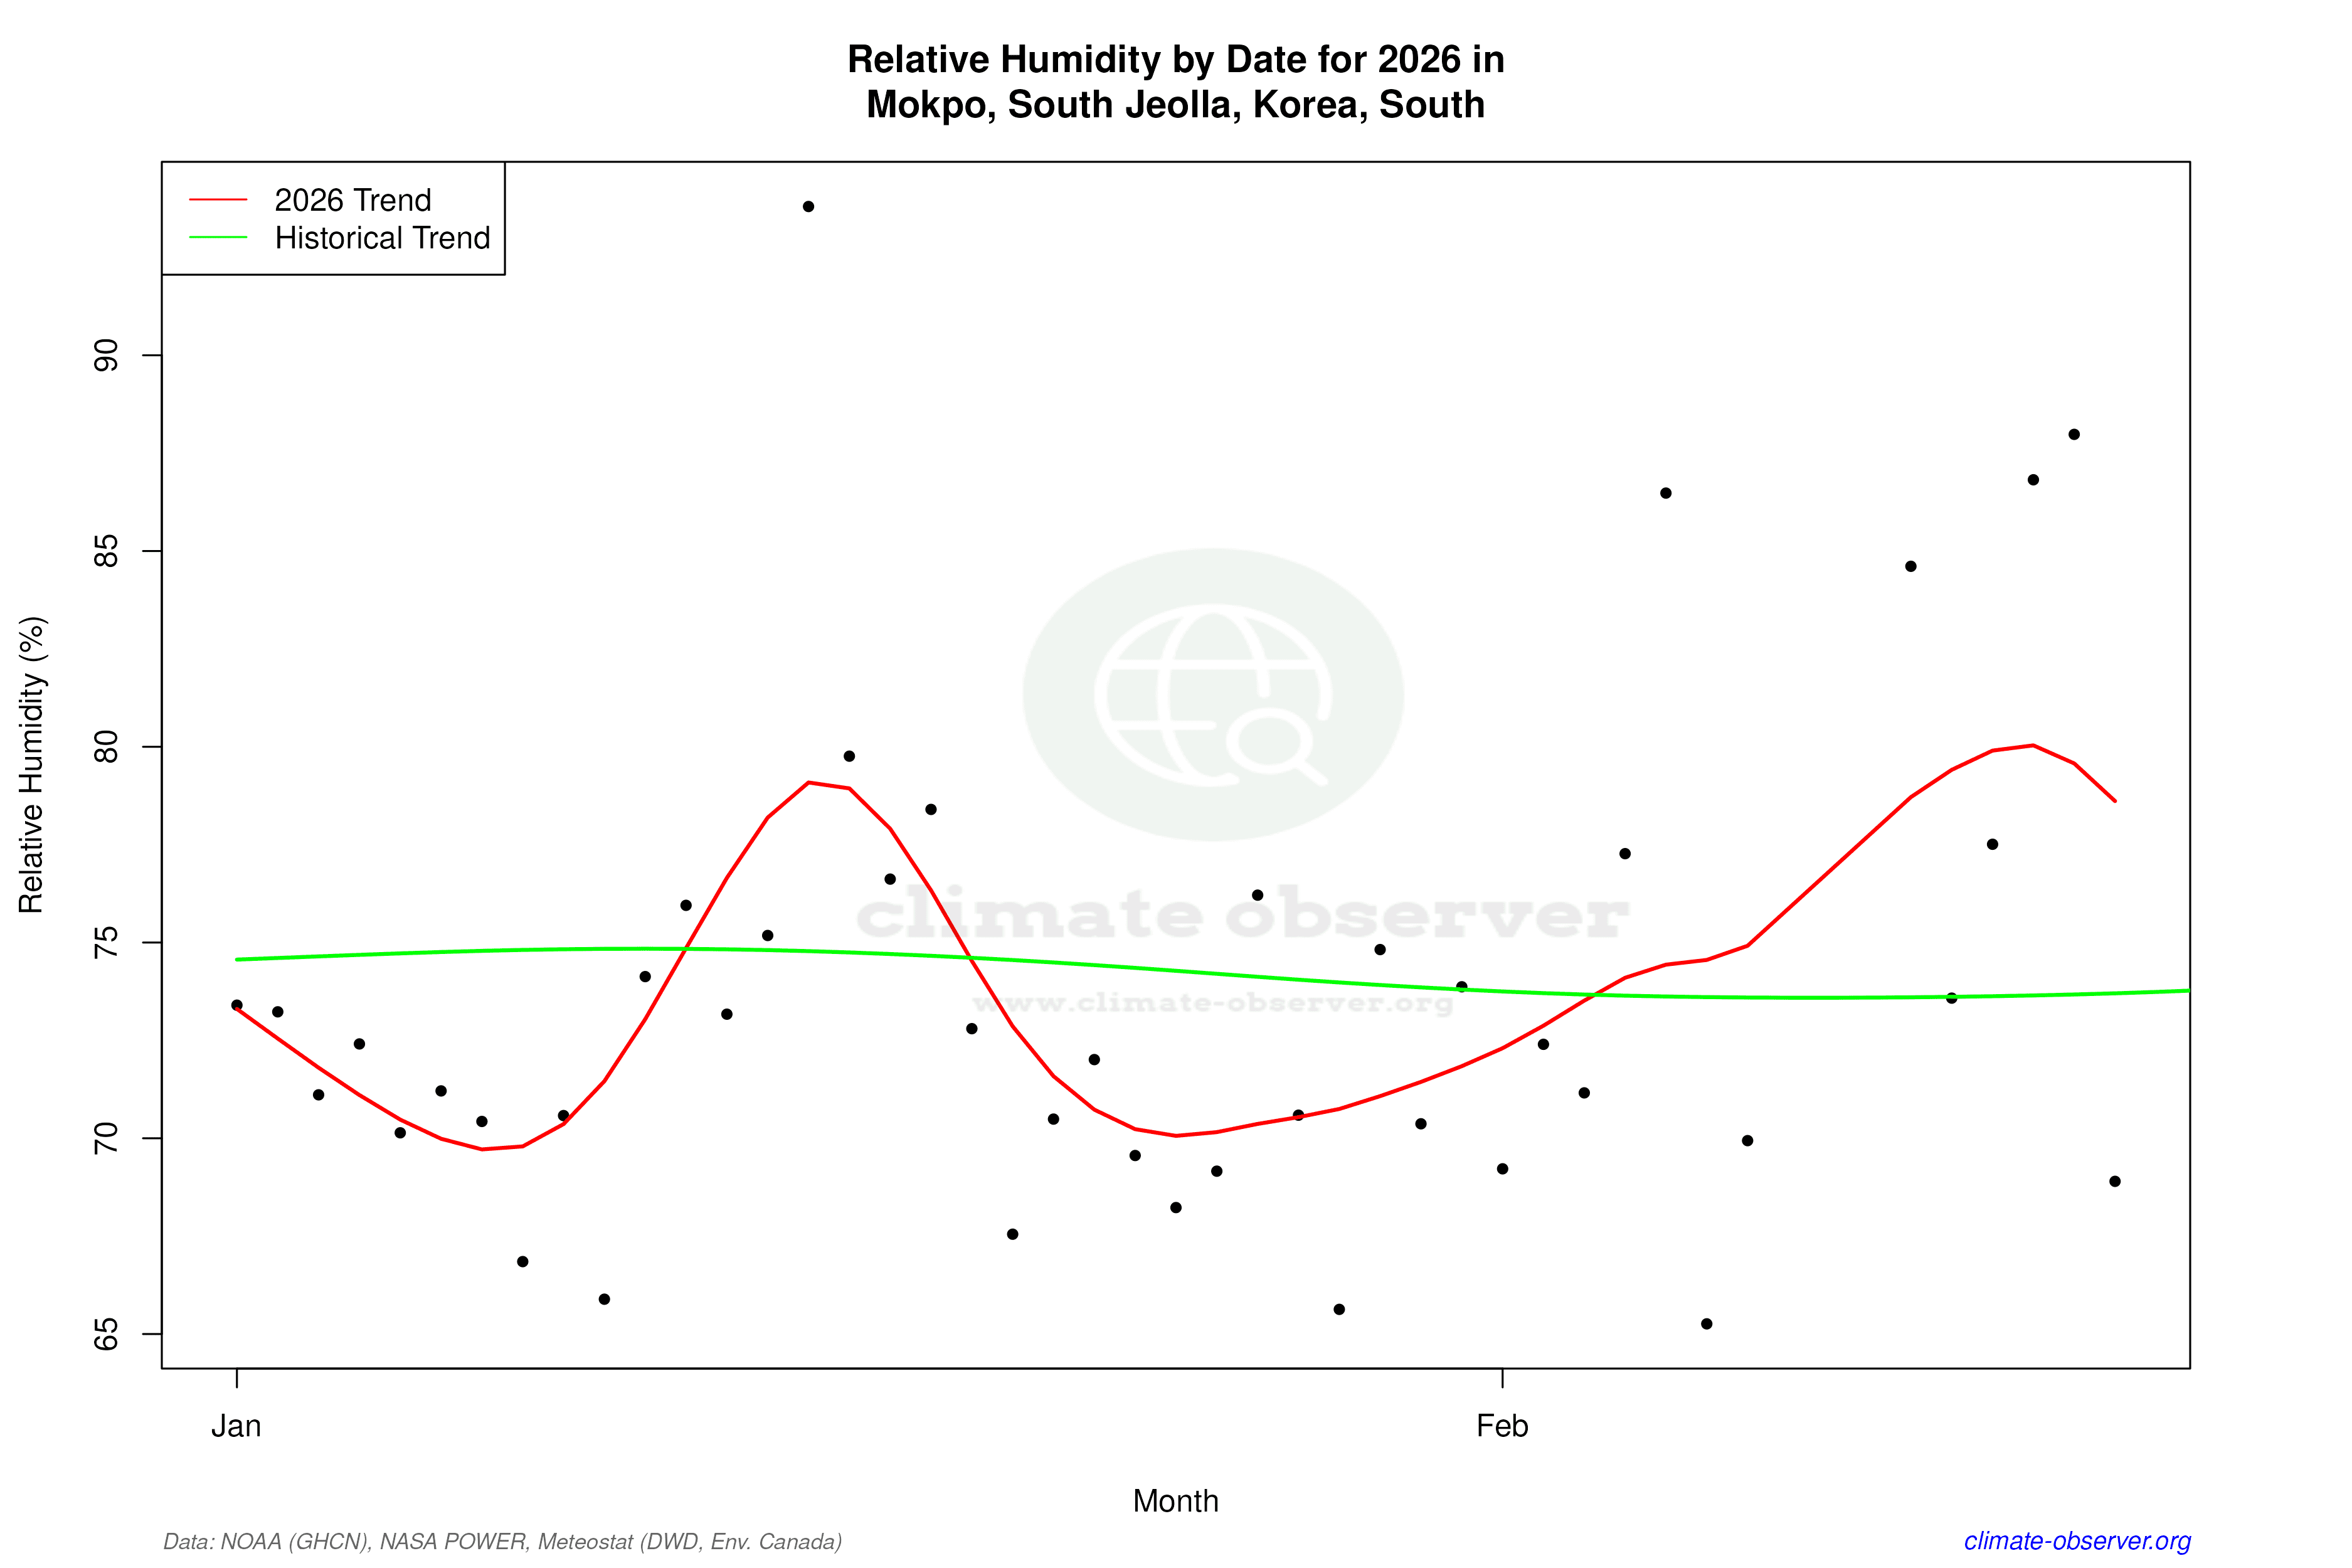
Precipitation Patterns: Towards Even Distribution
The Precipitation Concentration Index (PCI) offers insights into how rainfall is distributed throughout the year. Mokpo's PCI has decreased from a baseline of 15.32 to a current value of 14.19. This slight decrease indicates that precipitation is becoming more evenly distributed rather than being concentrated in fewer, intense events. Such a shift can affect water resource management and agricultural planning, as it may lead to changes in soil moisture levels and crop irrigation needs.
Record Temperatures: Historical Extremes
Mokpo's recorded temperature extremes provide a context for understanding its climate variability. The highest recorded temperature is 37.0°C (98.6°F), while the lowest is -16.7°C (1.9°F). These records underscore the range of conditions that the region can experience, from sweltering summer heat to frigid winter cold. Understanding these extremes is vital for infrastructure planning and public health strategies, particularly as climate change may increase the frequency or intensity of such events.
Regional Climate Goals and Implications
South Korea is actively pursuing climate goals aimed at reducing greenhouse gas emissions and enhancing resilience to climate impacts. Mokpo's warming trends and evolving precipitation patterns align with broader national observations, emphasizing the need for localized adaptation strategies. Recent weather events, such as typhoons and heatwaves, highlight the importance of integrating climate data into urban planning and disaster preparedness initiatives. These efforts are crucial for safeguarding Mokpo's economic and social well-being in the face of ongoing climate change.
Station Statistics
10-Year Trend
High: +0.43 °C/decade
Low: +1.10 °C/decade
Rain: -0.40 mm/decade
25-Year Trend
High: +0.31 °C/decade
Low: +0.60 °C/decade
Rain: -0.16 mm/decade
50-Year Trend
High: -0.11 °C/decade
Low: +0.28 °C/decade
Rain: +0.17 mm/decade
All-Time Trend
High: +0.04 °C/decade
Low: +0.13 °C/decade
Rain: +0.06 mm/decade
Percentage Above-Average Days
Last 12 Months: 50.7%
This Year: 43.3%
Precipitation Concentration Index (PCI) ℹ️
Last 12 Months: 11.2
Historical Average: 14.7
Percentile Rank of Last 12 Months ℹ️
High: 70th percentile
Low: 99th percentile
Rain: 45th percentile
Change in Variance ℹ️
High: -1.4%
Low: +4.1%
Intraday: -16.2%
Data Coverage
88.3%
First Year of Data
1926
Station Location
Historical Weather Records
| Max High | Avg High | Min High | Max Avg | Avg Avg | Min Avg | Max Low | Avg Low | Min Low | Max Precipitation | Avg Precipitation | Max Snow | Avg Snow | |
|---|---|---|---|---|---|---|---|---|---|---|---|---|---|
| Record | 37.0 °C | — | -6.0 °C | 31.7 °C | — | -9.4 °C | 28.0 °C | — | -16.7 °C | 204.0 mm | — | — | — |
| January | 18.0 °C | 5.6 °C | -6.0 °C | 14.3 °C | 1.7 °C | -9.4 °C | 11.5 °C | -1.8 °C | -16.2 °C | 32.8 mm | 1.1 mm | — | — |
| February | 19.7 °C | 7.0 °C | -5.9 °C | 15.5 °C | 2.9 °C | -8.0 °C | 12.2 °C | -0.9 °C | -16.7 °C | 106.0 mm | 1.5 mm | — | — |
| March | 24.2 °C | 11.4 °C | -3.8 °C | 19.1 °C | 6.9 °C | -5.5 °C | 14.4 °C | 2.6 °C | -7.5 °C | 104.0 mm | 2.0 mm | — | — |
| April | 28.4 °C | 17.2 °C | 4.9 °C | 22.4 °C | 12.5 °C | 3.3 °C | 18.2 °C | 8.0 °C | -4.5 °C | 95.0 mm | 2.9 mm | — | — |
| May | 30.6 °C | 22.0 °C | 12.3 °C | 23.8 °C | 17.4 °C | 10.1 °C | 22.0 °C | 13.2 °C | 0.5 °C | 187.0 mm | 3.2 mm | — | — |
| June | 34.4 °C | 25.5 °C | 17.1 °C | 28.4 °C | 21.5 °C | 14.7 °C | 25.9 °C | 17.9 °C | 9.8 °C | 204.0 mm | 5.0 mm | — | — |
| July | 37.0 °C | 28.6 °C | 19.5 °C | 31.1 °C | 25.1 °C | 18.6 °C | 27.3 °C | 22.5 °C | 13.5 °C | 202.2 mm | 6.8 mm | — | — |
| August | 36.9 °C | 30.3 °C | 21.3 °C | 31.7 °C | 26.3 °C | 19.2 °C | 28.0 °C | 23.4 °C | 13.7 °C | 187.0 mm | 6.0 mm | — | — |
| September | 34.9 °C | 26.6 °C | 17.8 °C | 29.6 °C | 22.3 °C | 15.4 °C | 27.5 °C | 18.8 °C | 8.4 °C | 150.0 mm | 4.7 mm | — | — |
| October | 32.1 °C | 21.7 °C | 9.9 °C | 25.2 °C | 16.6 °C | 5.8 °C | 22.8 °C | 12.6 °C | 1.0 °C | 105.0 mm | 1.8 mm | — | — |
| November | 26.5 °C | 15.2 °C | 2.4 °C | 21.6 °C | 10.3 °C | -1.3 °C | 18.1 °C | 6.6 °C | -10.0 °C | 62.0 mm | 1.7 mm | — | — |
| December | 20.8 °C | 8.6 °C | -5.3 °C | 15.6 °C | 4.2 °C | -7.8 °C | 14.8 °C | 0.9 °C | -14.0 °C | 44.6 mm | 1.2 mm | — | — |
Data Visualisations
Remove WatermarksCurrent Year Climate Trends vs Historical


Max Temperature this Year | 1 of 6
Climate 12-Month Moving Averages


Max Temperature 12-Month MA | 1 of 6
Daily Data Points and Averages Throughout the Year


Average Max Temperature Throughout Year | 1 of 5
