Climate for Station: Seoul City, Seoul, Korea, South
Loading live weather...
Climate Analysis & Overview
Seoul City is experiencing a warming trend, with significant increases in both high and low temperatures over the past decade. The precipitation pattern has become more evenly distributed, suggesting a shift towards more consistent rainfall events. These changes align with South Korea's climate adaptation strategies aimed at mitigating urban heat and enhancing water management.
Urban Heat Dynamics in Seoul
Seoul, located at 37.567, 126.967, falls under the Köppen climate classification of Cwa, indicating a humid continental climate with dry winters and hot summers. The city's geographical position, surrounded by mountains and bisected by the Han River, influences its microclimate, often intensifying temperature variations. Over the past decade, Seoul has witnessed a warming trend with high temperatures increasing by 1.51°C (2.72°F) and low temperatures rising by 2.51°C (4.51°F). This short-term trend is more pronounced than the all-time warming, where highs have increased by 0.11°C (0.20°F) and lows by 0.26°C (0.47°F). This suggests a recent acceleration in temperature rise, which is critical for urban planning and public health strategies.
Temperature Extremes and Records
Seoul's temperature records highlight the potential for extreme weather events. The highest recorded temperature is 39.2°C (102.6°F), while the lowest is -22.0°C (-7.6°F). These extremes underscore the city's vulnerability to both heatwaves and cold snaps, necessitating robust infrastructure and emergency response systems. The recent warming trends could exacerbate these extremes, making it imperative for Seoul to continue enhancing its climate resilience.
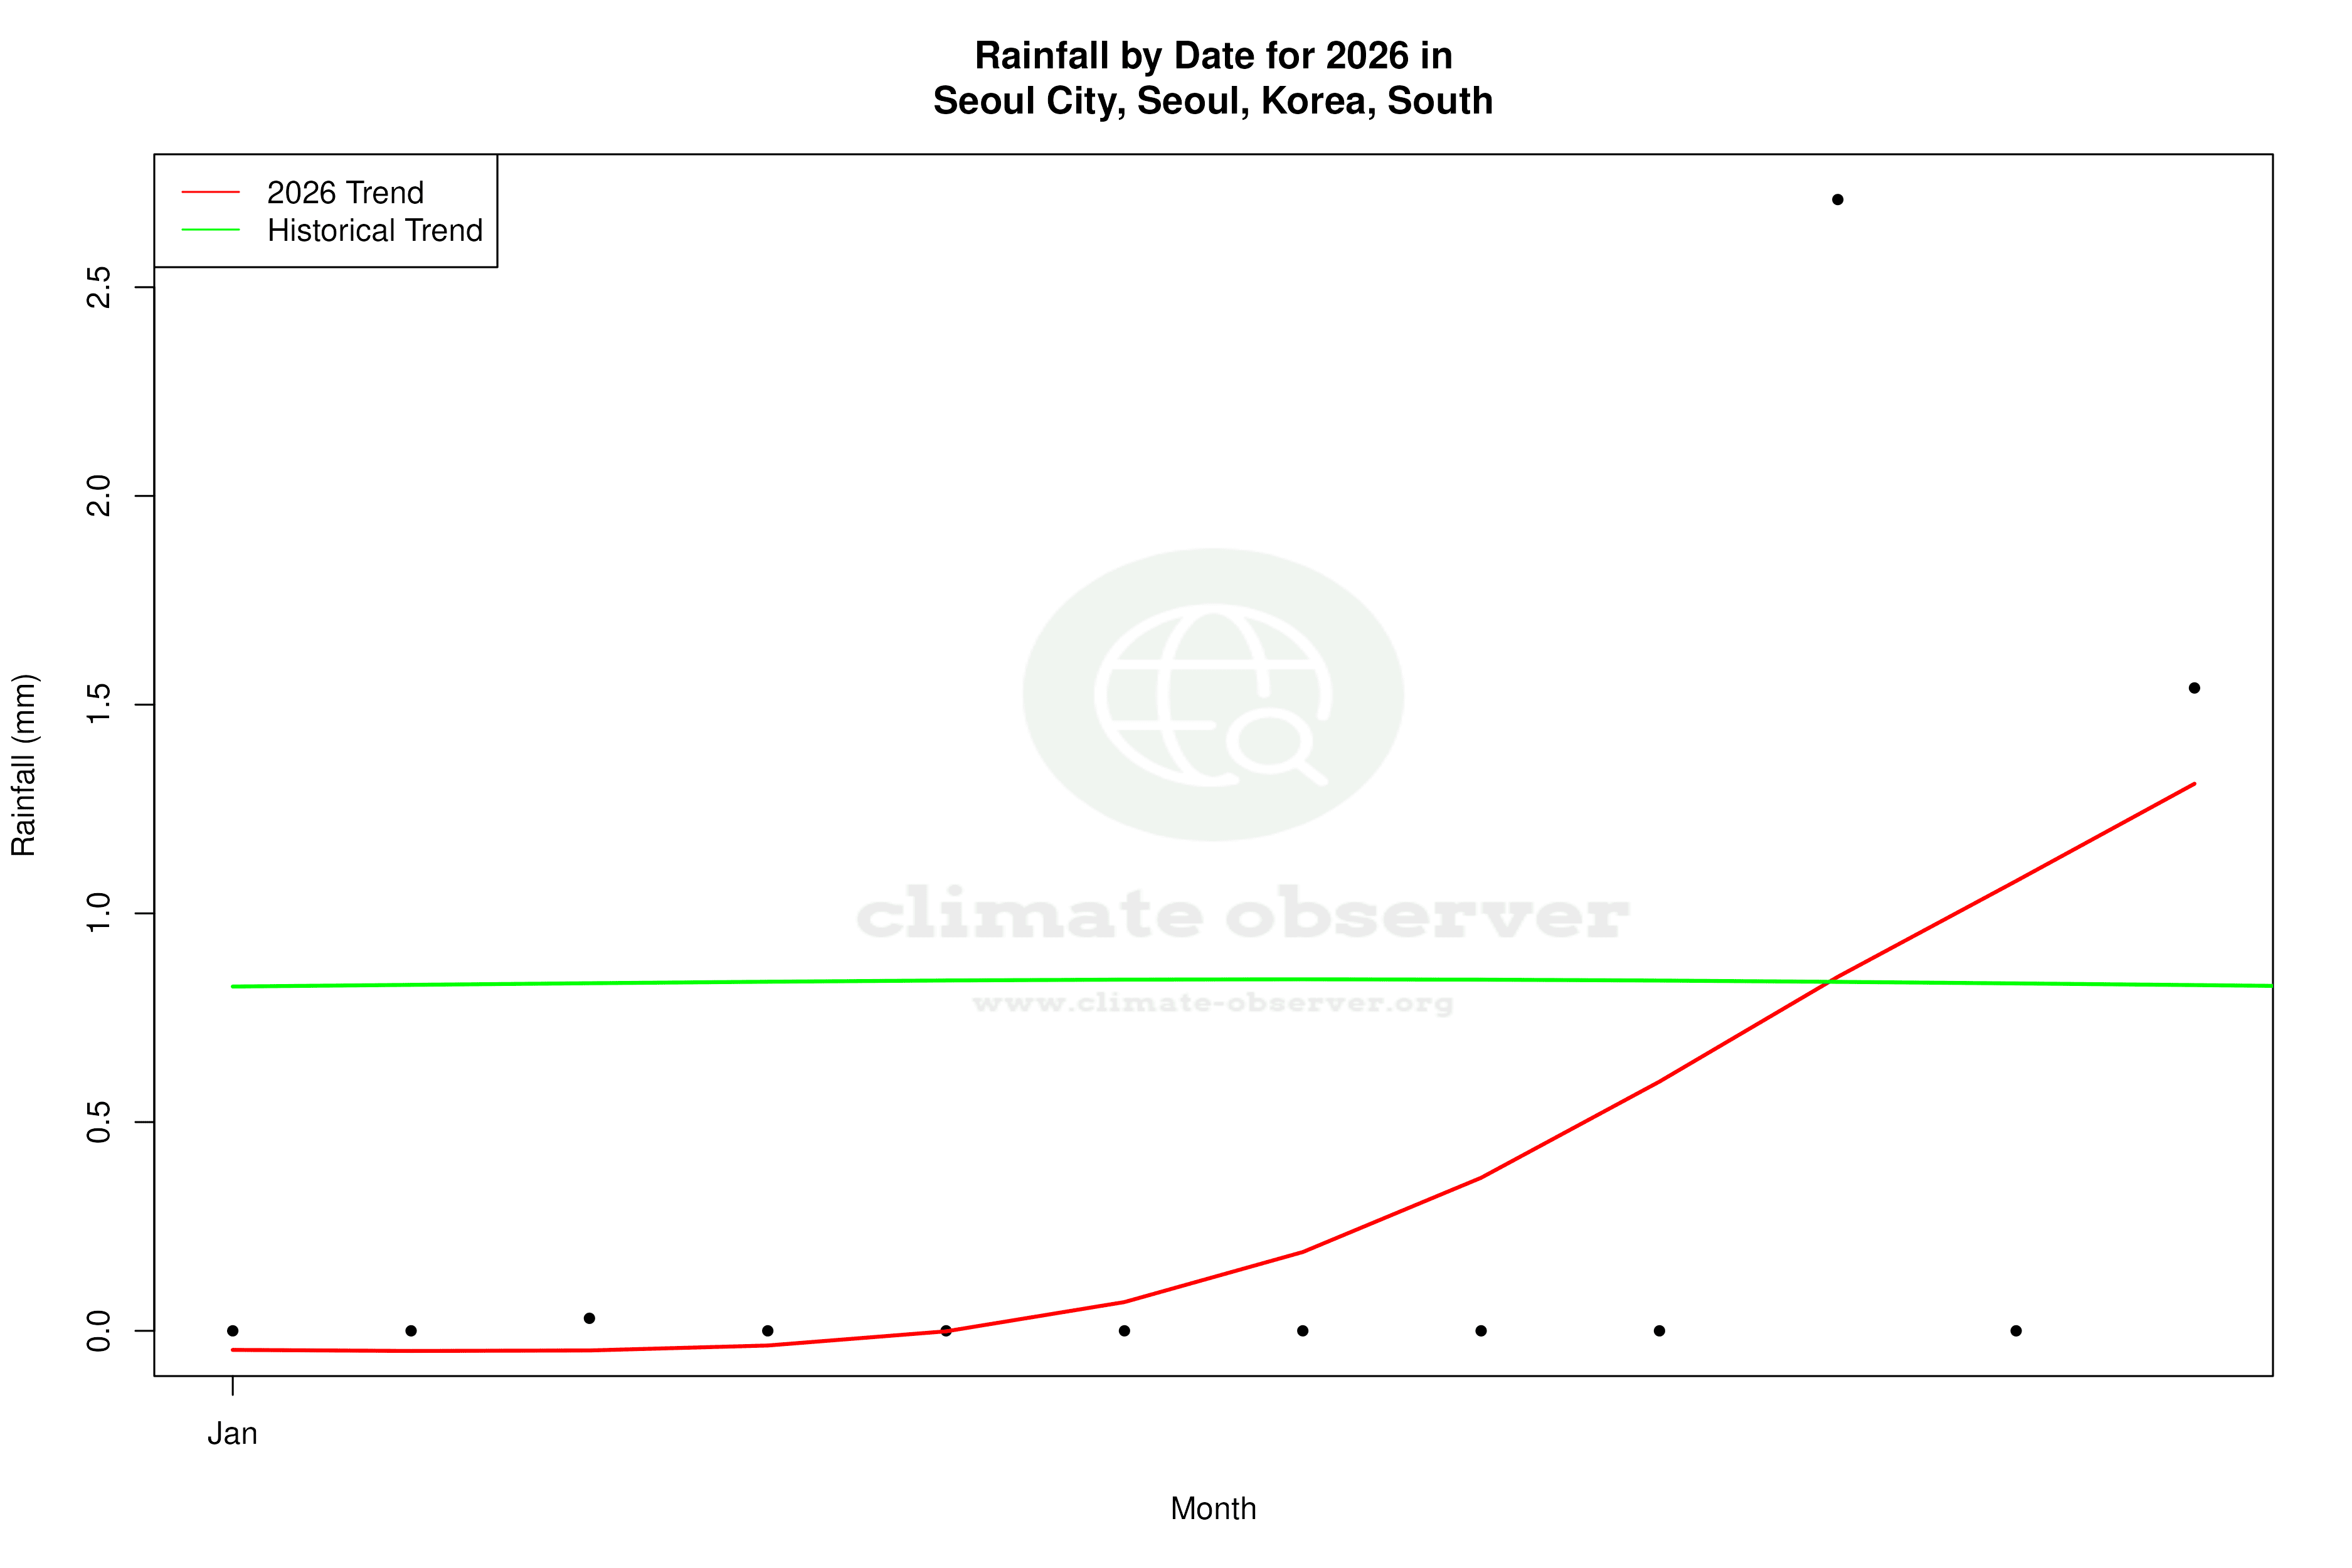
Evolving Precipitation Patterns
The Precipitation Concentration Index (PCI) for Seoul has decreased from a baseline of 18.99 to a current value of 14.24. This indicates a shift towards more evenly distributed rainfall throughout the year, reducing the risk of intense, isolated downpours that can lead to flooding. A PCI below 20 suggests a moderate concentration of precipitation, which can be advantageous for water resource management and agricultural planning. This change aligns with South Korea's national goals to improve water distribution and reduce the impact of climate-induced weather variability.
Implications for Climate Policy
The observed climatic changes in Seoul are significant in the context of South Korea's broader climate policy, which aims to reduce greenhouse gas emissions and enhance urban sustainability. The warming trends and more evenly distributed precipitation patterns provide both challenges and opportunities for policymakers. Strategies focusing on urban greening, energy efficiency, and sustainable water management are crucial to mitigating the impacts of these climatic shifts. As Seoul continues to grow, integrating climate data into urban planning will be essential to ensure a resilient and sustainable future for its residents.
Station Statistics
10-Year Trend
High: +1.62 °C/decade
Low: +2.42 °C/decade
Rain: +0.61 mm/decade
25-Year Trend
High: +0.57 °C/decade
Low: +0.90 °C/decade
Rain: -0.22 mm/decade
50-Year Trend
High: +0.28 °C/decade
Low: +0.54 °C/decade
Rain: -0.09 mm/decade
All-Time Trend
High: +0.11 °C/decade
Low: +0.26 °C/decade
Rain: -0.09 mm/decade
Percentage Above-Average Days
Last 12 Months: 54.2%
This Year: 58.8%
Precipitation Concentration Index (PCI) ℹ️
Last 12 Months: 14.0
Historical Average: 20.0
Percentile Rank of Last 12 Months ℹ️
High: 88th percentile
Low: 97th percentile
Rain: 24th percentile
Change in Variance ℹ️
High: -3.0%
Low: +2.8%
Intraday: -9.7%
Data Coverage
87.8%
First Year of Data
1950
Station Location
Historical Weather Records
| Max High | Avg High | Min High | Max Avg | Avg Avg | Min Avg | Max Low | Avg Low | Min Low | Max Precipitation | Avg Precipitation | Max Snow | Avg Snow | |
|---|---|---|---|---|---|---|---|---|---|---|---|---|---|
| Record | 39.2 °C | — | -13.6 °C | 34.1 °C | — | -16.2 °C | 30.3 °C | — | -22.0 °C | 340.1 mm | — | — | — |
| January | 13.7 °C | 1.4 °C | -13.6 °C | 11.6 °C | -2.9 °C | -16.2 °C | 7.0 °C | -7.3 °C | -22.0 °C | 41.9 mm | 0.8 mm | — | — |
| February | 18.7 °C | 4.4 °C | -9.5 °C | 13.9 °C | -0.1 °C | -14.6 °C | 8.8 °C | -4.6 °C | -19.8 °C | 47.0 mm | 0.9 mm | — | — |
| March | 24.6 °C | 10.5 °C | -5.0 °C | 18.6 °C | 5.6 °C | -9.4 °C | 14.0 °C | 0.5 °C | -15.3 °C | 69.6 mm | 1.6 mm | — | — |
| April | 29.8 °C | 17.7 °C | 2.4 °C | 23.7 °C | 12.3 °C | -0.7 °C | 19.2 °C | 6.8 °C | -9.4 °C | 72.9 mm | 2.4 mm | — | — |
| May | 33.3 °C | 23.4 °C | 11.9 °C | 26.2 °C | 17.9 °C | 8.8 °C | 22.1 °C | 12.4 °C | -2.1 °C | 103.9 mm | 3.2 mm | — | — |
| June | 37.4 °C | 27.1 °C | 16.3 °C | 29.5 °C | 22.2 °C | 13.6 °C | 26.3 °C | 17.6 °C | 6.6 °C | 225.0 mm | 4.6 mm | — | — |
| July | 38.4 °C | 29.1 °C | 15.0 °C | 32.9 °C | 25.3 °C | 14.4 °C | 28.8 °C | 21.9 °C | 8.3 °C | 340.1 mm | 13.1 mm | — | — |
| August | 39.2 °C | 30.1 °C | 18.6 °C | 34.1 °C | 26.0 °C | 17.6 °C | 30.3 °C | 22.5 °C | 12.5 °C | 312.9 mm | 10.6 mm | — | — |
| September | 36.0 °C | 26.1 °C | 15.9 °C | 29.5 °C | 21.2 °C | 10.9 °C | 26.5 °C | 16.8 °C | 3.9 °C | 202.9 mm | 4.9 mm | — | — |
| October | 29.6 °C | 20.0 °C | 6.0 °C | 24.0 °C | 14.6 °C | 1.8 °C | 22.1 °C | 9.6 °C | -2.6 °C | 100.1 mm | 2.0 mm | — | — |
| November | 28.0 °C | 11.8 °C | -4.0 °C | 20.7 °C | 7.0 °C | -7.5 °C | 18.8 °C | 2.5 °C | -11.5 °C | 67.1 mm | 2.0 mm | — | — |
| December | 19.6 °C | 4.0 °C | -11.0 °C | 13.4 °C | -0.2 °C | -15.6 °C | 12.3 °C | -4.3 °C | -18.1 °C | 33.8 mm | 0.8 mm | — | — |
Data Visualisations
Remove WatermarksCurrent Year Climate Trends vs Historical


Max Temperature this Year | 1 of 6
Climate 12-Month Moving Averages


Max Temperature 12-Month MA | 1 of 6
Daily Data Points and Averages Throughout the Year


Average Max Temperature Throughout Year | 1 of 5
