Climate for Station: Taejon, Daejeon, Korea, South
Loading live weather...
Climate Analysis & Overview
Taejon is experiencing a warming trend, with more significant increases in low temperatures than highs over the past decade. Despite this, the all-time data suggests a more moderate warming. Precipitation is becoming more evenly distributed, which could impact local agriculture and water management strategies.
Climate Classification and Geographic Influences
Taejon, located at coordinates 36.3°N, 127.4°E, falls under the Köppen climate classification of Cwa, indicating a humid subtropical climate with dry winters. This region is characterised by hot, humid summers and cold, dry winters. The city's proximity to the mountains and rivers influences its microclimate, often leading to temperature variations and specific precipitation patterns. The mountains can act as barriers, affecting wind flow and precipitation distribution.
Temperature Trends: A Decade of Change
Over the past ten years, Taejon has experienced a notable warming trend, with average high temperatures rising by 1.47°C (2.65°F) and lows increasing by 2.55°C (4.59°F). This indicates a more pronounced warming of nighttime temperatures, which can affect energy consumption and human comfort. However, when examining the all-time trends, the warming is more moderate, with highs increasing by 0.21°C (0.38°F) and lows by 0.11°C (0.20°F). This suggests that while the recent decade has seen accelerated warming, the long-term trend remains more gradual.
Extreme Temperatures: Record Highs and Lows
Taejon has recorded extreme temperatures that reflect its climatic variability. The highest recorded temperature is 39.0°C (102.2°F), while the lowest is -22.7°C (-8.9°F). These extremes highlight the significant thermal oscillations that can occur within this region, influenced by both seasonal changes and geographic factors.
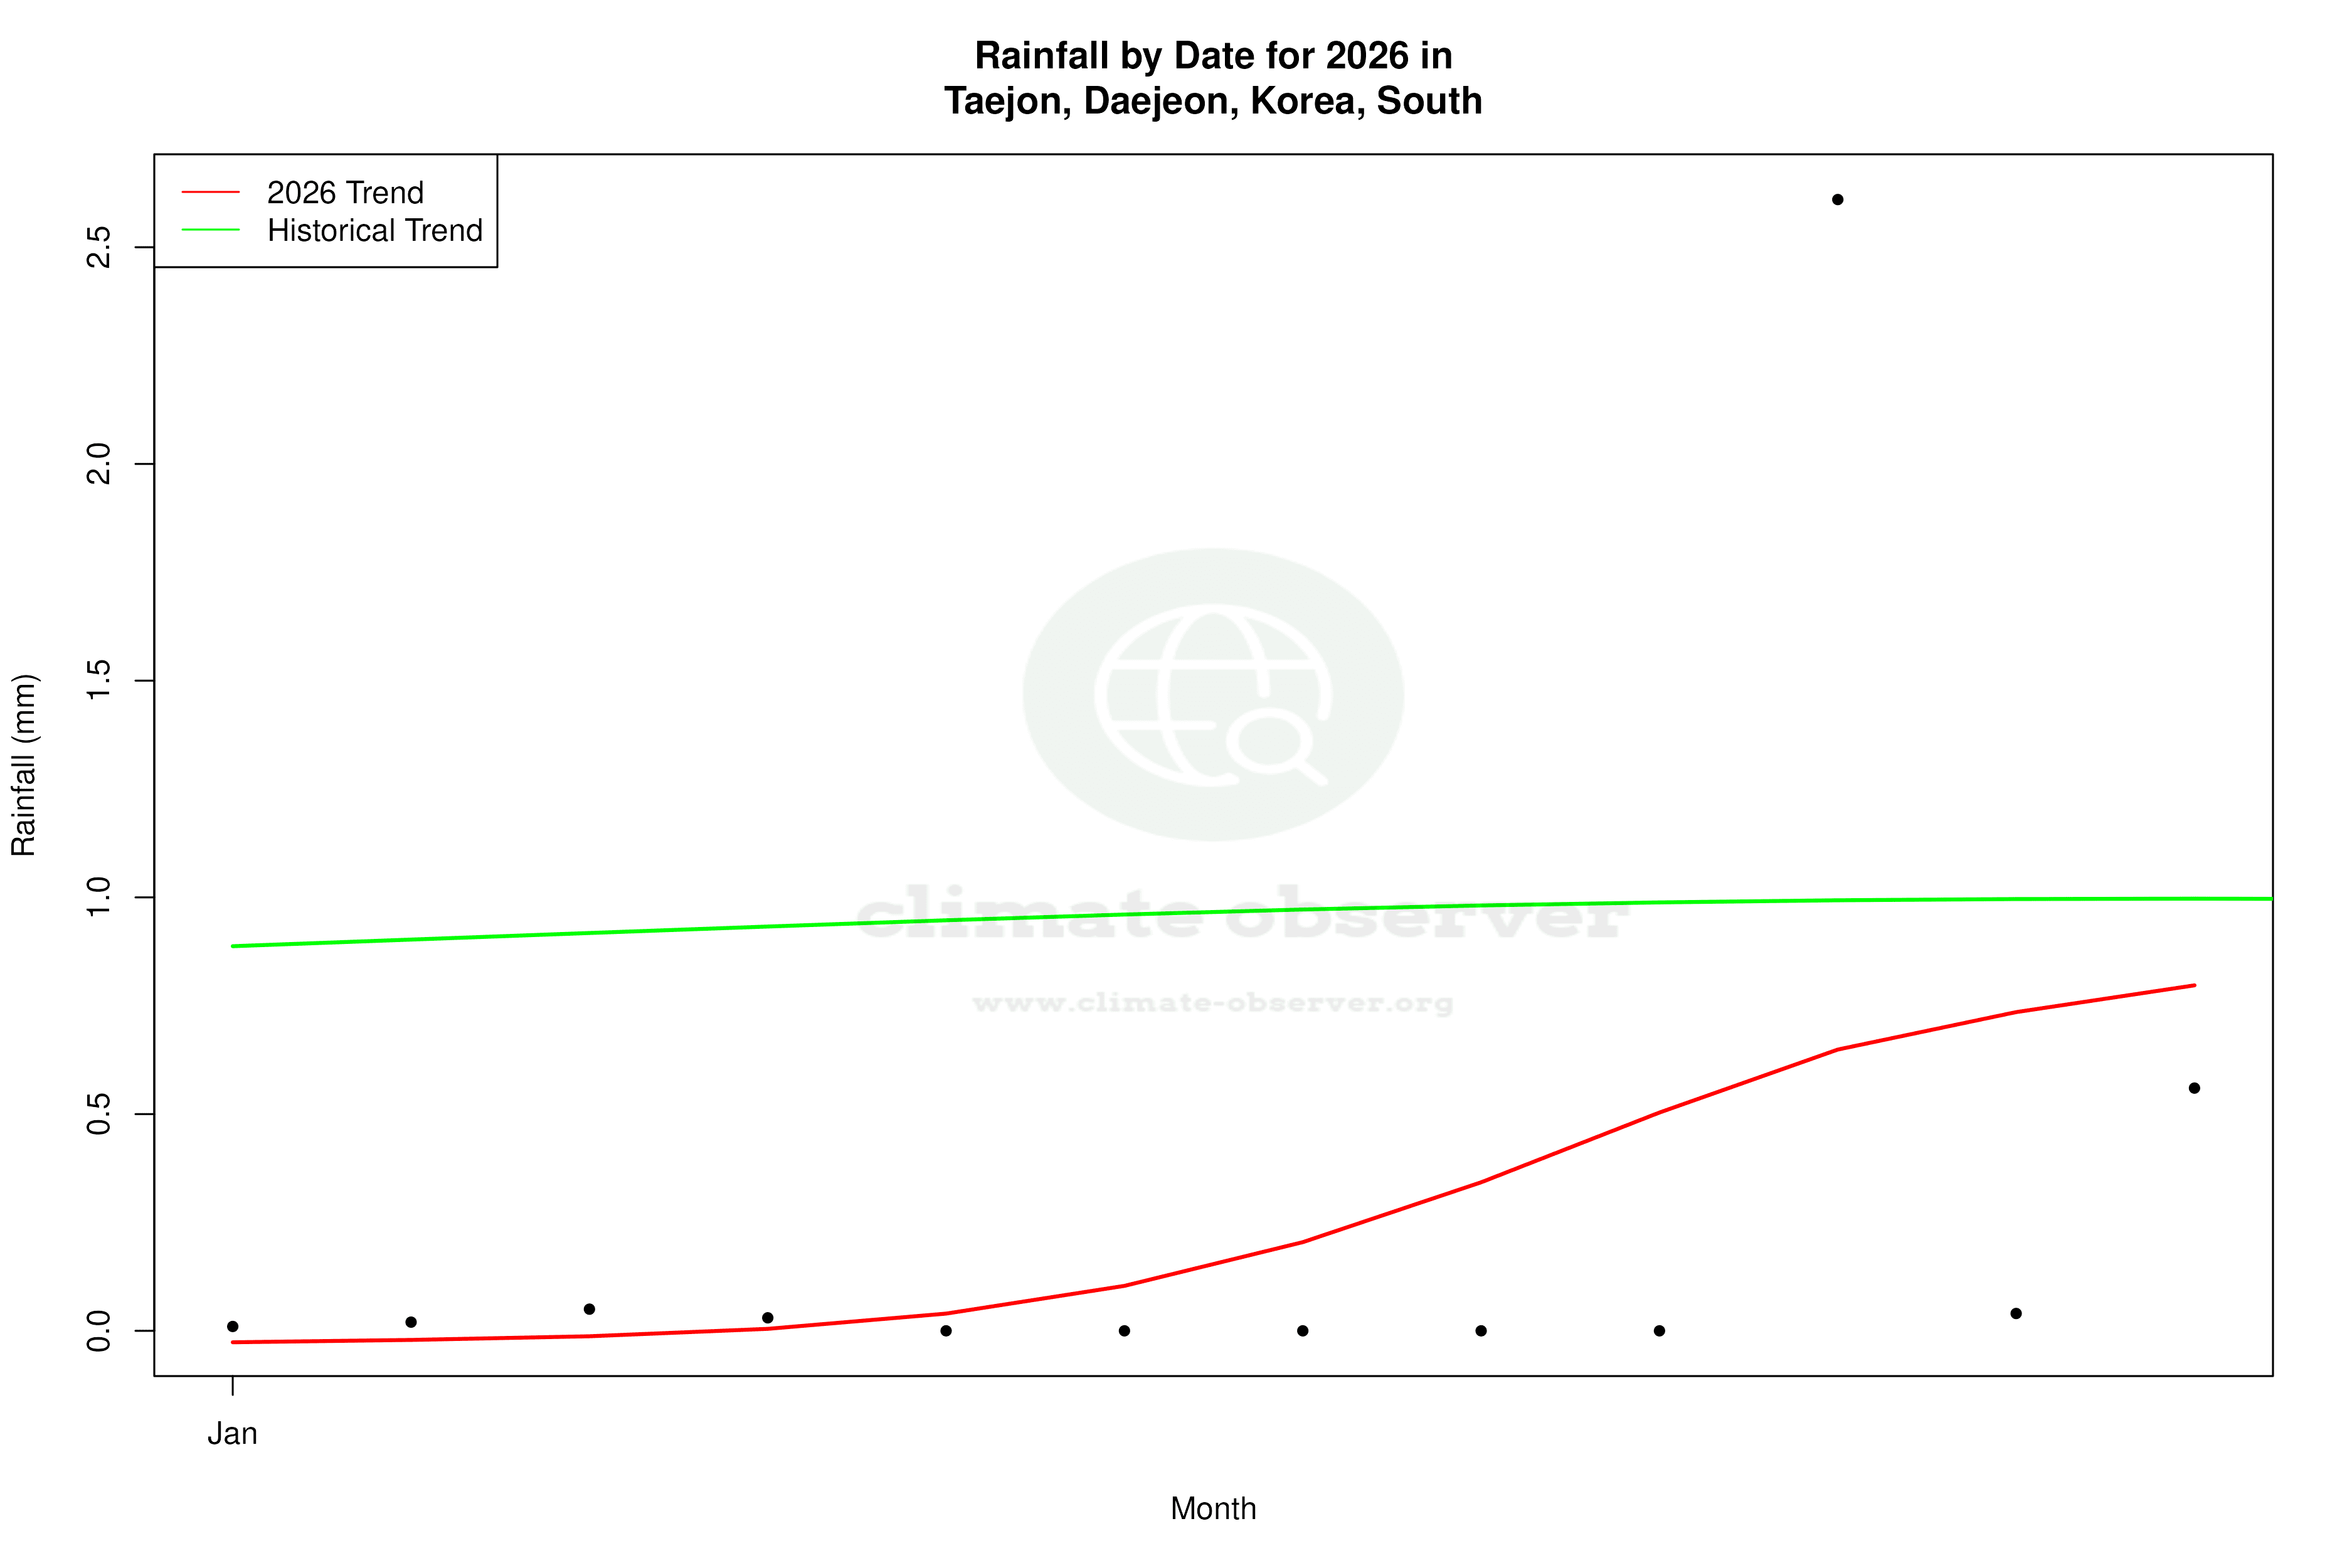
Precipitation Patterns: A Shift Towards Even Distribution
The Precipitation Concentration Index (PCI) for Taejon has decreased from a baseline of 17.4 to a current value of 13.8. This indicates a more even distribution of precipitation events throughout the year, moving away from concentrated, heavy rainfall events. This shift can have significant implications for agriculture, reducing the risk of soil erosion and improving water management strategies. It also aligns with Korea's regional climate goals of managing water resources more sustainably.
Regional Climate Context and Implications
The changes observed in Taejon's climate data reflect broader regional trends in South Korea, where efforts are being made to adapt to and mitigate the effects of climate change. The warming trends, particularly in nighttime temperatures, could influence energy policies and urban planning. Meanwhile, the more even precipitation distribution may offer opportunities for improved agricultural practices and water conservation efforts. As Taejon continues to evolve in response to these climatic changes, understanding these trends will be crucial for future planning and development.
Station Statistics
10-Year Trend
High: +1.55 °C/decade
Low: +2.57 °C/decade
Rain: +0.36 mm/decade
25-Year Trend
High: +0.47 °C/decade
Low: +1.08 °C/decade
Rain: -0.03 mm/decade
50-Year Trend
High: +0.24 °C/decade
Low: +0.63 °C/decade
Rain: -0.12 mm/decade
All-Time Trend
High: +0.20 °C/decade
Low: +0.12 °C/decade
Rain: -0.12 mm/decade
Percentage Above-Average Days
Last 12 Months: 54.5%
This Year: 55.1%
Precipitation Concentration Index (PCI) ℹ️
Last 12 Months: 12.7
Historical Average: 17.2
Percentile Rank of Last 12 Months ℹ️
High: 90th percentile
Low: 97th percentile
Rain: 17th percentile
Change in Variance ℹ️
High: -1.6%
Low: +0.2%
Intraday: -0.3%
Data Coverage
84.9%
First Year of Data
1951
Station Location
Historical Weather Records
| Max High | Avg High | Min High | Max Avg | Avg Avg | Min Avg | Max Low | Avg Low | Min Low | Max Precipitation | Avg Precipitation | Max Snow | Avg Snow | |
|---|---|---|---|---|---|---|---|---|---|---|---|---|---|
| Record | 39.0 °C | — | -11.9 °C | 33.1 °C | — | -15.9 °C | 27.8 °C | — | -22.7 °C | 310.9 mm | — | — | — |
| January | 16.6 °C | 3.1 °C | -11.9 °C | 12.6 °C | -1.9 °C | -15.9 °C | 10.2 °C | -7.4 °C | -22.7 °C | 43.7 mm | 0.9 mm | — | — |
| February | 22.2 °C | 5.9 °C | -8.4 °C | 14.7 °C | 0.6 °C | -14.0 °C | 9.0 °C | -5.0 °C | -22.0 °C | 55.1 mm | 1.3 mm | — | — |
| March | 28.8 °C | 11.9 °C | -5.0 °C | 21.9 °C | 6.0 °C | -8.6 °C | 14.9 °C | -0.2 °C | -12.8 °C | 48.3 mm | 1.8 mm | — | — |
| April | 31.0 °C | 19.0 °C | 1.9 °C | 23.7 °C | 12.6 °C | -0.4 °C | 19.1 °C | 5.7 °C | -5.4 °C | 91.9 mm | 2.7 mm | — | — |
| May | 35.2 °C | 24.2 °C | 12.0 °C | 25.8 °C | 18.0 °C | 8.2 °C | 22.6 °C | 11.5 °C | 0.5 °C | 88.1 mm | 3.2 mm | — | — |
| June | 36.0 °C | 27.7 °C | 16.3 °C | 29.4 °C | 22.3 °C | 14.0 °C | 27.6 °C | 17.0 °C | 8.0 °C | 220.0 mm | 5.0 mm | — | — |
| July | 38.0 °C | 29.7 °C | 19.0 °C | 31.7 °C | 25.4 °C | 15.4 °C | 27.4 °C | 21.6 °C | 7.8 °C | 292.1 mm | 10.7 mm | — | — |
| August | 39.0 °C | 30.4 °C | 19.1 °C | 33.1 °C | 25.9 °C | 17.7 °C | 27.8 °C | 21.9 °C | 10.4 °C | 310.9 mm | 9.4 mm | — | — |
| September | 35.6 °C | 26.1 °C | 15.2 °C | 30.2 °C | 20.8 °C | 12.0 °C | 25.5 °C | 15.9 °C | 1.3 °C | 239.0 mm | 6.1 mm | — | — |
| October | 31.1 °C | 20.5 °C | 7.0 °C | 24.1 °C | 13.9 °C | 3.1 °C | 20.4 °C | 8.0 °C | -4.3 °C | 91.9 mm | 2.0 mm | — | — |
| November | 26.0 °C | 13.0 °C | -1.0 °C | 20.5 °C | 7.0 °C | -6.1 °C | 17.2 °C | 1.4 °C | -12.3 °C | 79.0 mm | 1.8 mm | — | — |
| December | 19.7 °C | 5.6 °C | -10.0 °C | 14.7 °C | 0.6 °C | -14.0 °C | 10.2 °C | -4.6 °C | -18.0 °C | 47.4 mm | 1.1 mm | — | — |
Data Visualisations
Remove WatermarksCurrent Year Climate Trends vs Historical


Max Temperature this Year | 1 of 6
Climate 12-Month Moving Averages


Max Temperature 12-Month MA | 1 of 6
Daily Data Points and Averages Throughout the Year


Average Max Temperature Throughout Year | 1 of 5
