Climate for Station: Rezekne, Latvia (Latgale), Latvia
Loading live weather...
Climate Analysis & Overview
Rezekne's climate is experiencing a warming trend, with both highs and lows increasing over the past decade. The region's precipitation is becoming slightly more concentrated, indicating potential shifts in weather patterns. These changes align with Latvia's broader climate goals to adapt to and mitigate the impacts of climate change.
Warming Trends in Rezekne
Rezekne, located in Latvia, experiences a humid continental climate, characterised by cold winters and warm summers. Over the past decade, the region has seen a notable warming trend. The average high temperatures have increased by 1.16°C (2.09°F), while the lows have risen even more significantly by 1.61°C (2.90°F). This recent warming trend is more pronounced than the all-time trends, which show a rise in highs by 0.43°C (0.77°F) and lows by 0.43°C (0.78°F). These shifts suggest a gradual warming pattern that could influence local ecosystems and agriculture.
Temperature Extremes: A Historical Perspective
Rezekne's climate history is marked by significant temperature extremes. The highest recorded temperature is 31.25°C (88.25°F), while the coldest plummeted to -39.25°C (-38.65°F). These extremes highlight the region's susceptibility to both heatwaves and severe cold spells, which can have profound impacts on infrastructure and human health. Understanding these records is crucial for future planning and adaptation strategies.
Precipitation Patterns: A Subtle Shift
The Precipitation Concentration Index (PCI) for Rezekne has seen a slight increase from a baseline of 11.20 to the current 11.41. The PCI measures how precipitation is distributed throughout the year; a higher value indicates more concentration in fewer events. This marginal increase suggests that rain and snowfall are becoming slightly more episodic, potentially leading to more intense weather events interspersed with drier periods. This shift is essential for water resource management and flood risk assessments.
Geographical Influences on Climate
Rezekne's geographical features, including its proximity to lakes and forests, play a significant role in its climate dynamics. These natural elements can moderate temperature extremes and influence precipitation patterns. The region's landscape supports a diverse ecosystem that may be sensitive to the ongoing climatic changes. As Latvia continues to pursue its climate goals, understanding these localised impacts becomes increasingly vital.
Regional Climate Goals and Adaptation
Latvia has set ambitious climate goals to reduce greenhouse gas emissions and enhance resilience against climate change impacts. The warming trends and changing precipitation patterns in Rezekne reflect broader regional challenges. These insights are critical for informing policy and ensuring that adaptation measures are effectively targeted to safeguard communities and natural resources in the face of a changing climate.
Station Statistics
10-Year Trend
High: +1.16 °C/decade
Low: +1.16 °C/decade
Rain: +0.31 mm/decade
25-Year Trend
High: +0.74 °C/decade
Low: +0.84 °C/decade
Rain: +0.02 mm/decade
50-Year Trend
High: +0.43 °C/decade
Low: +0.41 °C/decade
Rain: +0.13 mm/decade
All-Time Trend
High: +0.43 °C/decade
Low: +0.41 °C/decade
Rain: +0.14 mm/decade
Percentage Above-Average Days
Last 12 Months: 53.2%
This Year: 81.6%
Precipitation Concentration Index (PCI) ℹ️
Last 12 Months: 11.8
Historical Average: 11.8
Percentile Rank of Last 12 Months ℹ️
High: 97th percentile
Low: 97th percentile
Rain: 88th percentile
Change in Variance ℹ️
High: -5.0%
Low: -10.7%
Intraday: +4.7%
Data Coverage
72.2%
First Year of Data
1955
Station Location
Historical Weather Records
| Max High | Avg High | Min High | Max Avg | Avg Avg | Min Avg | Max Low | Avg Low | Min Low | Max Precipitation | Avg Precipitation | Max Snow | Avg Snow | |
|---|---|---|---|---|---|---|---|---|---|---|---|---|---|
| Record | 31.3 °C | — | -32.4 °C | 25.6 °C | — | -36.5 °C | 21.3 °C | — | -39.3 °C | 64.1 mm | — | — | — |
| January | 8.0 °C | -4.9 °C | -32.4 °C | 6.8 °C | -7.4 °C | -36.5 °C | 3.7 °C | -10.2 °C | -39.3 °C | 17.7 mm | 1.4 mm | — | — |
| February | 9.8 °C | -3.8 °C | -23.5 °C | 6.3 °C | -6.8 °C | -29.7 °C | 4.6 °C | -10.0 °C | -34.5 °C | 19.7 mm | 1.3 mm | — | — |
| March | 18.8 °C | 1.5 °C | -17.0 °C | 11.7 °C | -1.9 °C | -20.9 °C | 5.0 °C | -5.3 °C | -25.5 °C | 21.1 mm | 1.2 mm | — | — |
| April | 25.2 °C | 9.8 °C | -3.4 °C | 18.0 °C | 5.1 °C | -4.9 °C | 12.4 °C | 0.6 °C | -10.2 °C | 33.4 mm | 1.4 mm | — | — |
| May | 28.5 °C | 16.3 °C | 4.0 °C | 22.6 °C | 11.5 °C | 1.0 °C | 18.4 °C | 6.2 °C | -4.3 °C | 38.9 mm | 2.0 mm | — | — |
| June | 31.0 °C | 19.7 °C | 8.3 °C | 25.2 °C | 15.4 °C | 5.1 °C | 21.0 °C | 10.5 °C | 1.2 °C | 53.8 mm | 2.5 mm | — | — |
| July | 30.9 °C | 21.7 °C | 11.7 °C | 25.6 °C | 17.5 °C | 10.3 °C | 21.3 °C | 12.9 °C | 4.3 °C | 51.8 mm | 2.8 mm | — | — |
| August | 31.3 °C | 20.8 °C | 11.5 °C | 25.5 °C | 16.3 °C | 7.7 °C | 21.1 °C | 11.8 °C | 2.1 °C | 64.1 mm | 2.5 mm | — | — |
| September | 27.5 °C | 15.5 °C | 4.2 °C | 21.6 °C | 11.2 °C | 0.7 °C | 17.3 °C | 7.5 °C | -3.7 °C | 45.3 mm | 2.0 mm | — | — |
| October | 20.5 °C | 8.5 °C | -3.6 °C | 15.2 °C | 5.3 °C | -8.4 °C | 12.5 °C | 2.6 °C | -12.8 °C | 30.3 mm | 2.0 mm | — | — |
| November | 12.5 °C | 1.5 °C | -14.7 °C | 9.9 °C | -0.4 °C | -18.3 °C | 7.4 °C | -2.4 °C | -21.6 °C | 27.3 mm | 1.8 mm | — | — |
| December | 9.3 °C | -3.2 °C | -24.4 °C | 7.7 °C | -5.3 °C | -28.7 °C | 6.0 °C | -7.8 °C | -32.3 °C | 18.1 mm | 1.5 mm | — | — |
Data Visualisations
Remove WatermarksCurrent Year Climate Trends vs Historical


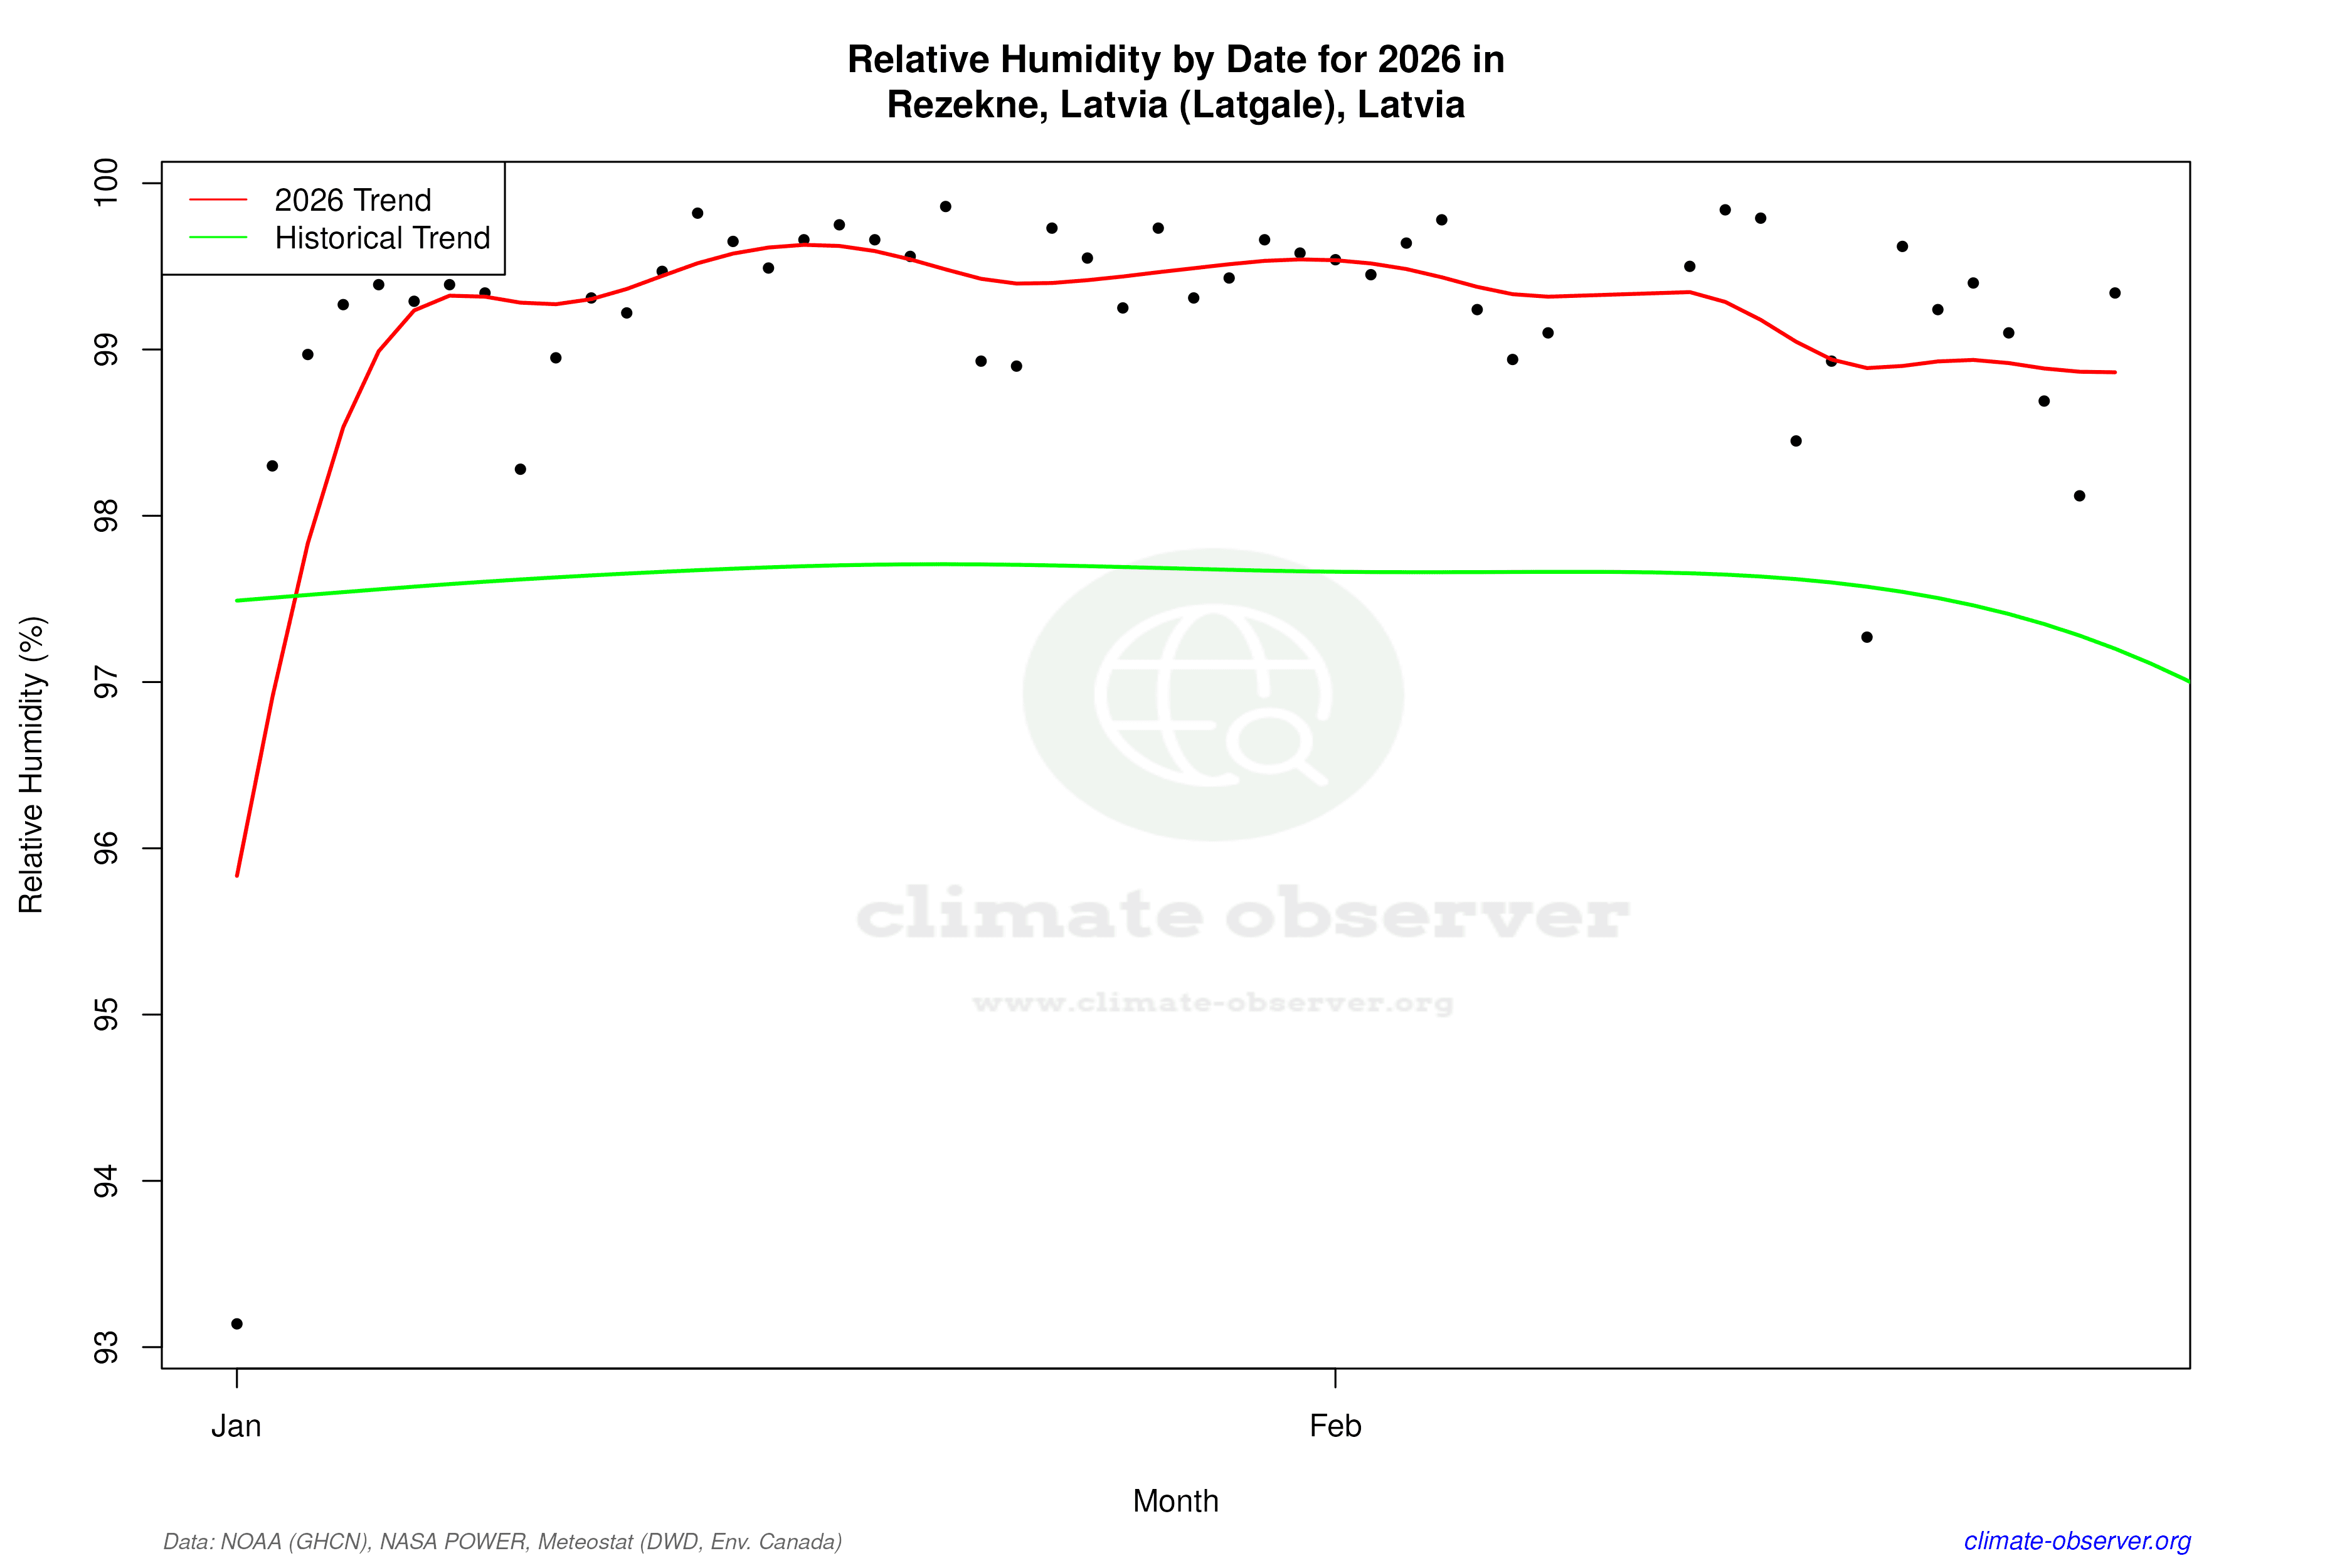

Max Temperature this Year | 1 of 6
Climate 12-Month Moving Averages


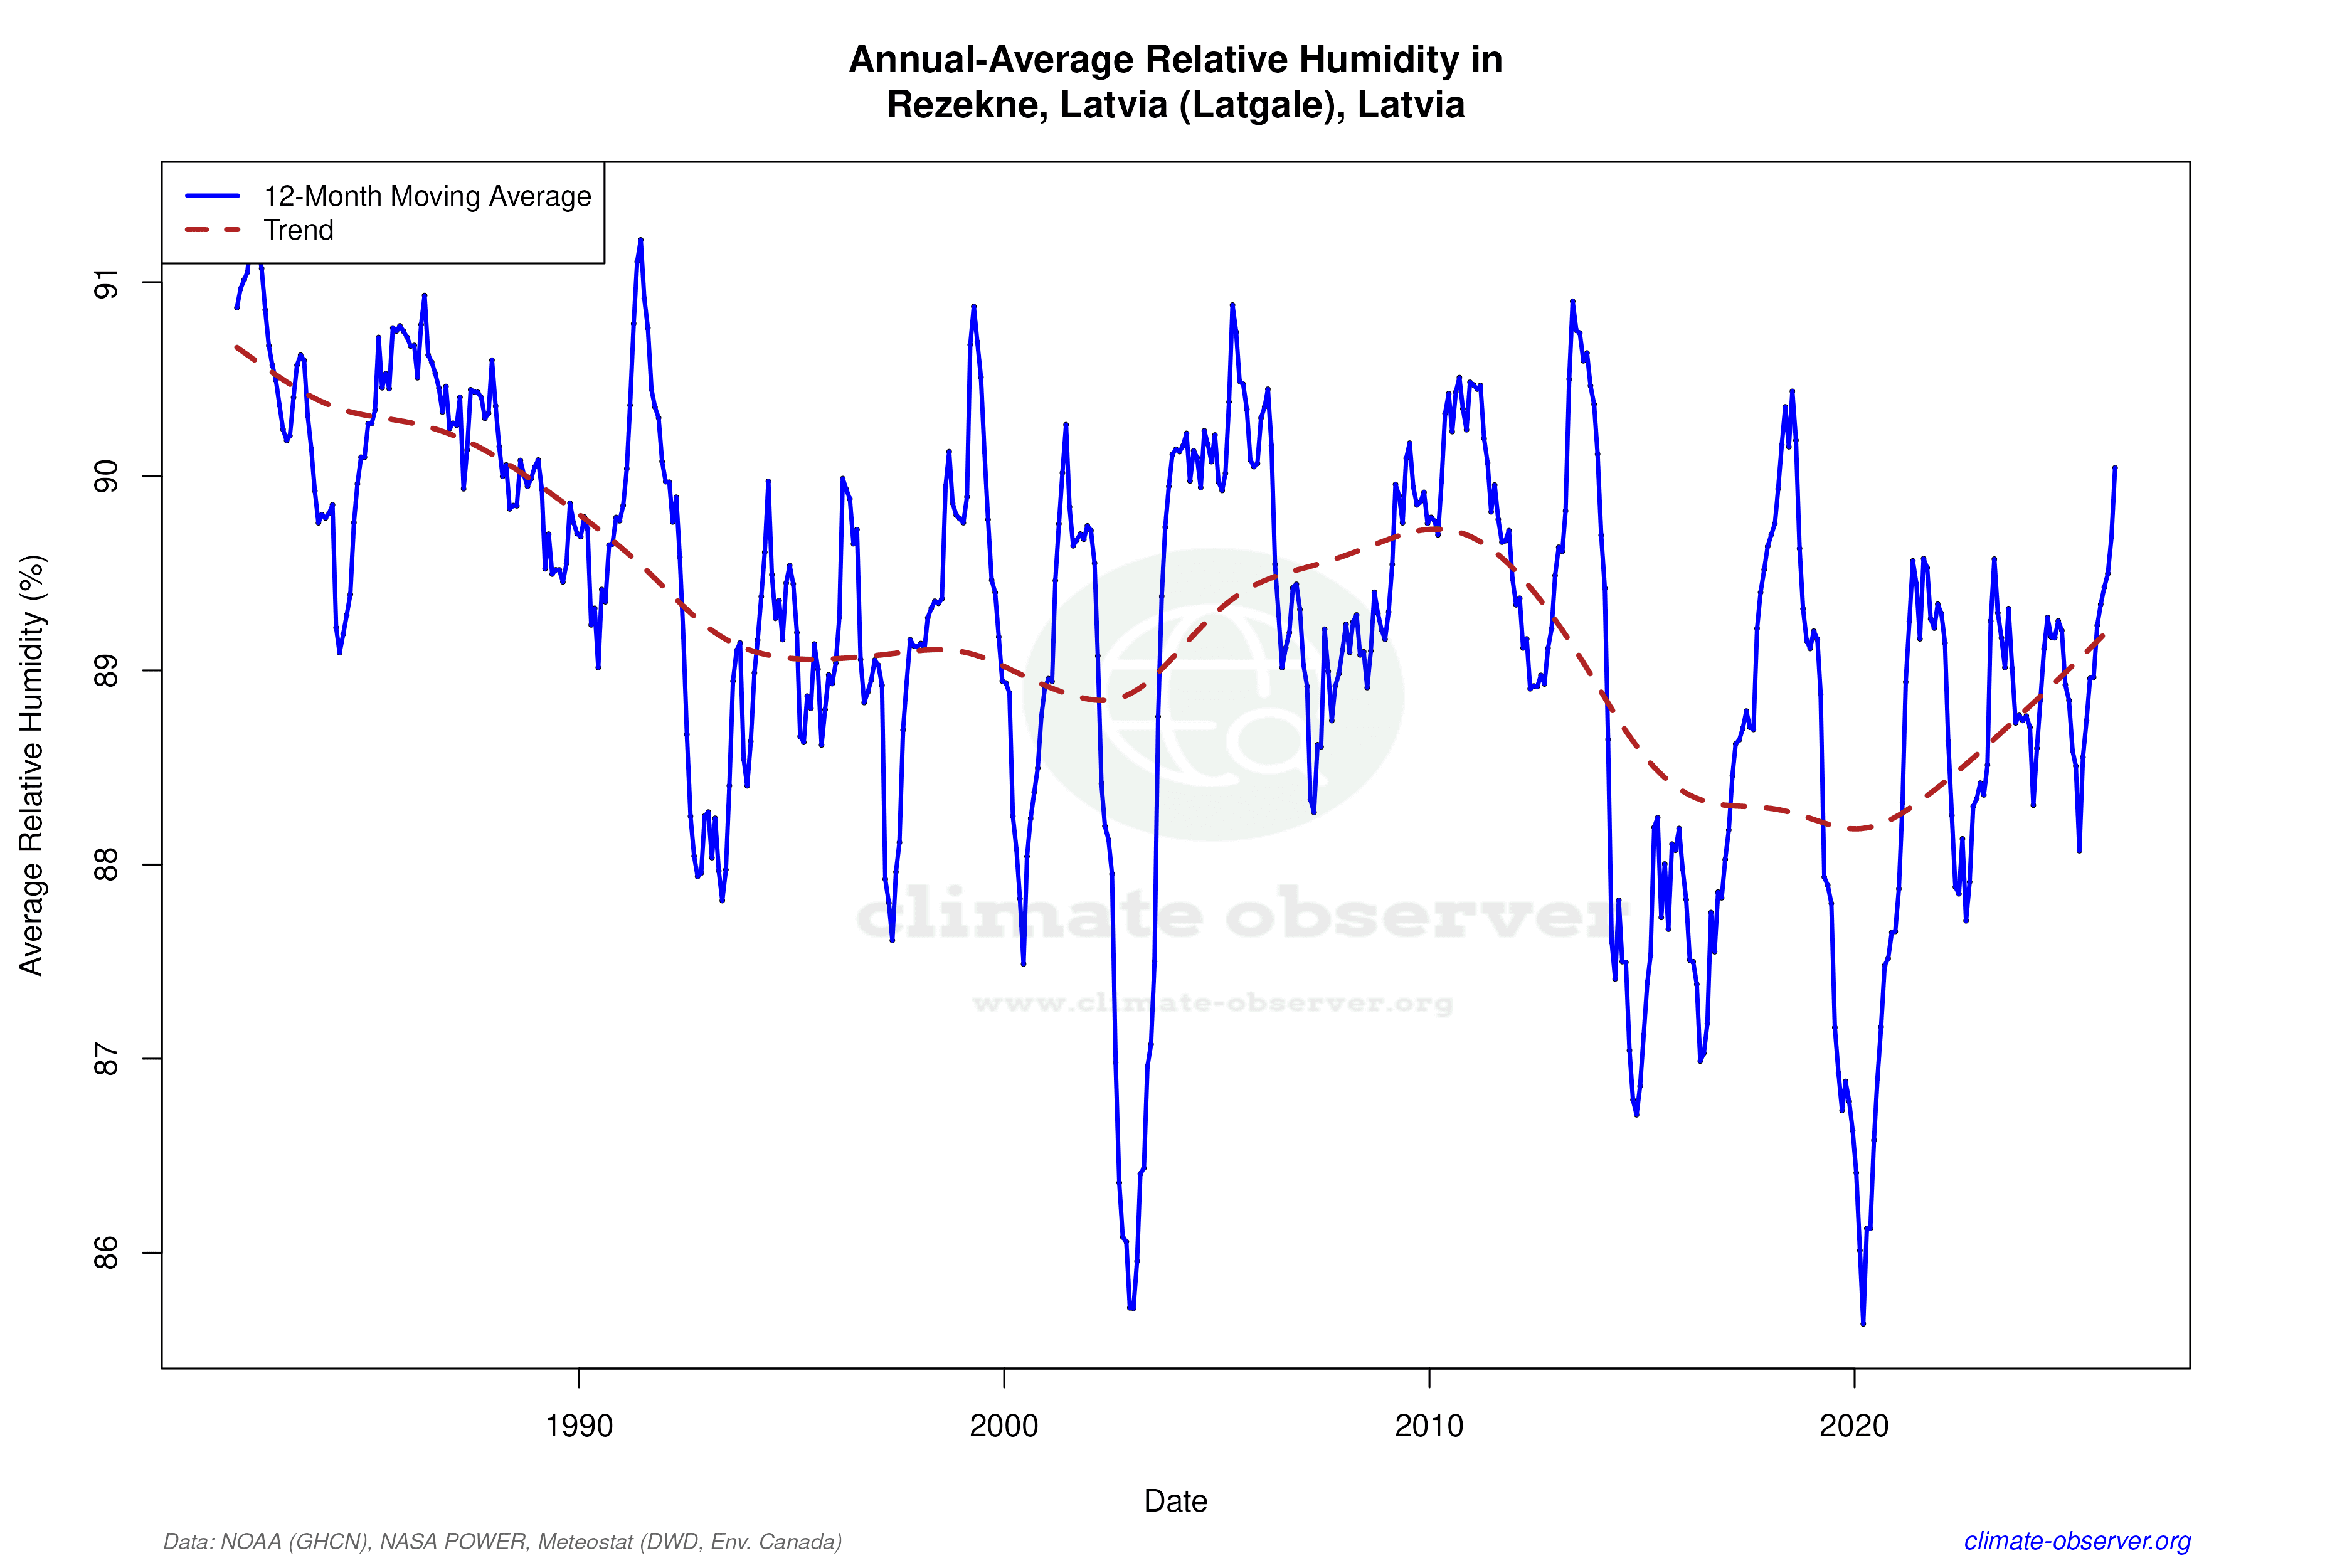

Max Temperature 12-Month MA | 1 of 6
Daily Data Points and Averages Throughout the Year


Average Max Temperature Throughout Year | 1 of 5
