Climate for Station: Zuara, Nuqat al Khams District, Libya
Loading live weather...
Climate Analysis & Overview
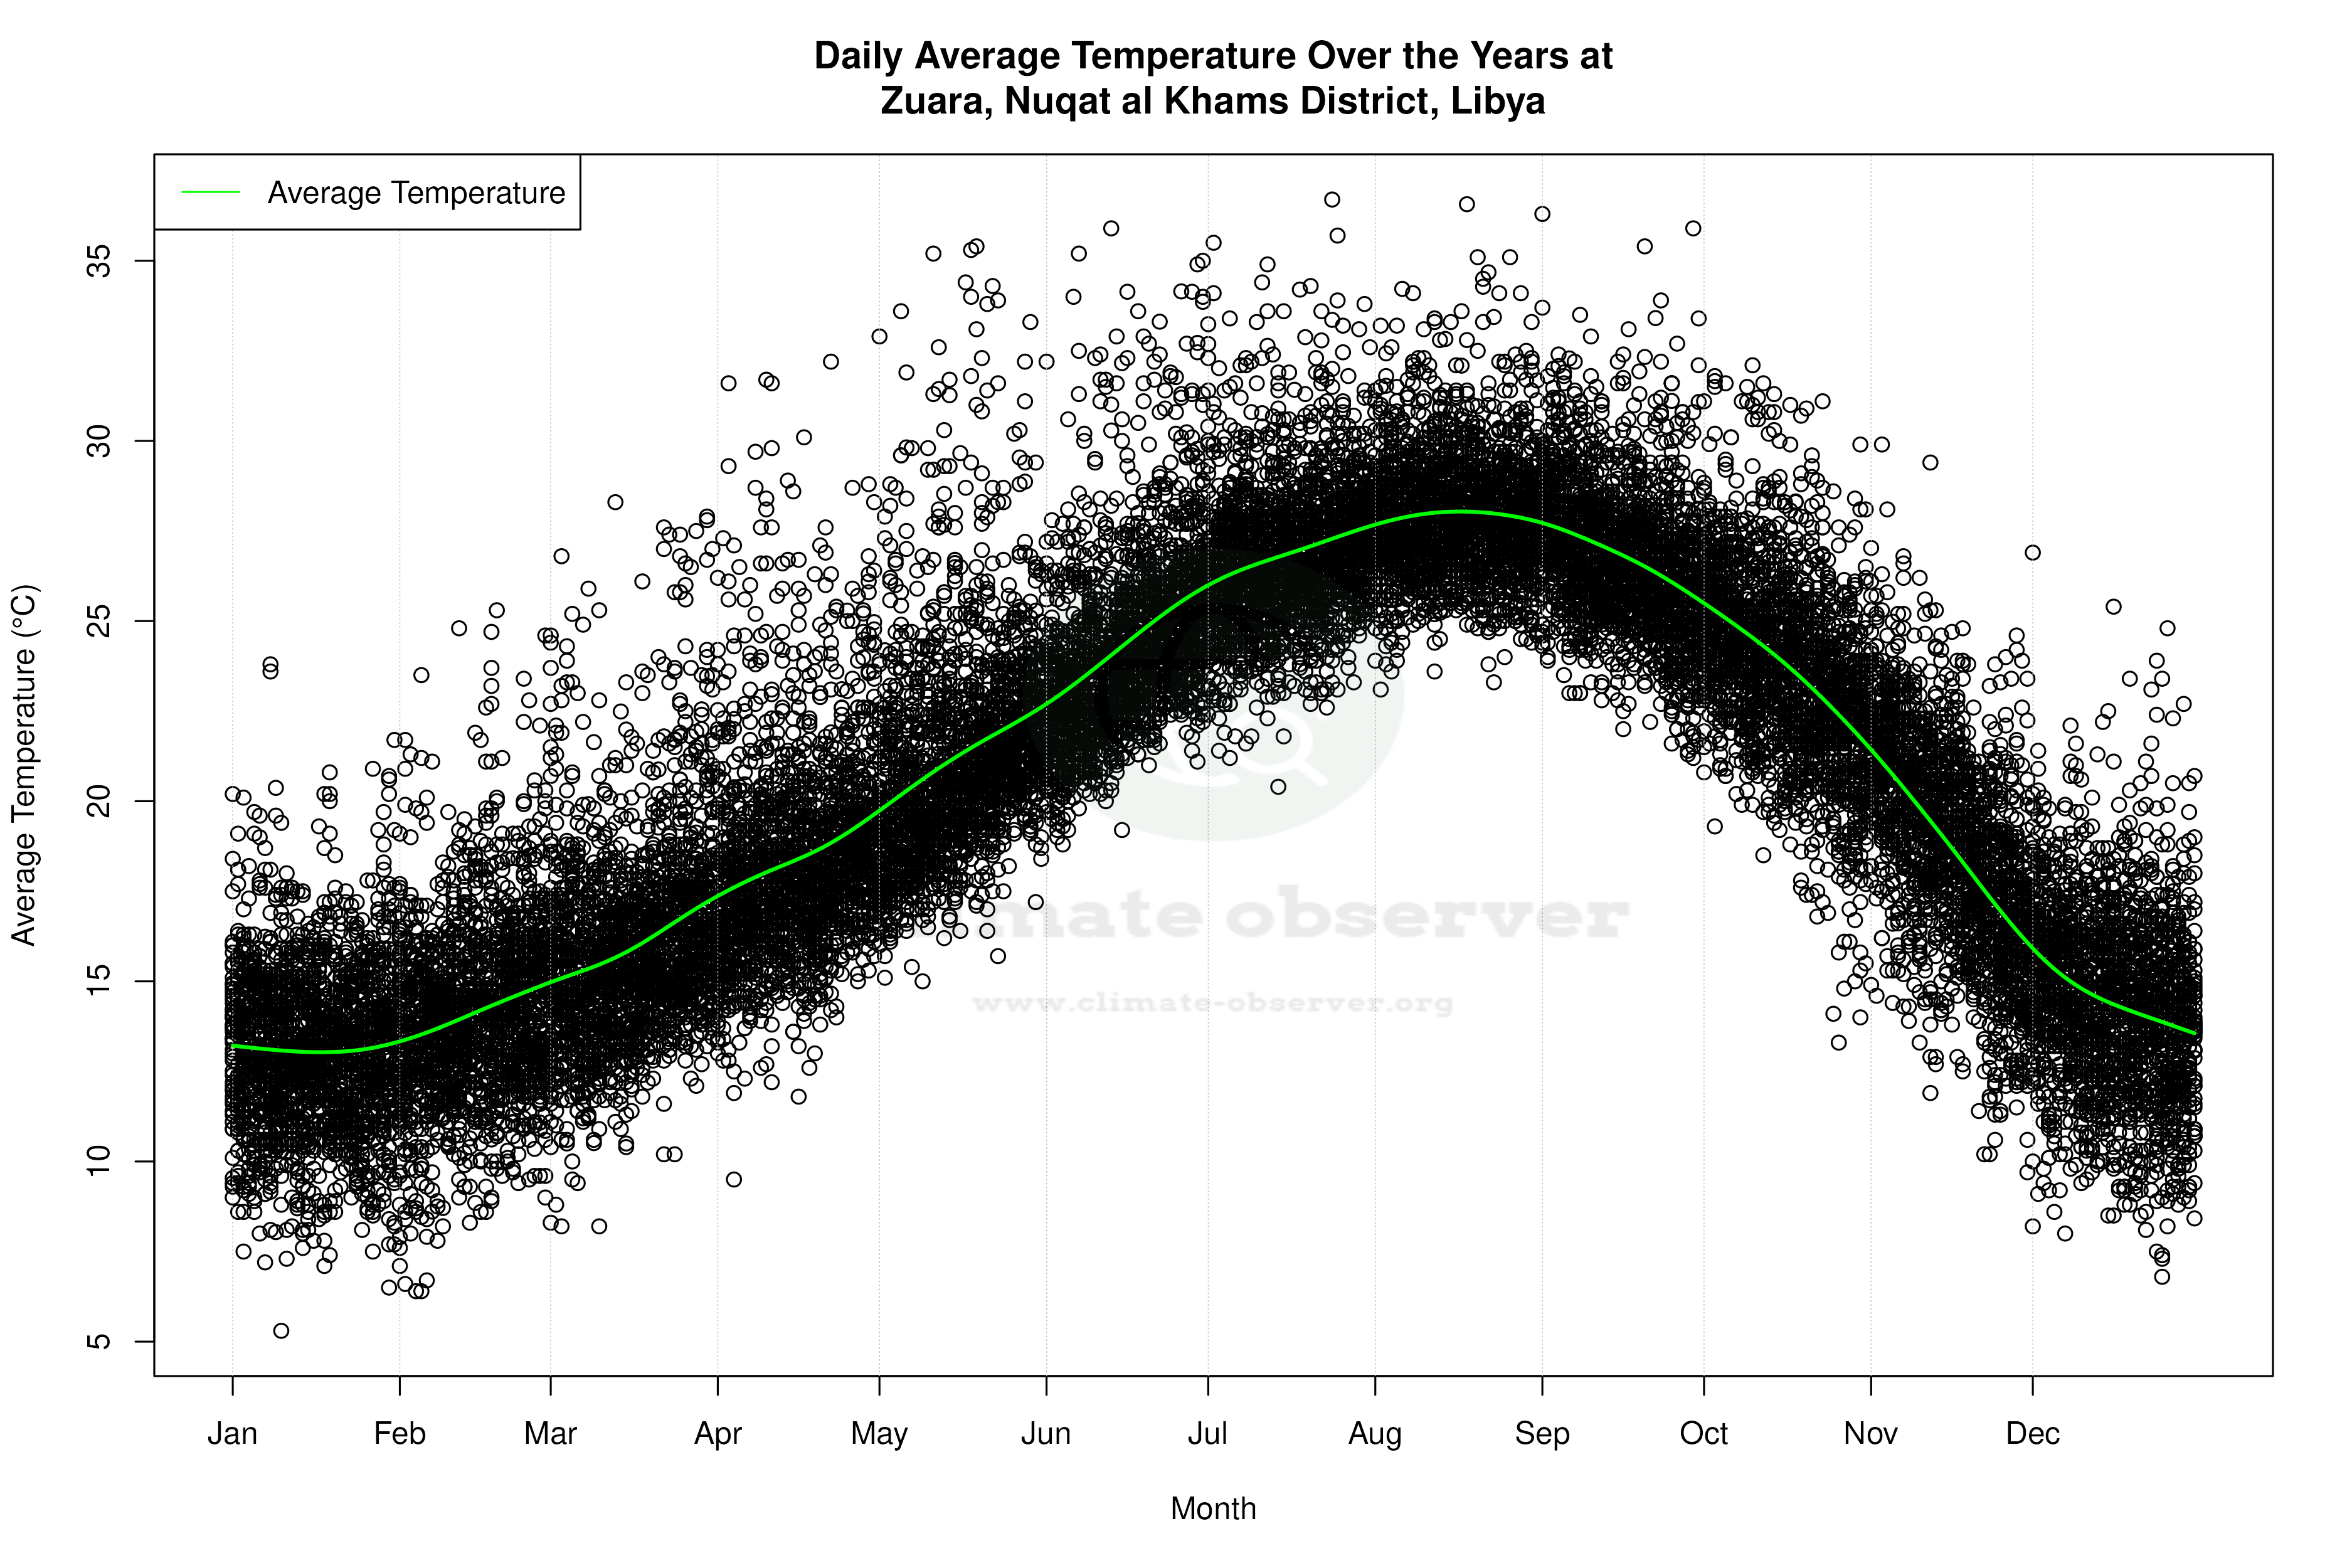
Zuara, Libya, is experiencing a warming trend with notable differences between short-term and long-term temperature changes. Precipitation is becoming more evenly distributed, indicating shifts in local weather patterns. Understanding these trends is vital for aligning with Libya's regional climate goals.
Desert Climate Dynamics
Zuara, located at 32.88°N, 12.08°E, is characterised by a hot desert climate, classified as BWh under the Köppen system. This classification reflects its arid conditions, with minimal rainfall and high temperatures. The city's proximity to the Mediterranean Sea tempers the extreme heat typical of inland desert areas, providing a unique microclimate within the broader Saharan context.
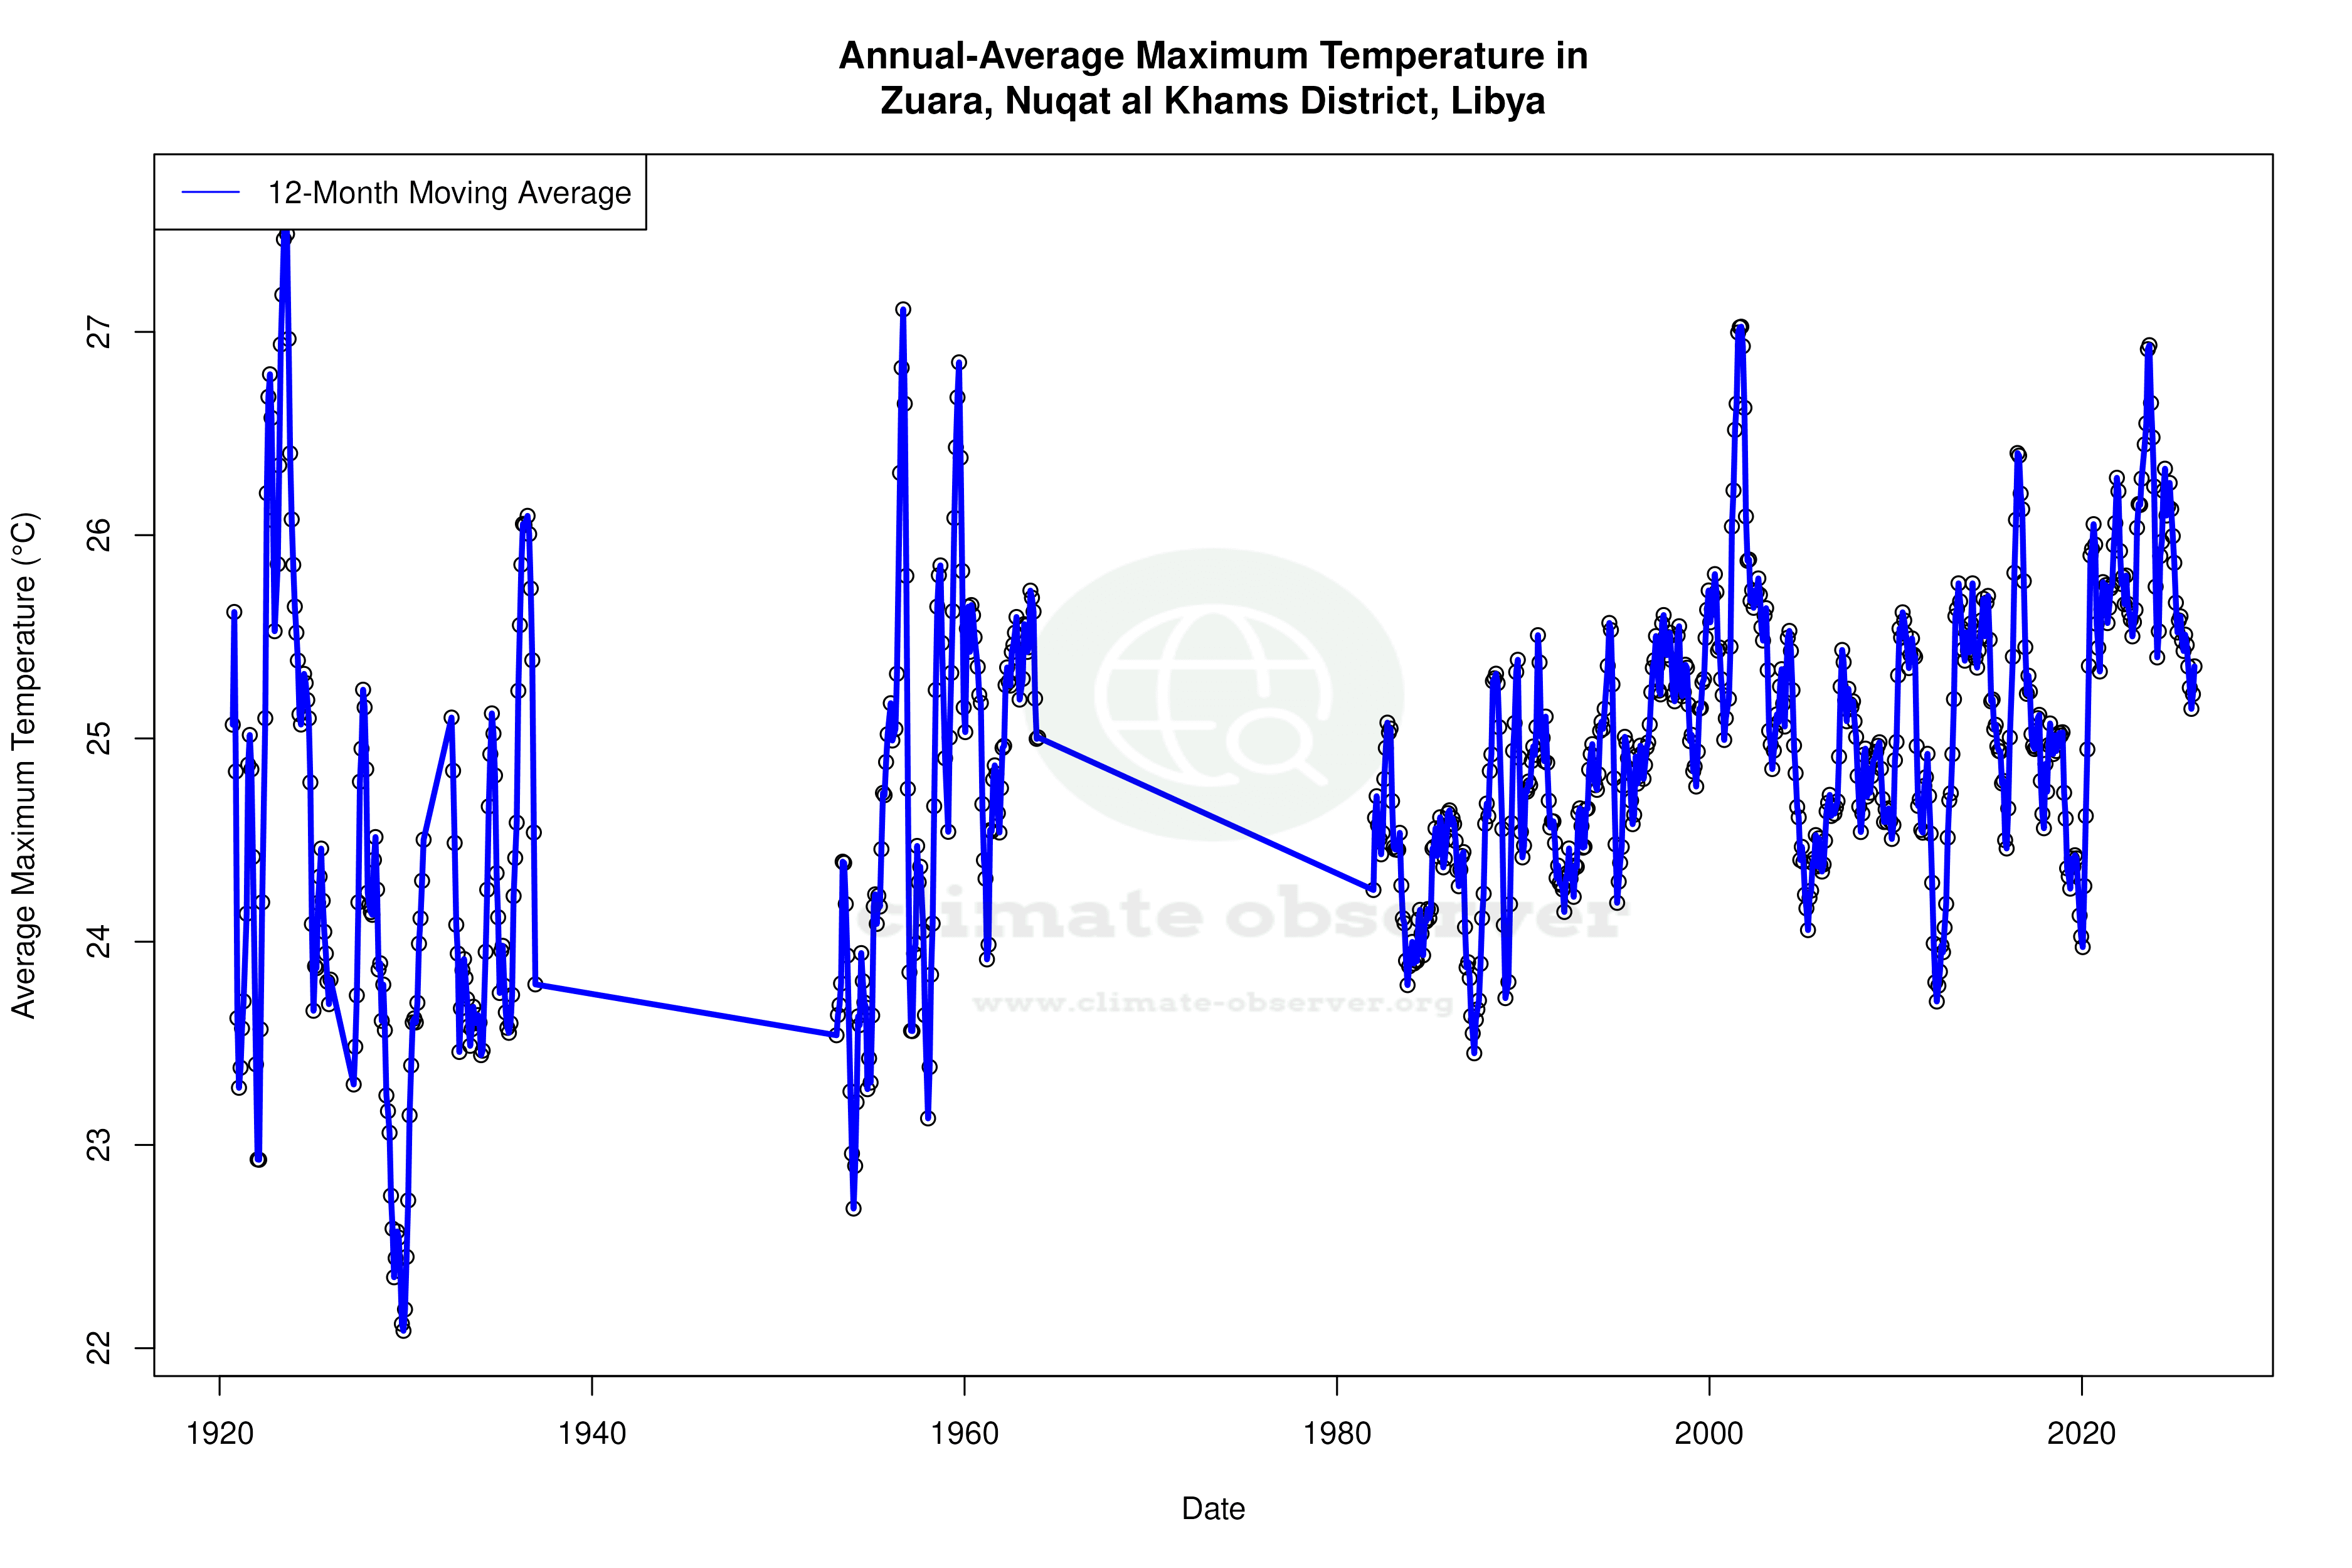
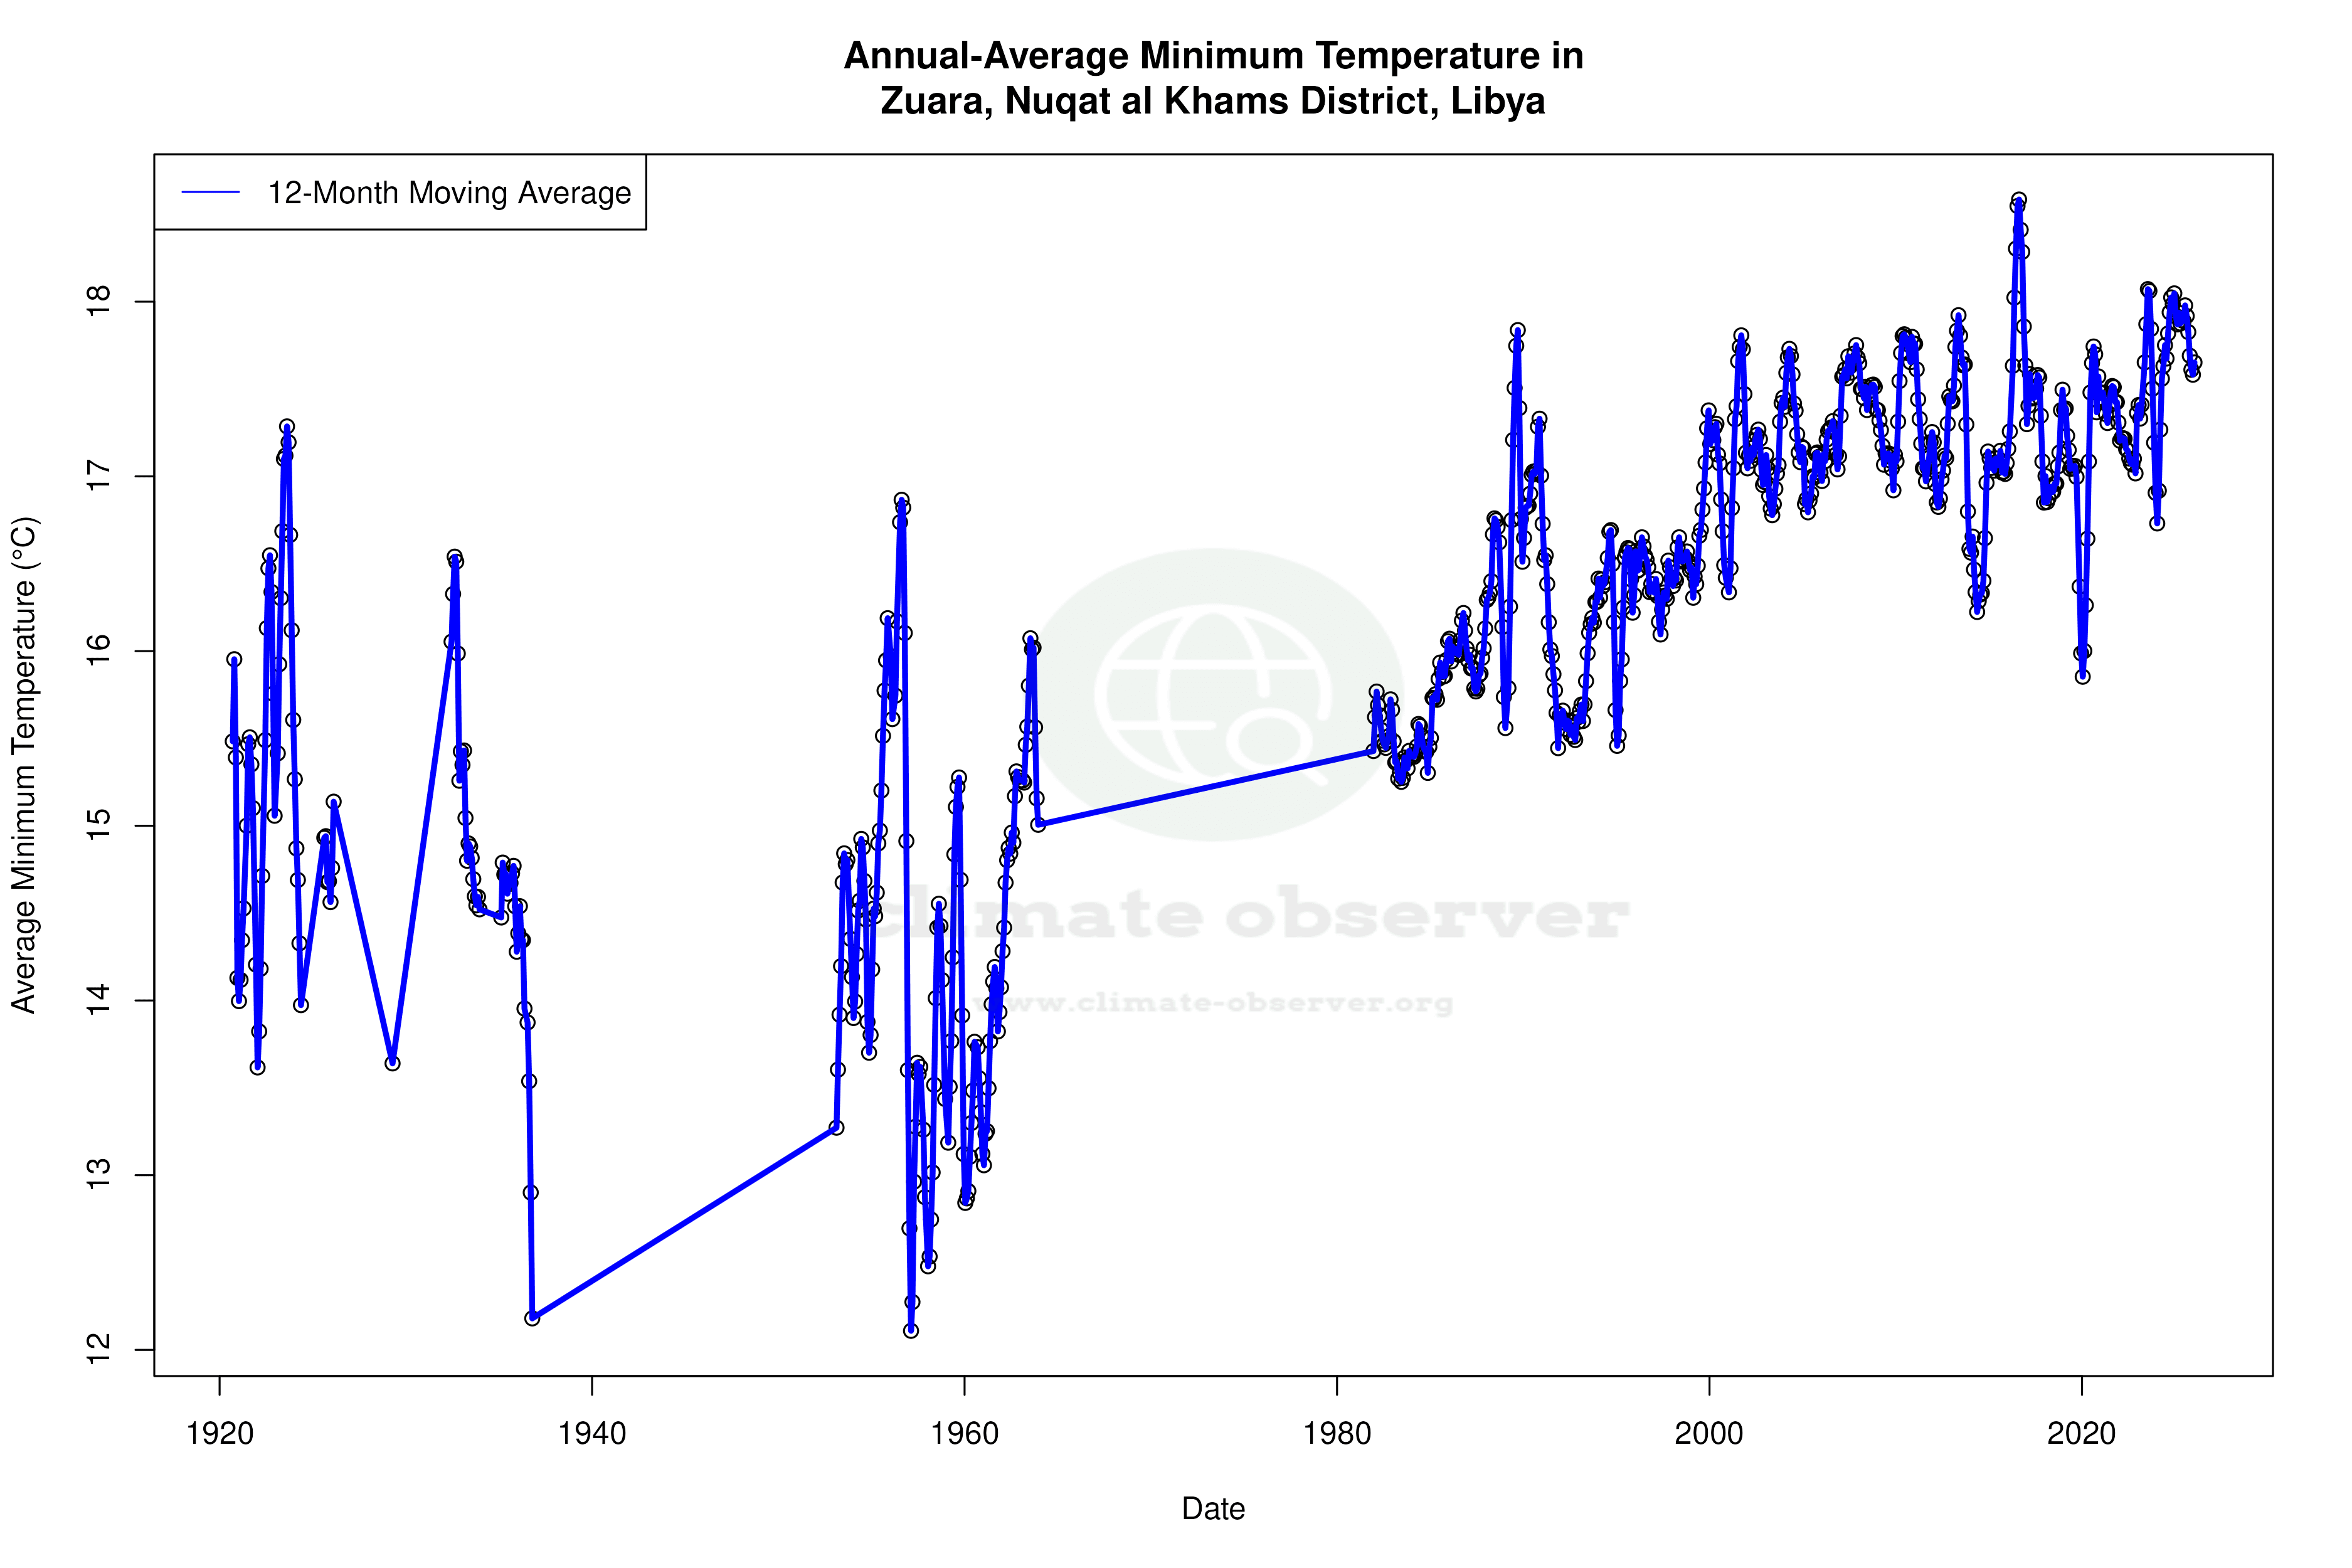
Temperature Trends: A Dual Perspective
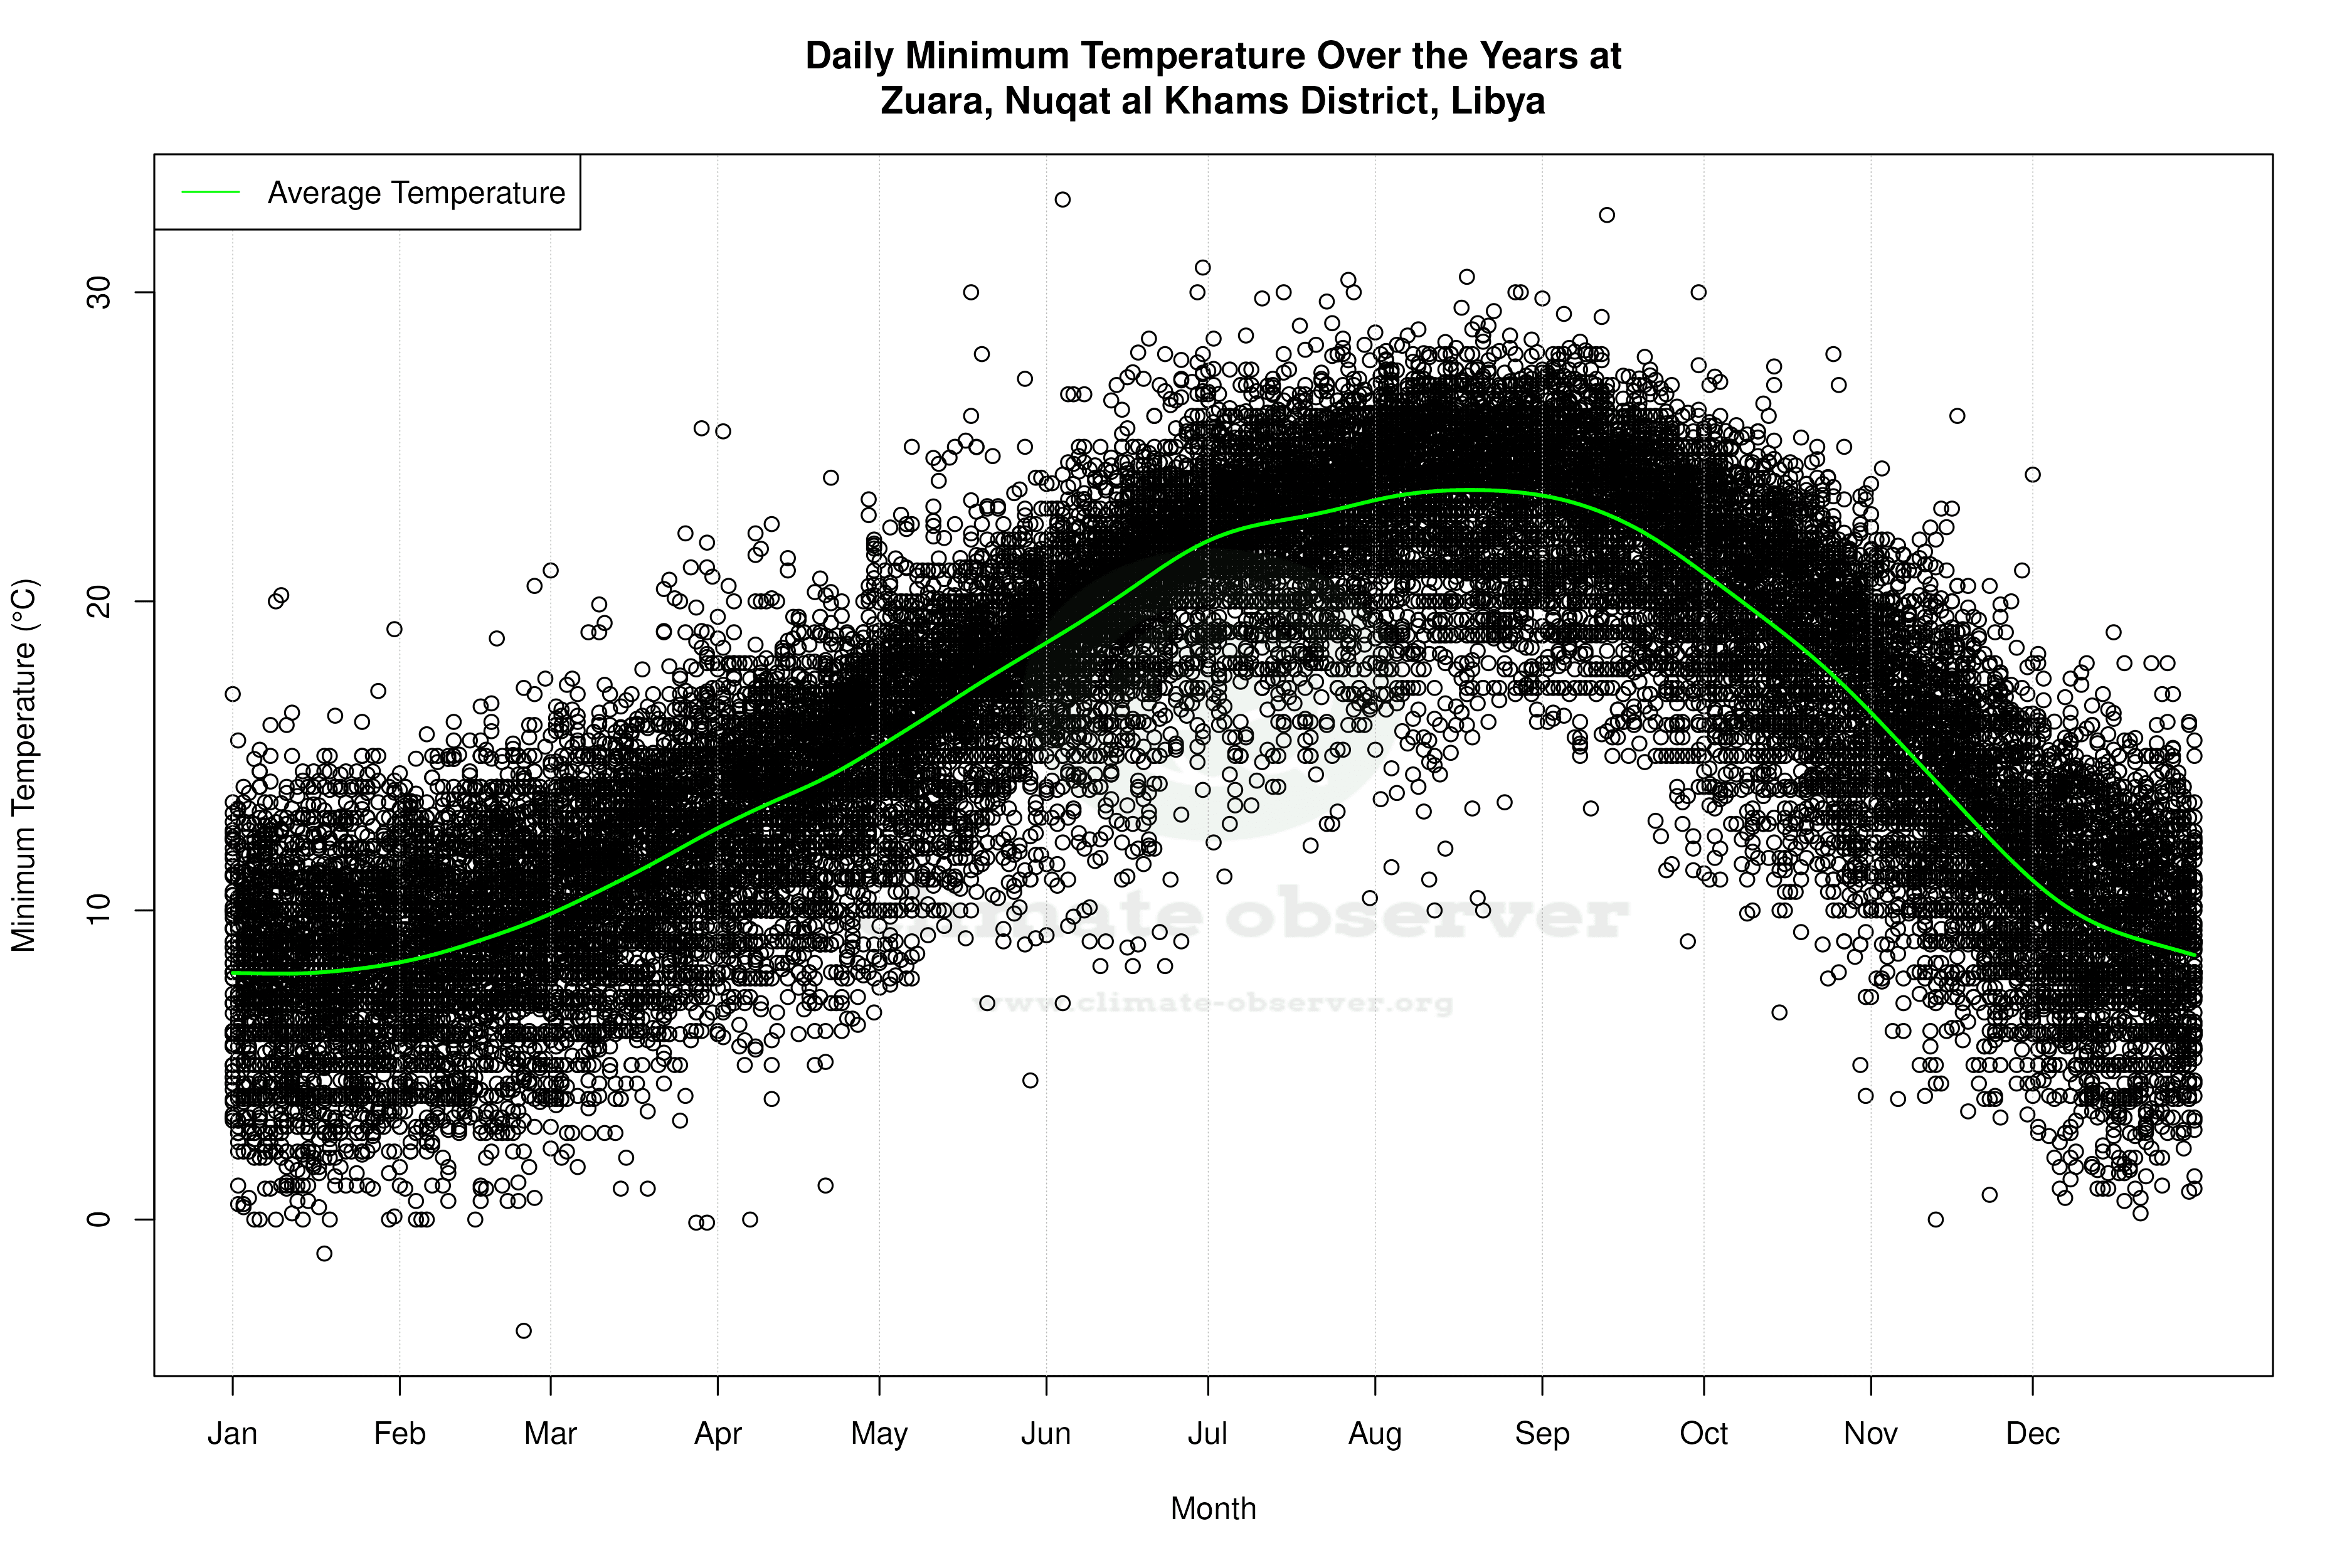
In the past decade, Zuara has experienced a significant warming trend, with high temperatures rising by 0.98°C (1.76°F) and lows by 0.44°C (0.79°F). This short-term trend contrasts with the all-time data, where highs have increased by a modest 0.11°C (0.20°F), while lows have risen by 0.34°C (0.61°F). The discrepancy between these intervals suggests a recent acceleration in warming, potentially linked to broader regional climate changes or localised factors such as urbanisation.
Temperature Extremes: Record Highs and Lows
Zuara has recorded an absolute maximum temperature of 44.5°C (112.1°F), indicative of its desert climate. Conversely, the minimum temperature plummeted to -3.6°C (25.5°F), a reminder of the stark diurnal temperature variations typical in desert environments. These extremes highlight the resilience required for both human and ecological systems in the region.
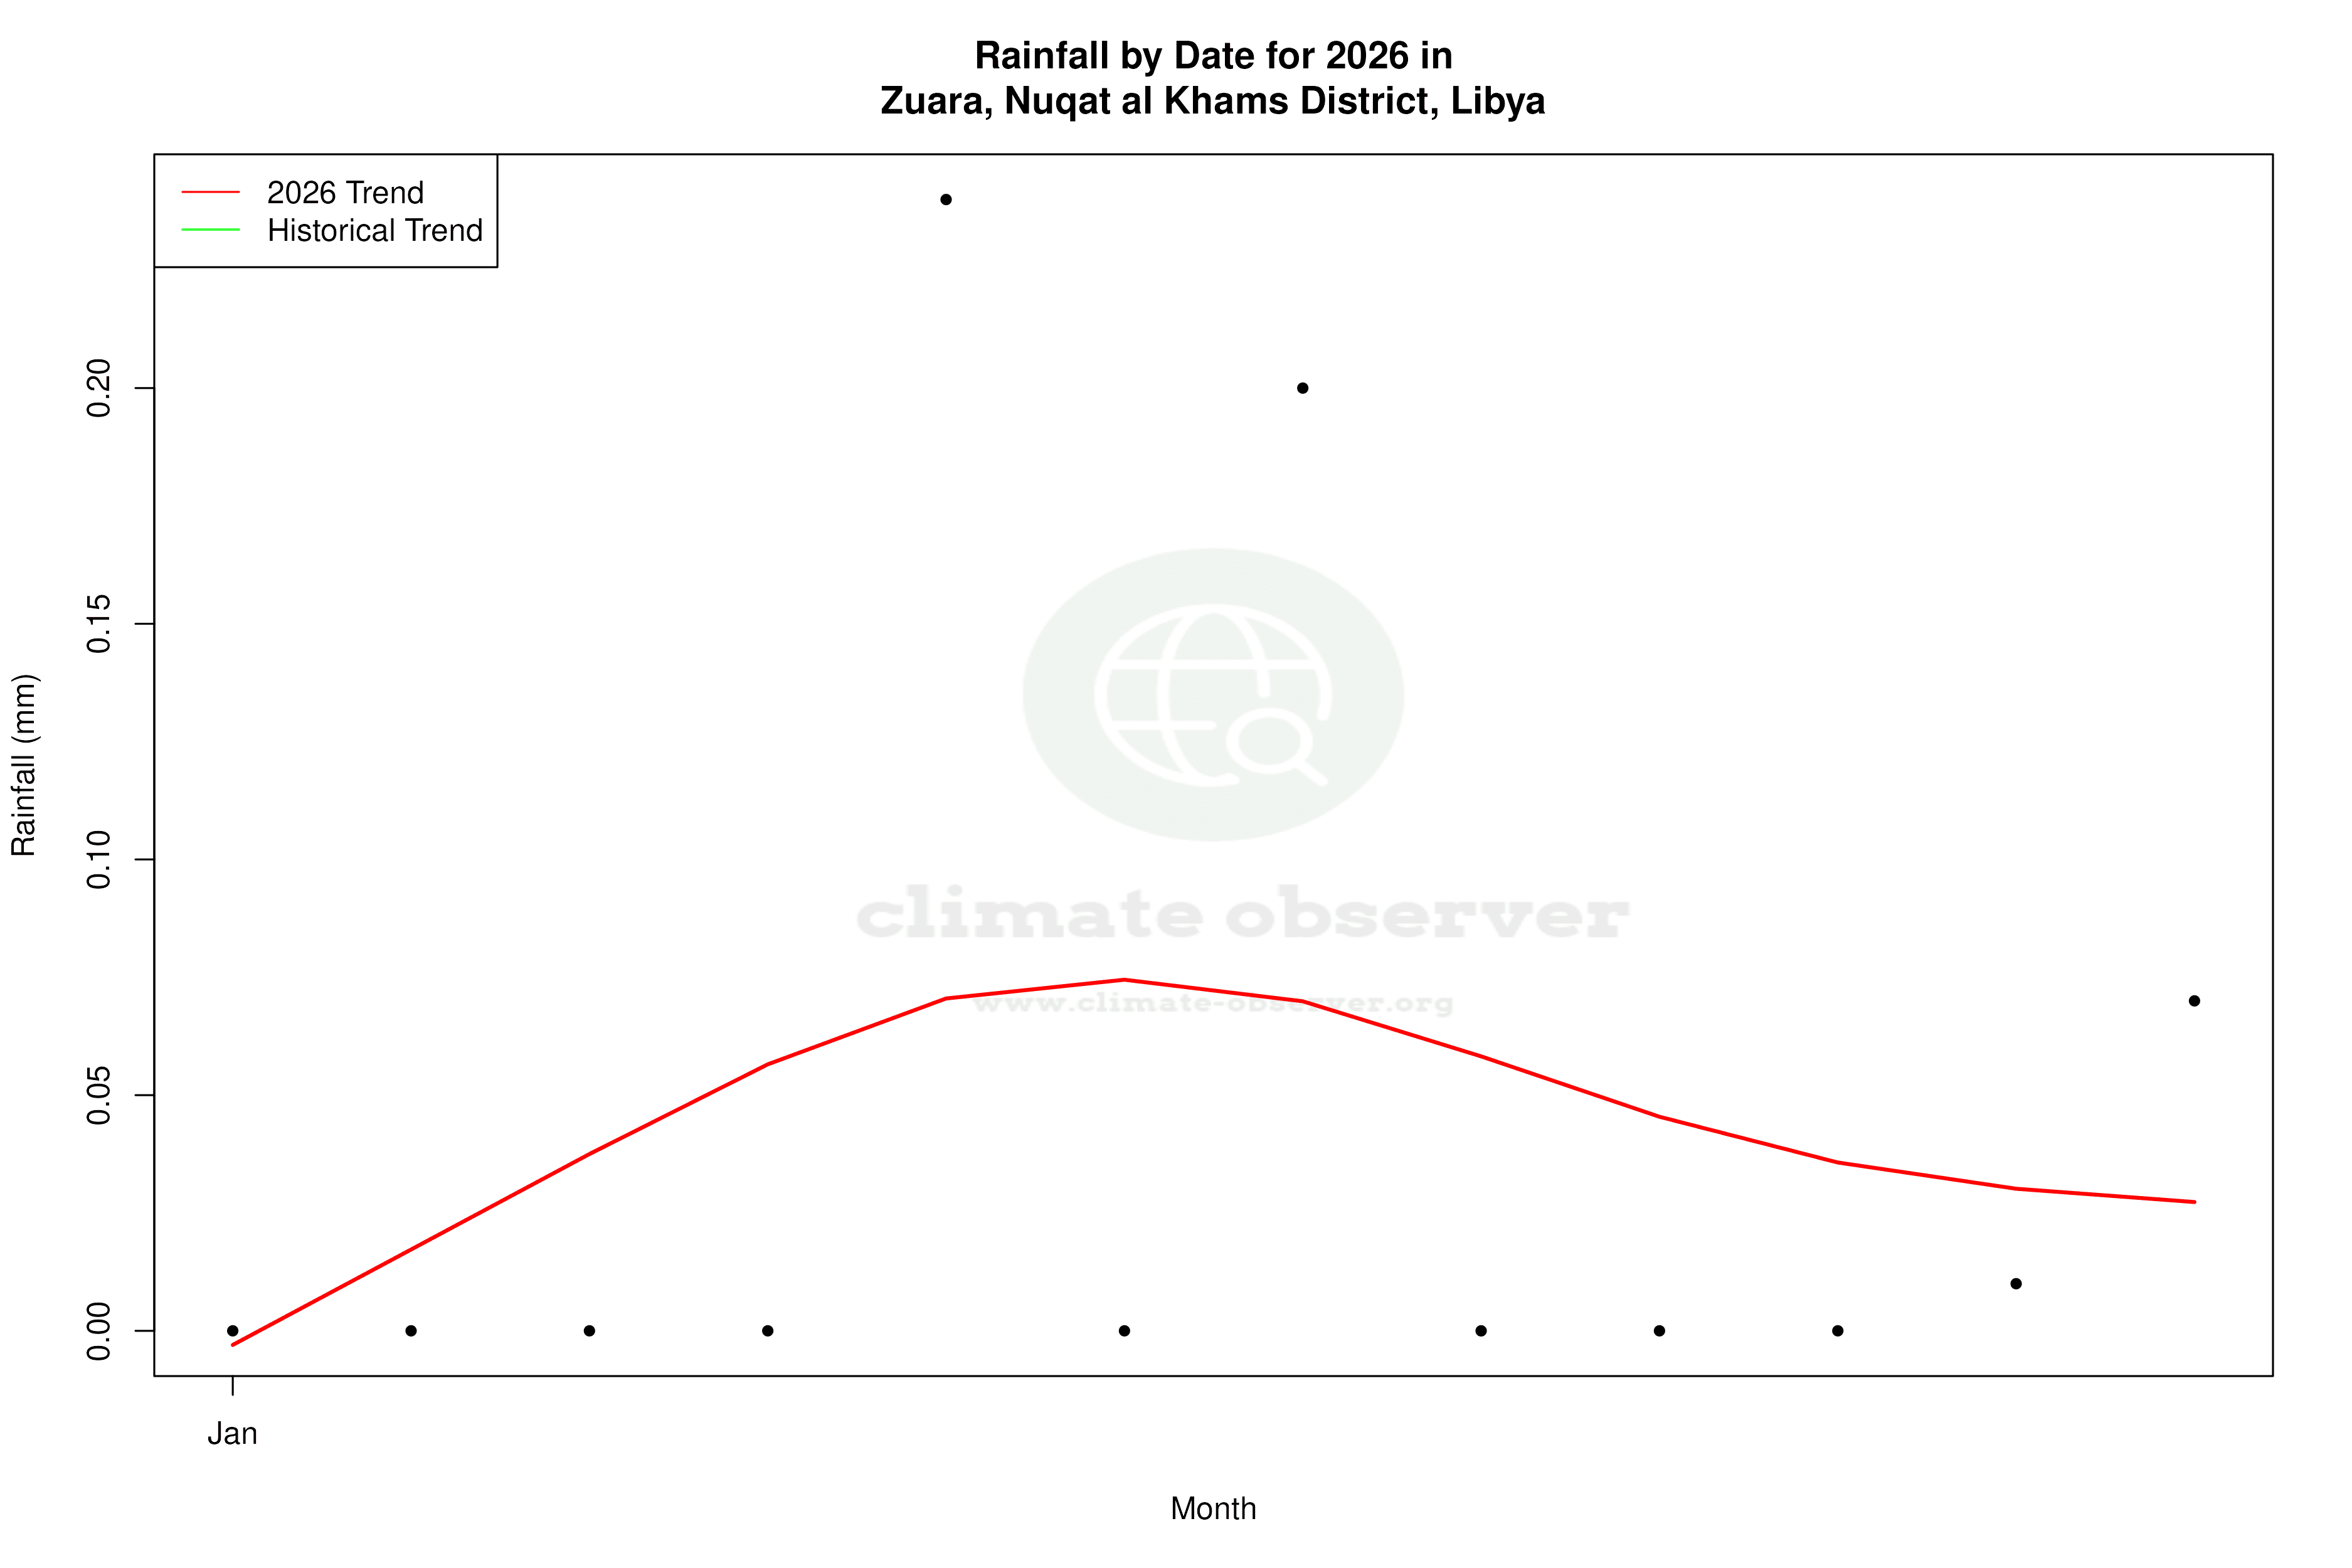
Precipitation Patterns: A Shift Towards Even Distribution
The Precipitation Concentration Index (PCI) for Zuara has decreased from a baseline of 22.4 to a current value of 17.7. This shift indicates that precipitation events are becoming more evenly distributed throughout the year, reducing the concentration of rainfall in fewer, more intense events. This change could mitigate the risk of flash flooding, a common issue in arid regions when rain falls in concentrated bursts.
Regional Implications and Climate Goals
Zuara's climate trends are not isolated; they reflect broader patterns observed across Libya and the North African region. As Libya works towards its climate goals, understanding localised changes such as those in Zuara is crucial for developing effective adaptation and mitigation strategies. The recent shifts in temperature and precipitation patterns may inform policy decisions, infrastructure planning, and community preparedness initiatives.
Station Statistics
10-Year Trend
High: +0.98 °C/decade
Low: +0.45 °C/decade
Rain: -0.15 mm/decade
25-Year Trend
High: +0.23 °C/decade
Low: +0.12 °C/decade
Rain: +0.01 mm/decade
50-Year Trend
High: +0.25 °C/decade
Low: +0.43 °C/decade
Rain: +0.02 mm/decade
All-Time Trend
High: +0.11 °C/decade
Low: +0.34 °C/decade
Rain: -0.01 mm/decade
Percentage Above-Average Days
Last 12 Months: 55.1%
This Year: 73.7%
Precipitation Concentration Index (PCI) ℹ️
Last 12 Months: 20.9
Historical Average: 25.1
Percentile Rank of Last 12 Months ℹ️
High: 77th percentile
Low: 98th percentile
Rain: 52nd percentile
Change in Variance ℹ️
High: -1.0%
Low: -5.1%
Intraday: -35.2%
Data Coverage
68.3%
First Year of Data
1931
Station Location
Historical Weather Records
| Max High | Avg High | Min High | Max Avg | Avg Avg | Min Avg | Max Low | Avg Low | Min Low | Max Precipitation | Avg Precipitation | Max Snow | Avg Snow | |
|---|---|---|---|---|---|---|---|---|---|---|---|---|---|
| Record | 49.0 °C | — | 7.8 °C | 36.7 °C | — | 5.3 °C | 33.0 °C | — | -3.6 °C | 106.0 mm | — | — | — |
| January | 31.8 °C | 17.4 °C | 8.3 °C | 23.8 °C | 13.1 °C | 5.3 °C | 20.2 °C | 8.1 °C | -1.1 °C | 47.3 mm | 1.0 mm | — | — |
| February | 36.4 °C | 18.5 °C | 10.6 °C | 25.3 °C | 14.1 °C | 6.4 °C | 20.5 °C | 9.0 °C | -3.6 °C | 51.2 mm | 0.8 mm | — | — |
| March | 41.7 °C | 20.5 °C | 12.0 °C | 28.3 °C | 16.0 °C | 8.2 °C | 25.6 °C | 11.2 °C | -0.1 °C | 80.0 mm | 0.5 mm | — | — |
| April | 42.1 °C | 22.9 °C | 14.0 °C | 32.2 °C | 18.4 °C | 9.5 °C | 25.5 °C | 13.9 °C | 0.0 °C | 30.0 mm | 0.3 mm | — | — |
| May | 44.0 °C | 25.4 °C | 16.5 °C | 35.4 °C | 21.3 °C | 15.0 °C | 30.0 °C | 16.9 °C | 4.5 °C | 35.6 mm | 0.2 mm | — | — |
| June | 49.0 °C | 28.4 °C | 20.0 °C | 35.9 °C | 24.3 °C | 18.8 °C | 33.0 °C | 20.3 °C | 7.0 °C | 20.8 mm | 0.0 mm | — | — |
| July | 47.2 °C | 30.8 °C | 22.4 °C | 36.7 °C | 26.9 °C | 20.4 °C | 30.4 °C | 22.6 °C | 10.4 °C | 0.8 mm | 0.0 mm | — | — |
| August | 47.7 °C | 31.7 °C | 25.3 °C | 36.6 °C | 27.9 °C | 23.1 °C | 30.5 °C | 23.5 °C | 10.0 °C | 22.6 mm | 0.0 mm | — | — |
| September | 47.4 °C | 30.5 °C | 21.3 °C | 36.3 °C | 26.8 °C | 21.2 °C | 32.5 °C | 22.5 °C | 9.0 °C | 38.3 mm | 0.3 mm | — | — |
| October | 46.0 °C | 27.8 °C | 12.3 °C | 32.1 °C | 23.7 °C | 13.3 °C | 28.0 °C | 18.9 °C | 4.0 °C | 94.1 mm | 0.9 mm | — | — |
| November | 36.5 °C | 23.4 °C | 12.8 °C | 29.9 °C | 18.8 °C | 9.7 °C | 26.0 °C | 13.7 °C | 0.0 °C | 106.0 mm | 1.2 mm | — | — |
| December | 32.5 °C | 18.9 °C | 7.8 °C | 26.9 °C | 14.4 °C | 6.8 °C | 24.1 °C | 9.5 °C | 0.2 °C | 75.8 mm | 1.4 mm | — | — |
Data Visualisations
Remove WatermarksCurrent Year Climate Trends vs Historical


Max Temperature this Year | 1 of 6
Climate 12-Month Moving Averages


Max Temperature 12-Month MA | 1 of 6
Daily Data Points and Averages Throughout the Year
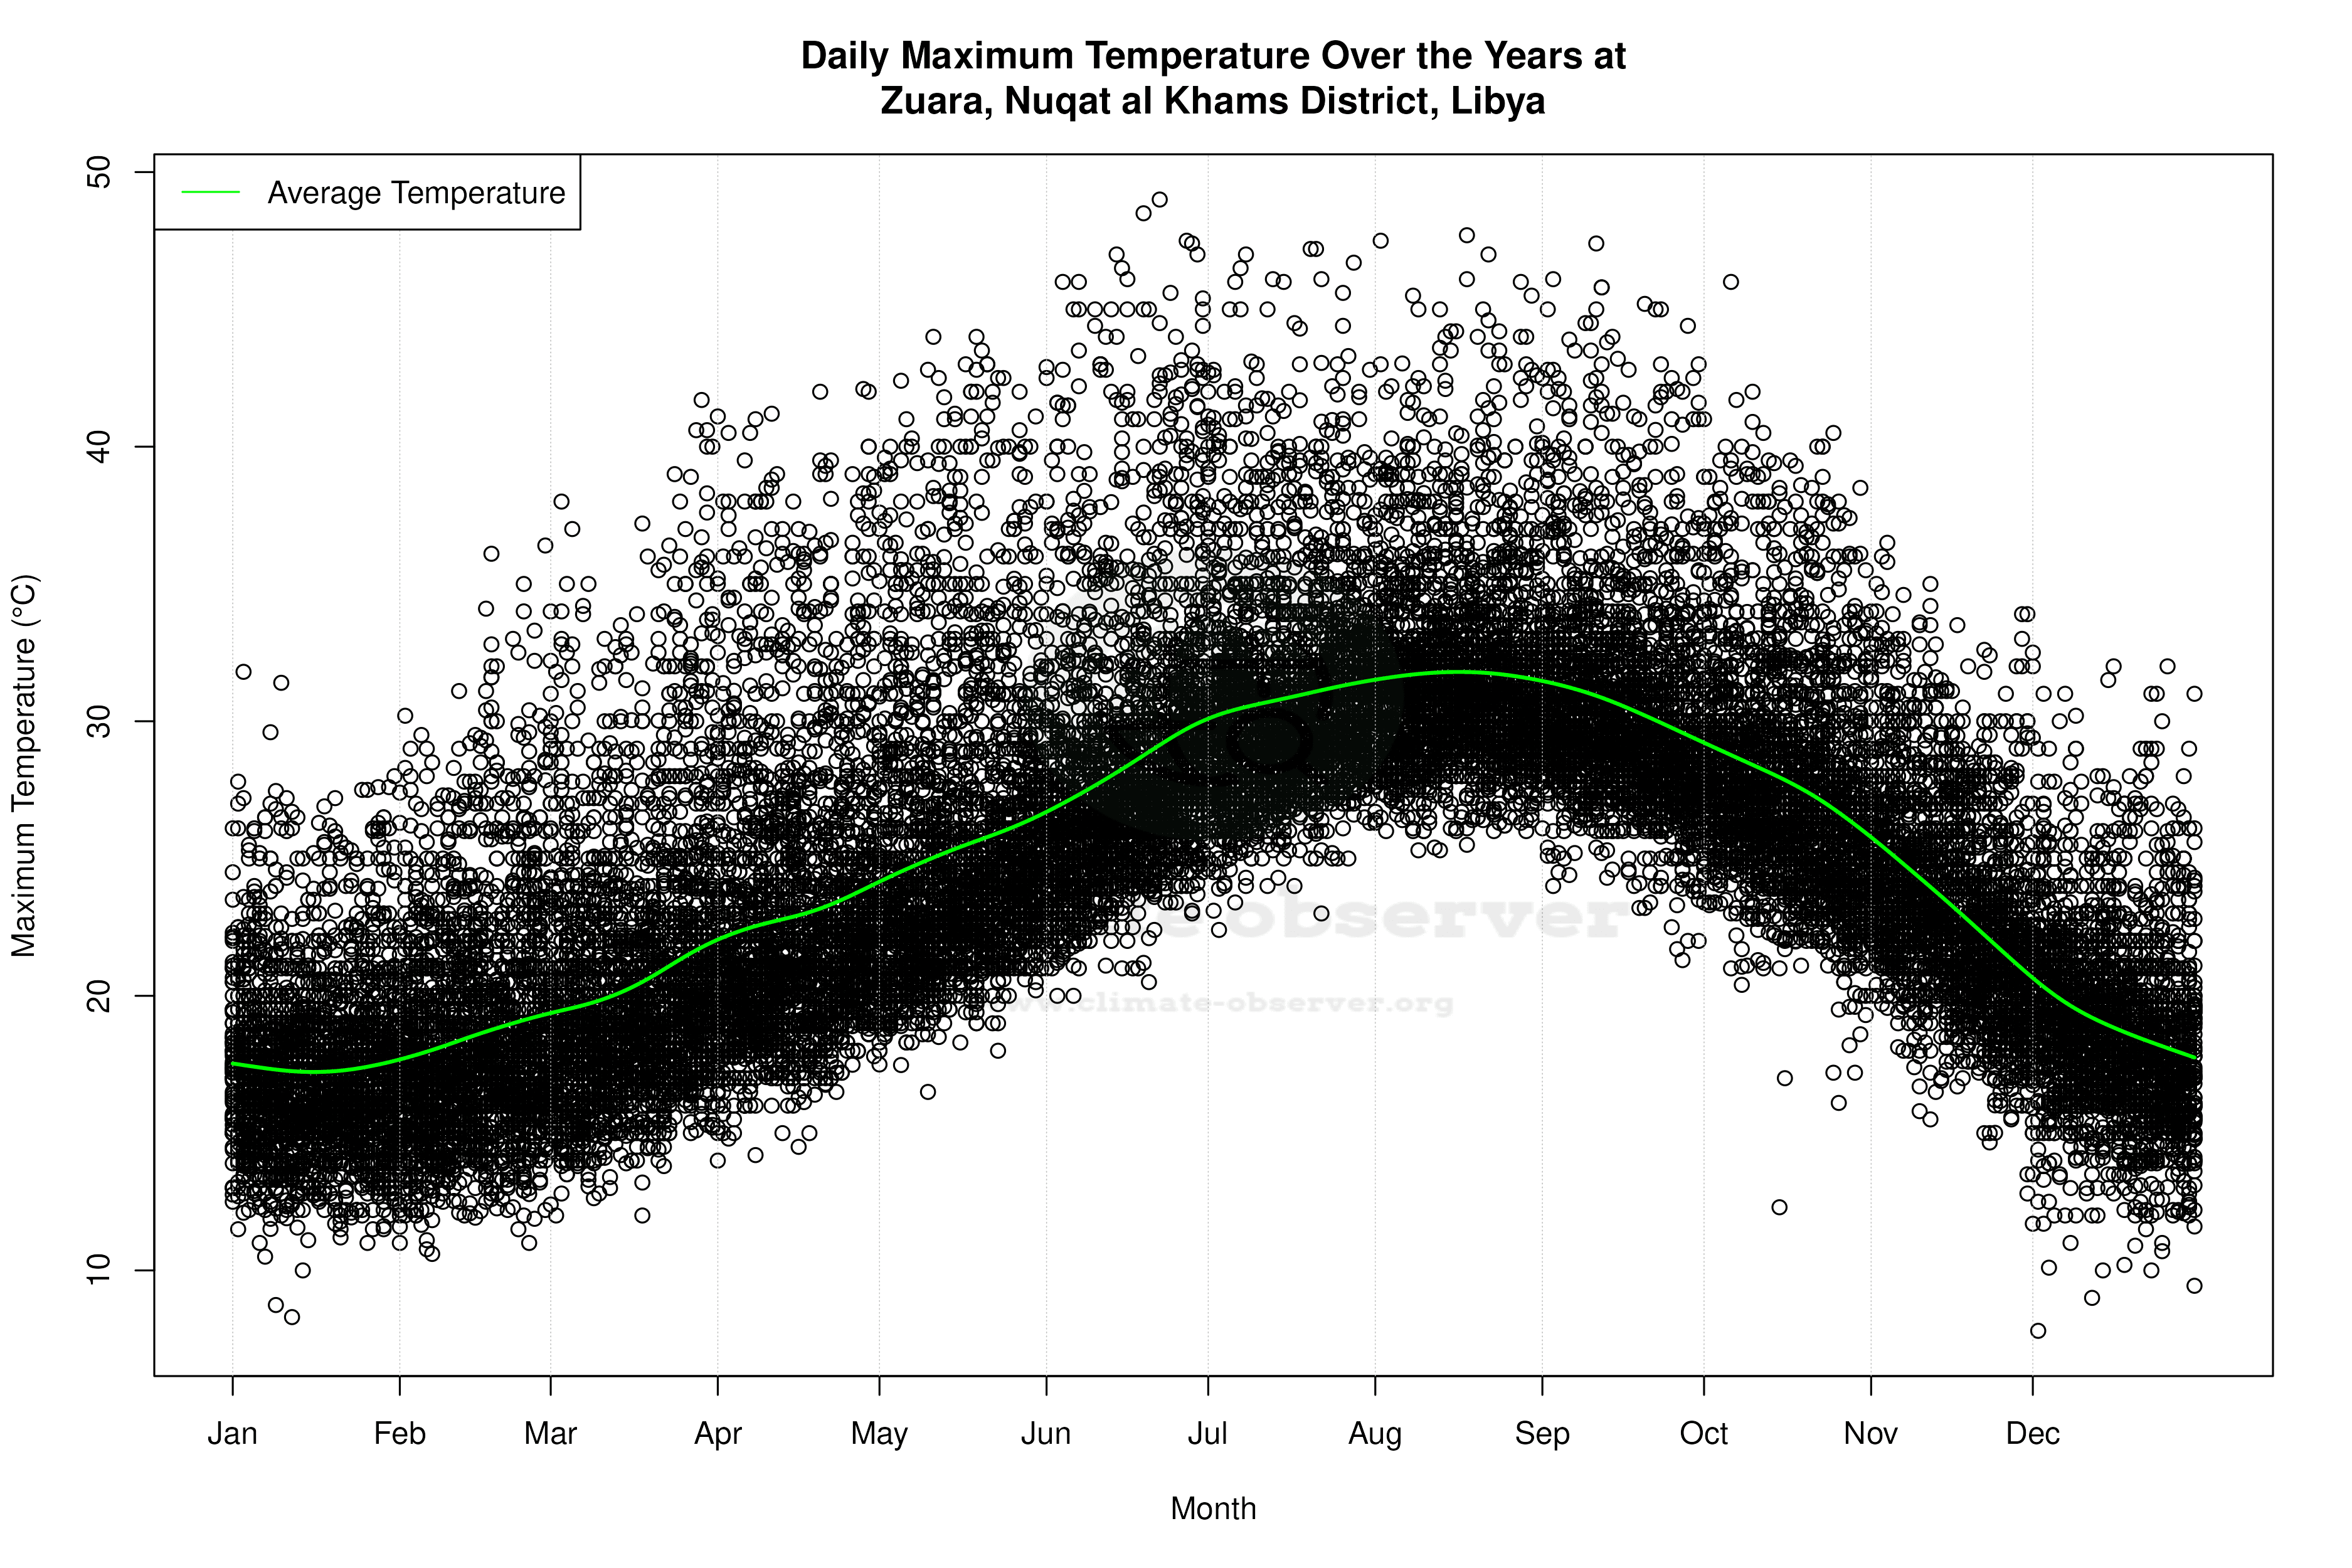


Average Max Temperature Throughout Year | 1 of 5
